Introduction
Breast cancer is a worldwide disease, which over
40,000 women succumb to each year in the US (1). Epidemiological studies suggest that
there are numerous risk factors associated with breast cancer,
including dietary fat and environmental estrogenic endocrine
disruptors.
One of the known risk factors of breast cancer is
obesity, which has become a major public health concern (2). The Centers for Disease Control and
Prevention reported that about 2/3 of adults in the US are
overweight and 1/3 are obese (2–4). The
incidence of breast cancer is increased with obesity, and morbidity
is increased in obese cancer patients as compared to cancer
patients with normal or low weight (2). The relationship between breast cancer
and obesity has been studied for more than 40 years (2,5).
Leptin, a transcriptional product of the ob
gene, plays a key role in breast cancer development and has been
studied since its discovery in 1994 (6). Besides its involvement in appetite
regulation and energy balance by sending signals to the
hypothalamus (7), leptin has a
number of other regulatory functions including ensuring normal
mammary gland development, bone development, fetal development, sex
maturation, angiogenesis, lactation, hematopoiesis and immune
responses (2,3). Additionally, leptin is required for
normal mammary gland development in rodents (2,8).
Animals and humans with defective leptin or with mutated leptin
receptor genes are obese (3,9). In
clinical studies, the serum leptin level in prostate cancer
patients was found to be higher than that in a healthy control
group, and was correlated with prostate-specific antigen (10,11).
In a breast cancer research program, 60% (20/35) of the patients
expressed leptin, while none out of four cases with normal breast
tissue expressed leptin (11,12).
Leptin has a direct mitogenic effect on human breast
cancer cells (12); therefore, the
inhibition of leptin may contribute to the prevention and treatment
of breast cancer (13,14). Leptin expression is up-regulated in
obesity (3) and promotes breast
cancer cell growth by directly affecting the estrogen receptor (ER)
pathway (3). Similar to other
growth factors and cytokines, leptin is present in human serum and
plays a role in human cancer development (3). Since leptin was found to be associated
with breast cancer (3,15), investigators have attempted to
determine the relationship and mechanisms of leptin action in
breast cancer (16–21). Ishikawa et al found that
leptin was overexpressed in breast cancer cells (13) and similarly concluded that high
leptin levels in obese breast cancer patients may play a role in
the development of antiestrogen resistance (16). Leptin is not expressed in normal
breast tissue but exists near malignant breast lesions (12). In addition to its mitogenic effects,
leptin promotes T47-D cell line proliferation (14) and a high level of leptin may
contribute to the development of a more aggressive malignant
phenotype (22). ICI 182,780 is a
pure estrogen antagonist approved for the treatment of breast
cancer patients who fail to respond to tamoxifen therapy. Treatment
of cells with ICI 182,780 resulted in rapid degradation of membrane
ER α, which reduced the nuclear expression of the receptor and ER
α-dependent transcription, and produced significant growth
inhibition. Leptin was able to counteract the cytostatic activity
of ICI 182,780 as well as the effect of this compound on the
expression of ER α and ER α-dependent transcription (23). The power of leptin to stimulate
human MCF-7 cell growth and to counteract the effects of ICI
182,780 strongly suggests that leptin acts as a paracrine/endocrine
growth factor towards mammary epithelial cells (16). Chen et al also found that
leptin increases ZR-75-1 breast cell growth by up-regulating cyclin
D1 and down-regulating P53 (24).
Since it stimulates estrogen biosynthesis through the induction of
aromatase activity and the modulation of ER α activity, leptin has
been characterized as a growth factor for breast cancer (3,25).
High levels of leptin in obese breast cancer patients may play a
notable role in breast cancer cell proliferation, invasion and
metastasis (2).
Estrogen has been regarded as a positive regulator
of leptin production (26), and
leptin levels in breast cancer patients treated with tamoxifen are
significantly higher than those in the control group (27). Zearalenone, a stable natural product
that mimics estrogen activity, is a carcinogen and thus hazardous
to human health (28). Zeranol (Z),
produced from zearalenone, is a non-estrogenic anabolic growth
promoter used to stimulate cattle growth in the US beef industry
(29). Zearalenone and Z bind to
the active site of human ER α and ER β in a similar manner to 17
β-estradiol (30). Since it is a
widespread food contaminant, it is difficult to avoid the intake of
Z (28). Based on its toxicity
information, the FDA approved the use of Z in the beef cattle
industry. However, the European Union declined to import beef
products with residues of hormonal implantation from the US due to
the potential health concerns. It was reported that Z enhanced the
proliferation of pre-adipocytes in beef heifers (31). A previous study found that Z did not
change the serum leptin level in growing wethers (32). At low concentrations, it increases
ER α-positive cell growth, but a high concentration of Z reduces
the growth of ER α-positive and -negative cell lines (33). Moreover, previous data showed that Z
was able to transform human normal breast epithelial cells and
increase human breast cell growth in a dose-dependent manner
(29). Additionally, Z
down-regulated the estrogen-regulated human breast cancer candidate
suppressor gene, protein tyrosine phosphatase γ expression
(34).
Gossypol, another natural polyphenolic compound
extracted from cottonseed and used as an anticancer chemopreventive
agent, inhibits breast cancer cell growth (35,36).
It is suggested that gossypol be used as a potential
chemopreventive food component. It was also demonstrated that
gossypol exhibits anticancer activity against multidrug resistant
human breast cancer cells (36,37),
with (-)-gossypol having the strongest effect among the three
isoforms (data not shown).
This study aimed to investigate the interaction of
leptin, Z and gossypol in breast cancer development, as well as the
mechanisms involved in the suppression of Z- and leptin-induced
proliferation of primary cultured human normal breast epithelial
cells using (-)-gossypol as the main chemopreventive agent.
Materials and methods
Animal treatment and blood sampling
Ralgro Magnum® (RM, commercial Z pallet)
was purchased from Schering-Plough Corp, Kenilworth, NJ, USA, in
the form of cartridges, each containing 72 mg Z. A total of 20
cross-bred Angus beef heifers (~1 year old) were purchased from the
Department of Animal Science. The animals were randomly divided
into two groups according to initial body weight. Animal treatment
was described in our previous publication (31). Z-containing sera (ZS) dropped from
the Z-implanted beef at day 0 (ZS-D0, prior to Z implantation) and
30 days post Z implantation (ZS-D30), and non-Z-containing serum
(NZS) from non-Z-implanted beef at day 0 (NZS-D0, prior to Z
implantation) and 30 days post Z implantation (NZS-D30) were
sterilized using a 50 ml conical filter tube, and stored at
−20°C.
Tissue culture
Human normal breast tissues were sterilized in 70%
ethanol for 30 sec, and then washed three times with fresh
Dulbecco’s modified Eagle’s medium and Ham’s F12 medium (DMEM/F12).
In vitro organ-cultured human normal breast tissues were
treated with leptin at 0, 1.5, 3.0 and 6.0 nM in DMEM/F12
supplemented with 5% dextran-coated charcoal (DCC)-stripped fetal
bovine serum (FBS) and cultured in a 10 cm2 cell culture
plate in a humidified incubator (5% CO2, 95% air, 37°C)
for 96 h. The medium was changed every 48 h.
Primary-cultured human normal breast
epithelial cell (HNBEC) isolation
The cultured human normal breast tissues were minced
and digested using a digestion buffer consisting of phenol red-free
high calcium (DMEM/F12, 1:1) (1.05 mM CaCl2) with 2%
bovine serum albumin (BSA) (Invitrogen, Carlsbad, CA, USA)
containing 10 ng/ml cholera toxin (Sigma, St. Louis, MO, USA) 6,300
U/ml collagenase (Invitrogen) and 100 U/ml hyaluronidase
(Calbiochem, Gibbstown, NJ, USA). The mixture was incubated in a
humidified incubator (5% CO2, 95% air, 37°C) overnight,
and the solution was transferred to a 50 ml tube and centrifuged at
1,200 rpm for 5 min. The upper, middle and lower layers were
separated and centrifuged again. The upper and middle layers,
containing pre-adipocytes and stromal cells, respectively, were
transferred to another 15-ml tube separately while the lower layer
containing epithelial cells remained in the tube. The pellets were
washed using DMEM/F12 with antibiotic-antimycotic (100 U/ml
penicillin G sodium, 100 μg/ml streptomycin sulfate and 0.25 μg/ml
amphotericin B) (Invitrogen) and centrifuged again. The pellets
were then washed three times. The final pellet in the tube
contained HNBECs and a few stromal cells. The pellet was
resuspended in 10 ml low calcium (0.04 mM CaCl2)
DMEM/F12 supplemented with 10% of low calcium FBS (Atlanta
Biologicals, Norcross, GA, USA) and then transferred into a T75
flask for culturing.
Cell culture
The isolated HNBECs were cultured in a 75
cm2 culture flask in a humidified incubator (5%
CO2, 95% air, 37°C) with 10 ml low calcium (0.04 mM
CaCl2) DMEM/F12 mixture (Atlanta Biologicals)
supplemented with 10% of Chelex-100- (Bio-Rad Laboratories,
Richmond, CA, USA) treated FBS (Invitrogen). Low-calcium DMEM/F12
was changed every two days. Only HNBECs survived in this medium;
thus, the growth of the stromal cells isolated from the same tissue
stopped and the purity of the HNBECs was guaranteed. When the cells
reached 85–90% confluence, they were washed with 10 ml of calcium-
and magnesium-free phosphate-buffered saline (PBS, pH 7.3), and
then trypsinized with 3 ml of 0.25% trypsin-5.3 mM EDTA
(Invitrogen) for 10 min at 37°C. Trypsinization was stopped by
adding 10 ml of DMEM/F12 with 10% FBS. Following centrifugation,
the dissociated cells were re-suspended in low-calcium DMEM/F12
with 10% low-calcium FBS and sub-cultured into 75 cm2
culture flasks at a ratio of 1:5. The experiments were conducted on
HNBECs not generated beyond the fourth passage.
Cell proliferation (MTT) assay
A total volume of 100 μl medium containing 4,000
HNBECs/well was seeded in 96-well plates in low-calcium DMEM/F12
and incubated in 37°C for 24 h. The following day, the medium was
replaced with 100 μl low-calcium DMEM/F12 supplemented with 0.2%
BSA and incubated in 37°C for a further 24 h. Following the
treatment, 1.5, 3.0 and 6.0 nM of leptin was administered to the
HNBECs isolated from non-leptin treated human normal breast tissues
for 0, 6, 12 and 24 h, and 0.1% DMSO was administered to the
control group. The proliferation of HNBECs was measured by adding
20 μl of a fresh mixture of
3-(4,5-dimethylthiazol-2-yl)-5-(3-carboxymethoxy-phenyl)-2-(4-sulfophenyl)-2H-tetrazolium
(MTS) and phenazine methosulfate (PMS) (20:1) solution (Promega,
Madison, WI, USA) to the wells. Following incubation at 37°C for
1–5 h, the optical density (OD) values were measured using a
kinetic microplate reader (Molecular Devices Cooperation, Menio
Park, CA, USA) at a 490 nm wavelength, and the cell growth was
compared.
The sera used in the MTT assay were: NZS-D0,
NZS-D30, ZS-D0 and ZS-D30. The concentration for NZS and ZS was
0.2, 1.0 and 5.0% in the cultured medium and was administered to
HNBECs isolated from the controls, as well as to 1.5 nM
leptin-cultured human normal breast tissues for 6 h. The cell
proliferation was measured as described above.
To investigate the effect of the combination of
leptin with (-)-gossypol in HNBEC growth, 4,000/well HNBECs
isolated from non-leptin cultured tissues were seeded in 96-well
plates in low-calcium DMEM/F12 and incubated at 37°C for 24 h. The
following day, the medium was replaced by 100 μl of low-calcium
DMEM/F12 supplemented with 0.2% BSA and incubated at 37°C for a
further 24 h. The treatment of 1.5, 3 and 6 nM leptin alone or in
combination with 10 μM (-)-gossypol, with 0.1% DMSO as the control
was administered, and the proliferation of HNBECs was measured
using the methods described above.
Cell treatment for RNA and PCR
analysis
Viable HNBECs (105/well) were seeded in
6-well plates in 5 ml low-calcium DMEM/F12 supplemented with 10%
low-calcium FBS. After 24 h, the medium was replaced with
low-calcium DMEM/F12 supplemented with 10% DCC-stripped low-calcium
FBS. The cells were cultured overnight. After 24 h, the medium was
changed and 24 h of treatment was administered. The concentration
for leptin was 1.5, 3 and 6 nM and that for Z was 5, 10 and 20 nM.
The combination of 1.5 nM leptin and 5 nM Z with or without 3 μM
(-)-gossypol was also administered, with 0.1% DMSO being
administered to the control group.
RNA isolation, cDNA synthesis and reverse
transcription polymerase chain reaction (RT-PCR)
Following the treatment of HNBECs for 24 h, the
cultured medium was collected for leptin measurement. Total RNA was
isolated in 1 ml TRIzol reagent (Invitrogen) according to the
manufacturer’s instructions (37).
The RT-PCR conditions were optimized for each primer and performed
using a thermocycler Gene Amp PCR (Eppendorf®, Westbury,
NY, USA). A volume of 2 μl of the newly-synthesized cDNA was used
as a template for RT-PCR. The PCR conditions were optimized for the
MgCl2 concentration, annealing temperature and cycle
number for the amplification of each of the PCR products (cyclin
D1, 36B4). Under optimal conditions, 1 unit of platinum Taq DNA
polymerase (Invitrogen) was added for a total volume of 25 μl.
The primers for cyclin D1 were: upper, 5′-GCT CCT
GTG CTG CGA AGT GG-3′ and lower, 5′-TGG AGG CGT CGG TGT AGA TG-3′
(product size 372 bp). The PCR conditions were: denaturing at 95°C
for 5 min, followed by 27 cycles at 94°C for 45 sec, 54°C for 45
sec, 72°C for 60 sec and extension at 72°C for 10 min. The primers
for 36B4 were: upper, 5′-AAA CTG CTG CCT CAT ATC CG-3′ and lower,
5′-TTT CAG CAA GTG GGA AGG TG-3′ (product size 563 bp). The PCR
conditions were: denaturing at 95°C for 5 min, followed by 24
cycles at 95°C for 60 sec, 63°C for 60 sec, 72°C for 60 sec and
extension at 72°C for 10 min. Pure H2O was used as a
negative control to detect genomic DNA contamination and 36B4 as
the internal control whose RNA is unmodified by treatment.
The final RT-PCR products (10 μl) mixed with 1 μl
10X loading buffer were separated on 1.5% agarose gel and
visualized by staining with ethidium bromide. Electronic images
were captured by a Fujifilm LAS-3000 image system (Fuji Film
Medical Systems USA, Inc. Stanford, CT, USA). The densities of
specific bands were quantified by ImageQuant software (Molecular
Dynamics, Sunnyvale, CA, USA). The results were presented as the
ratio of cyclin D1 to 36B4.
Western blotting assay
HNBECs isolated from non-leptin cultured tissue were
plated in a 10-cm2 culture dish with a density of
1×10⁶ viable cells/well with a 10 ml low-calcium
DMEM/F12 supplemented with 10% low-calcium FBS and cultured
overnight. The medium was then replaced with low-calcium DMEM/F12
supplemented with 10% DCC-treated low-calcium FBS and cultured for
a further 24 h. The primary cultured HNBECs were then treated with
1.5 and 3 nM leptin, 5, 10 and 20 nM Z or 0.1% DMSO as a vehicle
control. Following 24 h of treatment, culture media were collected
for the leptin measurement and proteins were isolated from the
control and treatment groups using M-PER® mammalian
protein extraction reagent (Pierce, Rockford, IL, USA) according to
the manufacturer’s instructions. Culture media were collected for
the leptin measurement, and 400 μl of extraction reagent was added
to each dish. Each dish was then placed on an orbital agitator to
be digested for 5 min. The digested products were collected and
transferred to a 1.5-ml centrifuge tube. The mixture was
centrifuged at 10,000 × g for 5 min, and the supernatant was then
transferred to a new 1.5-ml centrifuge tube. The protein
concentrations were measured using a Micro BCATM protein
assay reagent kit (Pierce) according to the manufacturer’s
instructions. Proteins (50 μg) from each treatment group were
separated by sodium dodecyl sulfate polyacrylamide gel
electrophoresis and transferred to a polyvinylidine fluoride
membrane (Bio-Rad Laboratory, Hercules, CA, USA). The membrane was
initially blotted in PBS-Tween 20 (PBST) containing 10% fat-free
dry milk for 1 h and then incubated with primary antibody (cyclin
D1 1:1,000 dilution, Cell Signaling Technology® Danvers,
MA, USA; β actin, 1:2,000 dilution, Santa Cruz Biotechnology, Inc.
Santa Cruz, CA, USA) for 1 h. The membrane was rinsed in PBST three
times, each time for 5 min. The membrane was then incubated with
the second antibody for 1 h. After the membrane had been washed
three times in PBST, it was detected using the Fuji Imaging System
(Fuji Film Medical Systems USA, Inc.). The images were captured by
FujiFilm LAS-300 image system (Fuji Film). The protein ratios of
cyclin D1 to β actin were calculated by measuring the density of
the specific band using Multi Gauge (V3.0) software.
Leptin measurement
The culture media were collected prior to protein
extraction as previously described. The human leptin immunoassay
kit for leptin measurement was purchased from R&D Systems
(Minneapolis, MN, USA). The particles in the cell culture
supernates were removed by centrifugation at 1,200 rpm for 5 min
and the assay was performed immediately according to the
manufacturer’s instructions. The assay was stopped by the addition
of 50 μl of stop solution to each well. The OD values were then
measured within 30 min using a kinetic microplate reader (Molecular
Devices Cooperation, Menio Park, CA, USA) at a wavelength of 450 nm
and the leptin concentration was compared.
Statistical analysis
The results for the cell proliferation assay are
presented as mean ± standard deviation (SD) of 4 replicate culture
wells. The analysis was performed using Minitab 15 (Minitab Inc.,
PA, USA). The statistical difference was determined using two
sample t-test analyses for independent samples. P<0.05 was
considered to be statistically significant.
Results
Leptin increased HNBEC proliferation
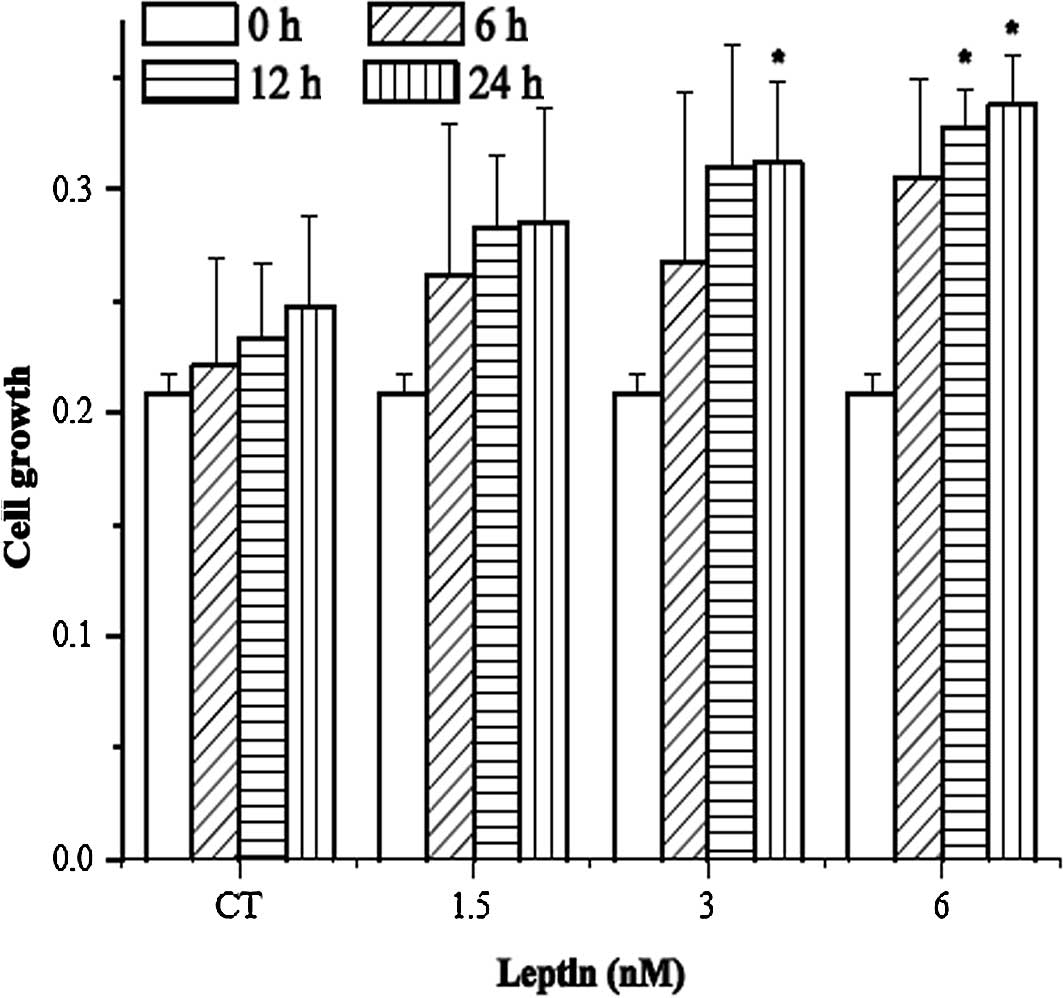
As shown in Fig. 1A,
leptin increased the growth of HNBECs. When compared to their
respective control groups, it was found that 3 nM leptin with 24 h
of treatment or 6 nM leptin with 12 h of treatment significantly
increases HNBEC growth. Fig. 1B
shows that (-)-gossypol inhibits HNBEC growth induced by 3 and 6 nM
leptin. A significant difference between leptin and the combination
of leptin with (-)-gossypol is noted.
Z-containing serum increases primary
cultured HNBEC growth
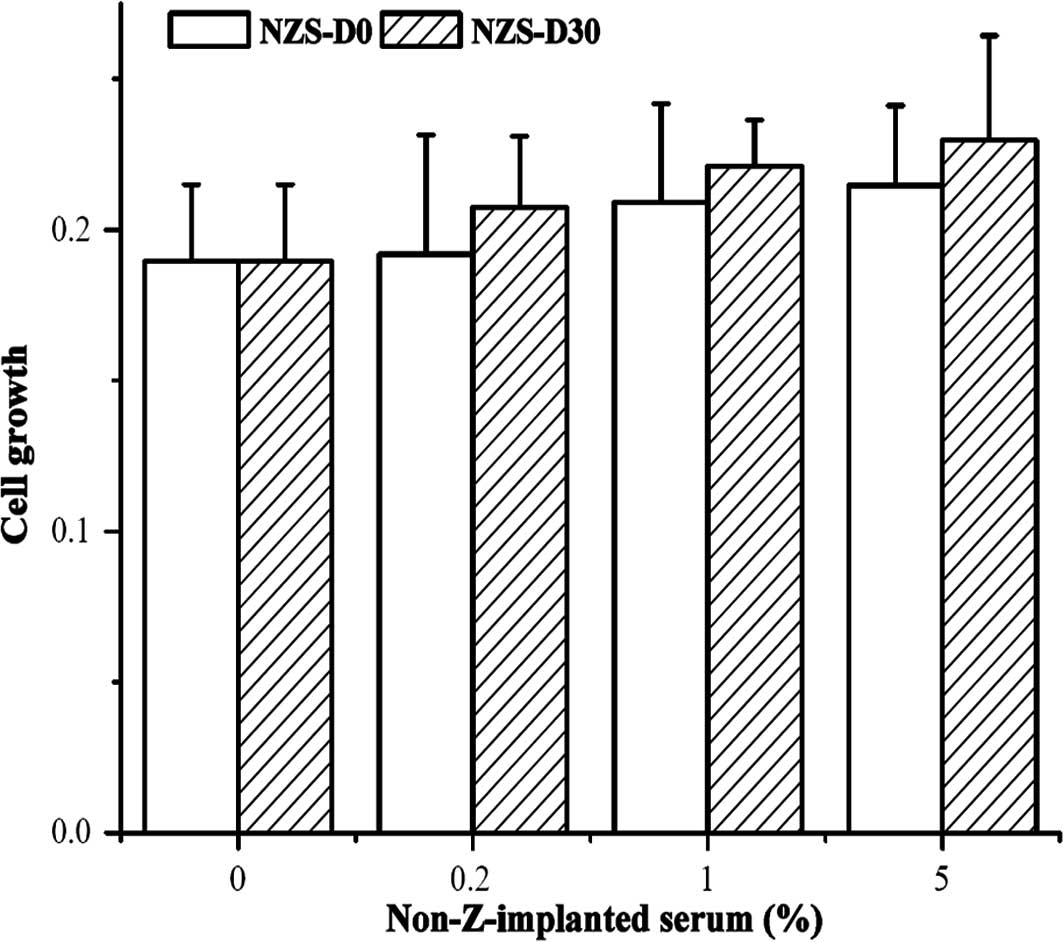
Fig. 2A shows that
NZS-D0 and NZS-D30 have no effect on HNBECs isolated from
non-leptin cultured tissue at any dose, but stimulated HNBEC growth
isolated from leptin cultured tissue at the same dose (Fig. 2B).
Fig. 2C shows that
ZS-D0 and ZS-D30 at concentrations of 0.2, 1 and 5% increased
HNBECs isolated from non-leptin cultured tissue as compared to the
control group, respectively. Fig.
2D shows that ZS-D0 and ZS-D30 at concentrations of 0.2, 1 and
5% increased HNBECs isolated from 1.5 nM of leptin cultured tissue
with a significant difference between ZS-D0 and ZS-D30 at all
doses.
The effect of leptin, zeranol and
(-)-gossypol in the cyclin D1 expression in breast cells
HNBECs were treated with 1.5, 3 and 6 nM leptin, 5,
10 and 20 nM Z, a combination of 5 nM Z and 1.5 nM leptin with or
without 3 μM (-)-gossypol for 24 h. Significant differences in
cyclin D1 expression were found between the control group and the
group treated with 3 and 6 nM leptin and 10 and 20 nM Z
(p<0.05). In addition, the combination of 1.5 nM leptin with 5
nM Z significantly increased HNBEC growth as compared to the
control group. However, the effective combination was inhibited by
adding 3 μM (-)-gossypol (Fig. 3A).
Consistent with the mRNA expression, cyclin D1 protein expression
also increased with the 24 h treatment of Z in HNBECs (Fig. 3B).
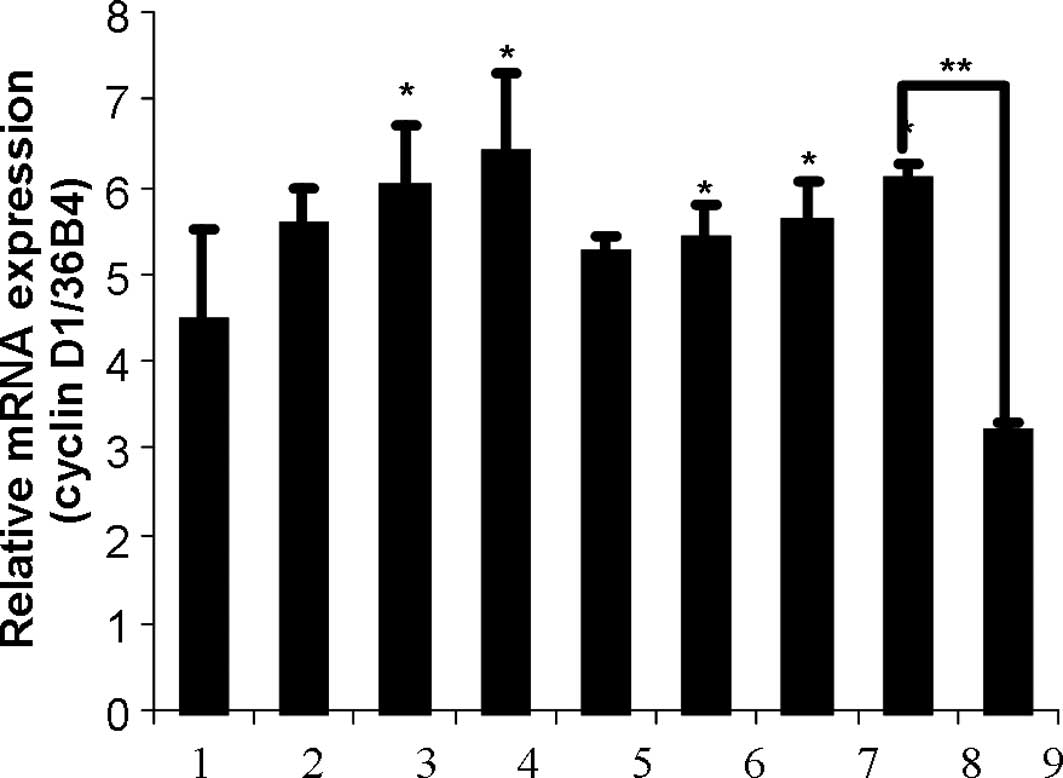 | Figure 3(A) Effects of leptin, zeranol and
(-)-gossypol on the cyclin D1 expression in HBNECs. HBNECs were
treated with 1.5, 3 or 6 nM leptin, 5, 10 or 20 nM zeranol, a
combination of 5 nM zeranol and 1.5 nM leptin with or without 3 μM
(-)-gossypol for 24 h. The bars show: 1, CT; 2, 1.5 nM lp; 3, 3 nM
lp; 4, 6 nM lp; 5, 5 nM Z; 6, 10 nM Z; 7, 20 nM Z; 8, 5 nM Z + 1.5
nM lp; 9, 5 nM Z + 1.5 nM lp + 3 μM (-)-gossypol. The RNA was then
extracted, cDNA was synthesized and cyclin D1 was amplified.
*Significant differences in cyclin D1 expression
compared to the control group (P<0.05). (B) Zeranol up-regulated
the cyclin D1 protein expression in HBNECs. Primary cultured human
normal breast epithelial cells were treated with 5, 10 and 20 nM
zeranol, and 0.1% DMSO was administered as a control. After 24 h,
protein was extracted, Western blot analysis was conducted and the
cyclin D1 expression was compared. |
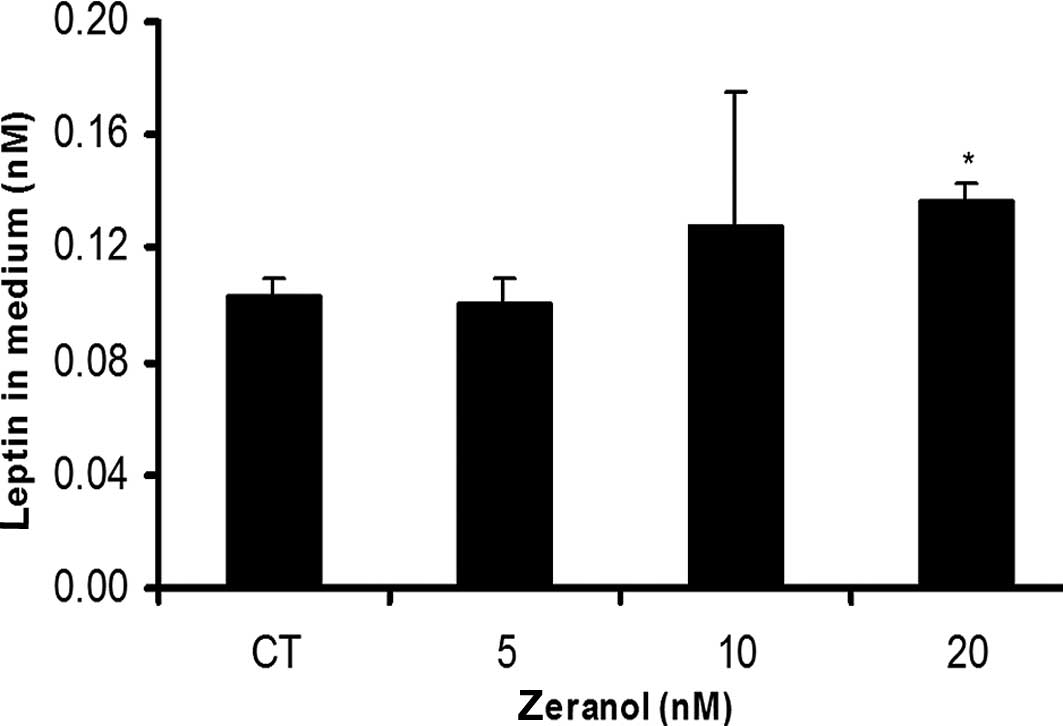
Zeranol increased HNBEC leptin
secretion
As shown in Fig. 4,
20 nM Z significantly increased leptin secretion in HNBECs, as
compared to the control group (p<0.05).
Discussion
Cyclin D1 is a cell cycle regulator that plays an
important role in cell growth. It is the product of the CCND1 gene
which is located on chromosome 11q13 (39). The cyclin-dependent kinases (CDKs)
cannot modulate cell growth without the cyclin subunit. By binding
to cyclin D, cyclin D-CDK 4/6 comprises the mechanism of the cell
cycle and affects the G1 phase in cell growth. The
cyclin D1 level is modulated by changing growth factors in the
medium used to culture the cells. Cyclin D1 was found to be
overexpressed in over 50% of breast cancer patients and is known as
one of the most overexpressed proteins in breast cancer (39). Leptin stimulates breast cancer cell
growth by up-regulating the cyclin D1 expression. Moreover,
Garofalo et al noted that leptin regulates estrogen
synthesis and ER α activity (3).
Besides regulating the cell cycle, it was noted that cyclin D1
correlates with ER (39). Cyclin D1
binds to ER and stimulates its transcriptional activities. The
cyclin D1 and ER complex may play a role in stimulating tumor cell
proliferation. It is crucial to elucidate whether leptin and Z
affect the cyclin D1 expression in primary cultured normal breast
epithelial cells.
Results of this study show that 6 nM leptin or 30 nM
Z alone had no effect on the cyclin D1 expression. However, their
combination significantly increased the cyclin D1 expression as
compared to the control group. In our cell proliferation assay,
cells isolated from leptin exposure tissues increased their
sensitivity to Z. This increase is partially explained by the fact
that the combination resulted in a high expression of cyclin D1. A
previous study noted that the serum level of leptin in breast
cancer patients is higher than that in controls (27). It is likely that if obese healthy
women or breast cancer patients have higher leptin in their serum,
the sensitivity of normal or cancerous breast cells is increased to
the presence of Z in beef. Consequently, these results suggest a
possible correlation between obesity and breast neoplasia and
indicate a potential risk for breast neoplasia in obese
individuals, particularly in those consuming beef from animals
implanted with Z.
Of noteis that leptin secretion was increased by the
treatment of Z in HNBECs; thus, Z amplified the leptin activity. It
was reported that leptin affects transformed breast cancer cells to
induce an alteration to a more aggressive phenotype, and leptin
potentially serves as a tumor marker. This result shows that Z is
potentially more harmful to obese individuals than those with
normal weight by increasing the risk of breast neoplasia (33) since the consumption of Z-containing
products by the obese individuals increases their chances of
developing breast neoplasia. However, (-)-gossypol has been found
to reverse the effect of the combination of leptin with Z on cell
growth and may therefore be used in the treatment of breast cancer
patients.
The effect of ZS in human normal breast epithelial
cell growth was also evaluated. We found that 2.5% of ZS harvested
from 60-day post 72 mg Z pellet-implanted beef heifers transformed
the human normal breast epithelial cell line, MCF-10A, to breast
neoplasia cells in a 21-day culture (unpublished data). Our current
data showed that there was no observable proliferative stimulation
from exposure to NZS for 6 h in HNBECs isolated from the non-leptin
cultured tissues (Fig. 2A).
However, the proliferation of HNBECs isolated from 1.5 nM leptin
cultured tissues was significantly increased by treatment of ZS at
all doses for 6 h (Fig. 2D). As
shown in Figs. 2C and D, ZS
increases HNBECs isolated from leptin cultured tissues more than
that isolated from non-leptin cultured tissues. A comparison of
Fig. 2A to Fig. 2B and Fig. 2C to Fig.
2D showed that HNBECs isolated from 1.5 nM of leptin cultured
tissues developed more rapidly than those isolated from non-leptin
cultured tissues with the same treatment of ZS or NZS. This result
shows that leptin stimulates HNBEC growth.
On the other hand, a comparison of Fig. 2A to Fig.
2C and Fig. 2B to Fig. 2D showed that ZS increases HNBECs
isolated from leptin cultured tissues more than those isolated from
non-leptin cultured tissues. The stimulatory effect of ZS is
greater than that of NZS in HNBECs isolated from with or without
leptin cultured tissues. A significant difference between the ZS-D0
and ZS-D30 at concentrations of 0.2, 1 and 5% was only found in the
HNBECs isolated from 1.5 nM of leptin cultured tissues. The only
difference between NZS and ZS was the implantation of Z pellets and
the presence of metabolites in the blood. This result suggests that
certain as yet undefined growth factors responsible for stimulatory
action in HNBEC proliferation are secreted by the Z-implanted
heifers in the blood. Therefore, we attribute the stimulatory
effect of ZS on HNBECs to the implantation of Z.
It appears that leptin stimulates HNBEC growth,
while ZS-D30 improves leptin-induced growth. Considering the leptin
level is higher in obese women than in normal or lower weight
women, this result suggests that obese women are more sensitive to
Z. Additionally, it was shown that obese women may have a higher
risk of breast neoplasia due to the consumption of beef products
containing Z.
In conclusion, we found that the mitogenic activity
of Z in human normal breast epithelial cells is enhanced by leptin
and inhibited by gossypol. Z appears to increase HNBEC growth by
increasing the cyclin D1 expression. Leptin improves HNBEC
sensitivity to Z and Z strengthens the effect of leptin by
increasing leptin secretion in HNBECs. Leptin and Z up-regulate the
cyclin D1 expression in HNBECs. However, (-)-gossypol counteracts
the growth of breast cancer cells induced by leptin alone or in
combination with Z by down-regulating the cyclin D1 mRNA
expression. Further mechanisms are currently being investigated and
research on the Z metabolites that stimulate HNBEC growth is
ongoing.
Acknowledgements
This study was supported by NIH grant R01 ES
015212.
References
|
1
|
Jemal A, Siegel R, Ward E, Hao Y, Xu J and
Thun MJ: Cancer statistics. CA Cancer J Clin. 59:225–249. 2009.
|
|
2
|
Calle EE and Thun MJ: Obesity and cancer.
Oncogene. 23:6365–6378. 2004. View Article : Google Scholar
|
|
3
|
Garofalo C and Surmacz E: Leptin and
cancer. J Cell Physiol. 207:12–22. 2006. View Article : Google Scholar
|
|
4
|
Lorincz AM and Sukumar S: Molecular links
between obesity and breast cancer. Endocr Relat Cancer. 13:279–292.
2006. View Article : Google Scholar : PubMed/NCBI
|
|
5
|
De Waard F, Baanders-Vanhalewijn EA and
Huizinga J: The bimodal age distribution of patients with mammary
carcinoma; evidence for the existence of 2 types of human breast
cancer. Cancer. 17:141–151. 1964.PubMed/NCBI
|
|
6
|
Zhang Y, Proenca R, Maffei M, Barone M,
Leopold L and Friedman JM: Positional cloning of the mouse obese
gene and its human homologue. Nature. 372:425–432. 1994. View Article : Google Scholar : PubMed/NCBI
|
|
7
|
Rosen ED and Spiegelman BM: Adipocytes as
regulators of energy balance and glucose homeostasis. Nature.
444:847–853. 2006. View Article : Google Scholar : PubMed/NCBI
|
|
8
|
Kiess W, Petzold S, Topfer M, et al:
Adipocytes and adipose tissue. Best Pract Res Clin Endocrinol
Metab. 22:135–153. 2008. View Article : Google Scholar
|
|
9
|
Clement K, Vaisse C, Lahlou N, et al: A
mutation in the human leptin receptor gene causes obesity and
pituitary dysfunction. Nature. 392:398–401. 1998. View Article : Google Scholar : PubMed/NCBI
|
|
10
|
Buschemeyer WC III and Freedland SJ:
Obesity and prostate cancer: epidemiology and clinical
implications. Eur Urol. 52:331–343. 2007. View Article : Google Scholar : PubMed/NCBI
|
|
11
|
Caldefie-Chezet F, Damez M, de Latour M,
et al: Leptin: a proliferative factor for breast cancer? Study on
human ductal carcinoma. Biochem Biophys Res Commun. 334:737–741.
2005. View Article : Google Scholar : PubMed/NCBI
|
|
12
|
Rose DP, Komninou D and Stephenson GD:
Obesity, adipocytokines, and insulin resistance in breast cancer.
Obes Rev. 5:153–165. 2004. View Article : Google Scholar : PubMed/NCBI
|
|
13
|
Ishikawa M, Kitayama J and Nagawa H:
Enhanced expression of leptin and leptin receptor (OB-R) in human
breast cancer. Clin Cancer Res. 10:4325–4331. 2004. View Article : Google Scholar : PubMed/NCBI
|
|
14
|
Laud K, Gourdou I, Pessemesse L, Peyrat JP
and Djiane J: Identification of leptin receptors in human breast
cancer: functional activity in the T47-D breast cancer cell line.
Mol Cell Endocrinol. 188:219–226. 2002. View Article : Google Scholar : PubMed/NCBI
|
|
15
|
Calle EE, Rodriguez C, Walker-Thurmond K
and Thun MJ: Overweight, obesity, and mortality from cancer in a
prospectively studied cohort of U.S. adults. N Engl J Med.
348:1625–1638. 2003. View Article : Google Scholar : PubMed/NCBI
|
|
16
|
Garofalo C, Sisci D and Surmacz E: Leptin
interferes with the effects of the antiestrogen ICI 182,780 in
MCF-7 breast cancer cells. Clin Cancer Res. 10:6466–6475. 2004.
View Article : Google Scholar : PubMed/NCBI
|
|
17
|
Catalano S, Mauro L, Marsico S, et al:
Leptin induces, via ERK1/ERK2 signal, functional activation of
estrogen receptor alpha in MCF-7 cells. J Biol Chem.
279:19908–19915. 2004. View Article : Google Scholar : PubMed/NCBI
|
|
18
|
Frankenberry KA, Skinner H, Somasundar P,
McFadden DW and Vona-Davis LC: Leptin receptor expression and cell
signaling in breast cancer. Int J Oncol. 28:985–993.
2006.PubMed/NCBI
|
|
19
|
Saxena NK, Vertino PM, Anania FA and
Sharma D: Leptin-induced growth stimulation of breast cancer cells
involves recruitment of histone acetyltransferases and mediator
complex to CYCLIN D1 promoter via activation of Stat3. J Biol Chem.
282:13316–13325. 2007. View Article : Google Scholar
|
|
20
|
Catalano S, Marsico S, Giordano C, Mauro
L, Rizza P, Panno ML and Ando S: Leptin enhances, via AP-1,
expression of aromatase in the MCF-7 cell line. J Biol Chem.
278:28668–28676. 2003. View Article : Google Scholar : PubMed/NCBI
|
|
21
|
Yin N, Wang D, Zhang H, et al: Molecular
mechanisms involved in the growth stimulation of breast cancer
cells by leptin. Cancer Res. 64:5870–5875. 2004. View Article : Google Scholar : PubMed/NCBI
|
|
22
|
Goodwin PJ, Ennis M, Fantus IG, Pritchard
KI, Trudeau ME, Koo J and Hood N: Is leptin a mediator of adverse
prognostic effects of obesity in breast cancer? J Clin Oncol.
23:6037–6042. 2005. View Article : Google Scholar : PubMed/NCBI
|
|
23
|
Cirillo D, Rachiglio AM, la Montagna R,
Giordano A and Normanno N: Leptin signaling in breast cancer: an
overview. J Cell Biochem. 105:956–964. 2008. View Article : Google Scholar : PubMed/NCBI
|
|
24
|
Chen C, Chang YC, Liu CL, Chang KJ and Guo
IC: Leptin-induced growth of human ZR-75-1 breast cancer cells is
associated with up-regulation of cyclin D1 and c-Myc and
down-regulation of tumor suppressor p53 and p21WAF1/CIP1. Breast
Cancer Res Treat. 98:121–132. 2006. View Article : Google Scholar : PubMed/NCBI
|
|
25
|
Garofalo C, Koda M, Cascio S, et al:
Increased expression of leptin and the leptin receptor as a marker
of breast cancer progression: possible role of obesity-related
stimuli. Clin Cancer Res. 12:1447–1453. 2006. View Article : Google Scholar
|
|
26
|
Thorn SR, Meyer MJ, Van Amburgh ME and
Boisclair YR: Effect of estrogen on leptin and expression of leptin
receptor transcripts in prepubertal dairy heifers. J Dairy Sci.
90:3742–3750. 2007. View Article : Google Scholar : PubMed/NCBI
|
|
27
|
Ozet A, Arpaci F, Yilmaz MI, et al:
Effects of tamoxifen on the serum leptin level in patients with
breast cancer. Jpn J Clin Oncol. 31:424–427. 2001. View Article : Google Scholar : PubMed/NCBI
|
|
28
|
Coe JE, Ishak KG, Ward JM and Ross MJ:
Tamoxifen prevents induction of hepatic neoplasia by zeranol, an
estrogenic food contaminant. Proc Natl Acad Sci USA. 89:1085–1089.
1992. View Article : Google Scholar : PubMed/NCBI
|
|
29
|
Liu S and Lin YC: Transformation of
MCF-10A human breast epithelial cells by zeranol and
estradiol-17beta. Breast J. 10:514–521. 2004. View Article : Google Scholar : PubMed/NCBI
|
|
30
|
Takemura H, Shim JY, Sayama K, Tsubura A,
Zhu BT and Shimoi K: Characterization of the estrogenic activities
of zearalenone and zeranol in vivo and in vitro. J Steroid Biochem
Mol Biol. 103:170–177. 2007. View Article : Google Scholar : PubMed/NCBI
|
|
31
|
Ye W, Xu P, Threlfall WR, et al: Zeranol
enhances the proliferation of pre-adipocytes in beef heifers.
Anticancer Res. 29:5045–5052. 2009.PubMed/NCBI
|
|
32
|
Narro LA, Thomas MG, Silver GA, Rozeboom
KJ and Keisler DH: Body composition, leptin, and the leptin
receptor and their relationship to the growth hormone (GH) axis in
growing wethers treated with zeranol. Domest Anim Endocrinol.
24:243–255. 2003. View Article : Google Scholar : PubMed/NCBI
|
|
33
|
Yuri T, Tsukamoto R, Miki K, Uehara N,
Matsuoka Y and Tsubura A: Biphasic effects of zeranol on the growth
of estrogen receptor-positive human breast carcinoma cells. Oncol
Rep. 16:1307–1312. 2006.PubMed/NCBI
|
|
34
|
Liu S, Sugimoto Y, Sorio C, Tecchio C and
Lin YC: Function analysis of estrogenically regulated protein
tyrosine phosphatase gamma (PTPgamma) in human breast cancer cell
line MCF-7. Oncogene. 23:1256–1262. 2004. View Article : Google Scholar : PubMed/NCBI
|
|
35
|
Gilbert NE, O’Reilly JE, Chang CJ, Lin YC
and Brueggemeier RW: Antiproliferative activity of gossypol and
gossypolone on human breast cancer cells. Life Sci. 57:61–67. 1995.
View Article : Google Scholar : PubMed/NCBI
|
|
36
|
Ye W, Chang HL, Wang LS, et al: Modulation
of multidrug resistance gene expression in human breast cancer
cells by (-)-gossypol-enriched cottonseed oil. Anticancer Res.
27:107–116. 2007.PubMed/NCBI
|
|
37
|
Xu P, Ye W, Jen R, Lin SH, Kuo CT and Lin
YC: Mitogenic activity of zeranol in human breast cancer cells is
enhanced by leptin and suppressed by gossypol. Anticancer Res.
29:4621–4628. 2009.PubMed/NCBI
|
|
38
|
Lorincz AM and Sukumar S: Molecular links
between obesity and breast cancer. Endocr Relat Cancer. 13:279–292.
2006. View Article : Google Scholar : PubMed/NCBI
|
|
39
|
Roy PG and Thompson AM: Cyclin D1 and
breast cancer. Breast. 15:718–727. 2006. View Article : Google Scholar : PubMed/NCBI
|