Introduction
A number of studies have demonstrated a positive
association between stress and cancer (1,2).
However, using conventional microscopy analysis, we recently showed
that this correlation does not appear to apply to chronic stress
and oral squamous cell carcinoma (OSCC) (3).
The initial changes that occur at the cell nucleus
are not detected by the conventional H&E staining technique
(4). Changes in the cell nucleus
can be detected early through analysis of the nucleolar organizer
regions (NORs) by silver staining, used to evaluate proliferative
and malignant activities. In this manner, benign tumors are
distinguished from malignant ones, and tumor grade and prognosis
are determined (5–8). NORs are loops of DNA occurring within
nucleoli that encode for ribosomal RNA. NORs are closely associated
with non-histone proteins, known as argyrophilic staining of
nucleolar organizer regions (AgNOR), which may be visualized by a
histochemical technique relying on their argyrophilic
properties.
The AgNOR number is directly proportional to the
speed of the cell cycle. For this reason, cell proliferation has a
prognostic value, since high proliferative activity is associated
with poor prognosis (9). Various
AgNOR parameters have been established to objectively evaluate the
variations that occur between one tissue condition and another.
These include number and distribution pattern (the most commonly
used parameters), as well as mean nucleus area, size, shape and
AgNOR location, which have proven to be significant factors in
previous studies on oral mucosa lesions (10).
The number of AgNORs per nucleus has been widely
used and described in the literature (6); this parameter varies in the nucleoli
according to the transcriptional activity of ribosomal RNA
(11). Various studies have linked
higher levels in the number of AgNORs with the degree of malignancy
of the lesions (4,8,12,13)
and with poor prognosis (13).
In terms of their distribution pattern, AgNORs have
been suggested to form groups or clusters of malignant lesions when
compared with benign tumors (8,13,14).
Two distribution parameters have been established: clustered and
dispersed. When AgNORs have points that are in contact, they are
considered to be clustered, whereas those that have no points of
contact are classified as dispersed (8).
The aim of this study was to analyze the number and
distribution pattern of NORs using the AgNOR staining technique on
samples collected in a previous study by Rivera et al
(3) that combined a model of
chronic stress and chemical carcinogenesis in CF-1 mouse
tongues.
Materials and methods
A retrospective study design was used to conduct
this investigation. The independent variable was stress exposure;
the dependent variables were the number and distribution of
NORs.
Samples
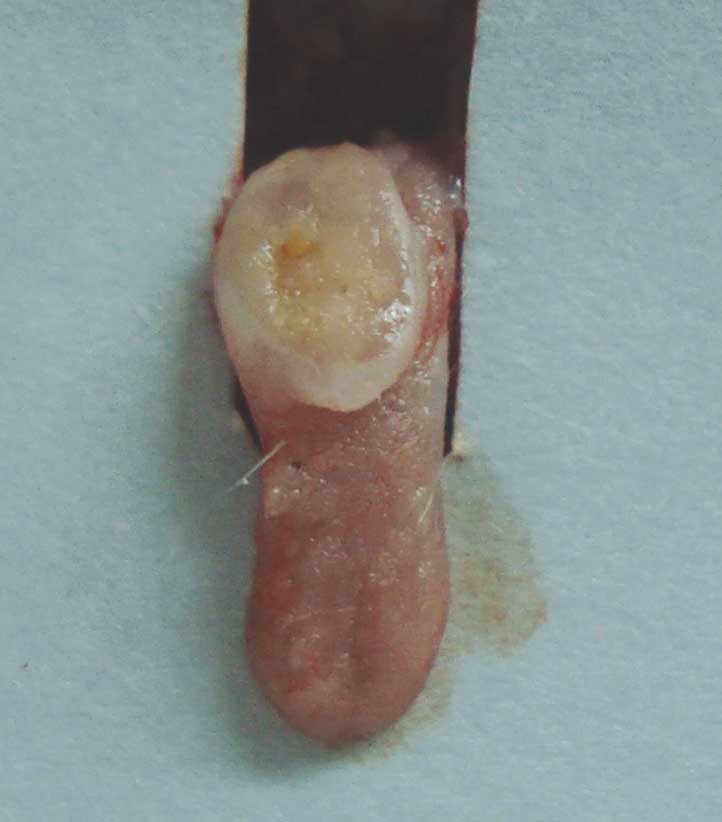
This study involved 31 cases from a previous
investigation (3), which examined
the role of chronic restraint stress on the incidence and severity
of lingual SCC induced by 4-nitroquinoline-1-oxide (4-NQO) in CF-1
mice (Fig. 1). The study was
approved by the Bioethics Committee of the University of Talca.
The samples belonged to two experimental groups. The
RS/4-NQO group (n=17) received two treatments: restraint stress and
induction of chemical carcinogenesis. The 4-NQO group (n=14)
received induction of chemical carcinogenesis without restraint
stress. In all cases, we evaluated NORs in tumor cells (AgNOR count
and distribution) using a semi-quantitative method.
AgNOR staining
The AgNOR staining technique was applied to all
paraffin-embedded specimens, with some modifications to the method
reported by Ploton et al (15). The working solution consisted of two
parts 50% silver nitrate solution and one part mixture of 2%
gelatin and 1% formic acid, prepared immediately prior to the
staining procedure. Sections were hydrated in decreasing
concentrations of alcohol, rinsed in distilled water and
subsequently incubated in freshly prepared working solution for 30
min at room temperature in the dark. Sections were then washed in
distilled water for 1 min, dehydrated in increasing concentrations
of alcohol, cleaned and mounted in Disterine Plastiser Xylene (DPX)
medium. NORs were counted in tumor cells, appearing as brownish
black intranuclear dots on a pale yellow background.
Number and distribution of AgNORs
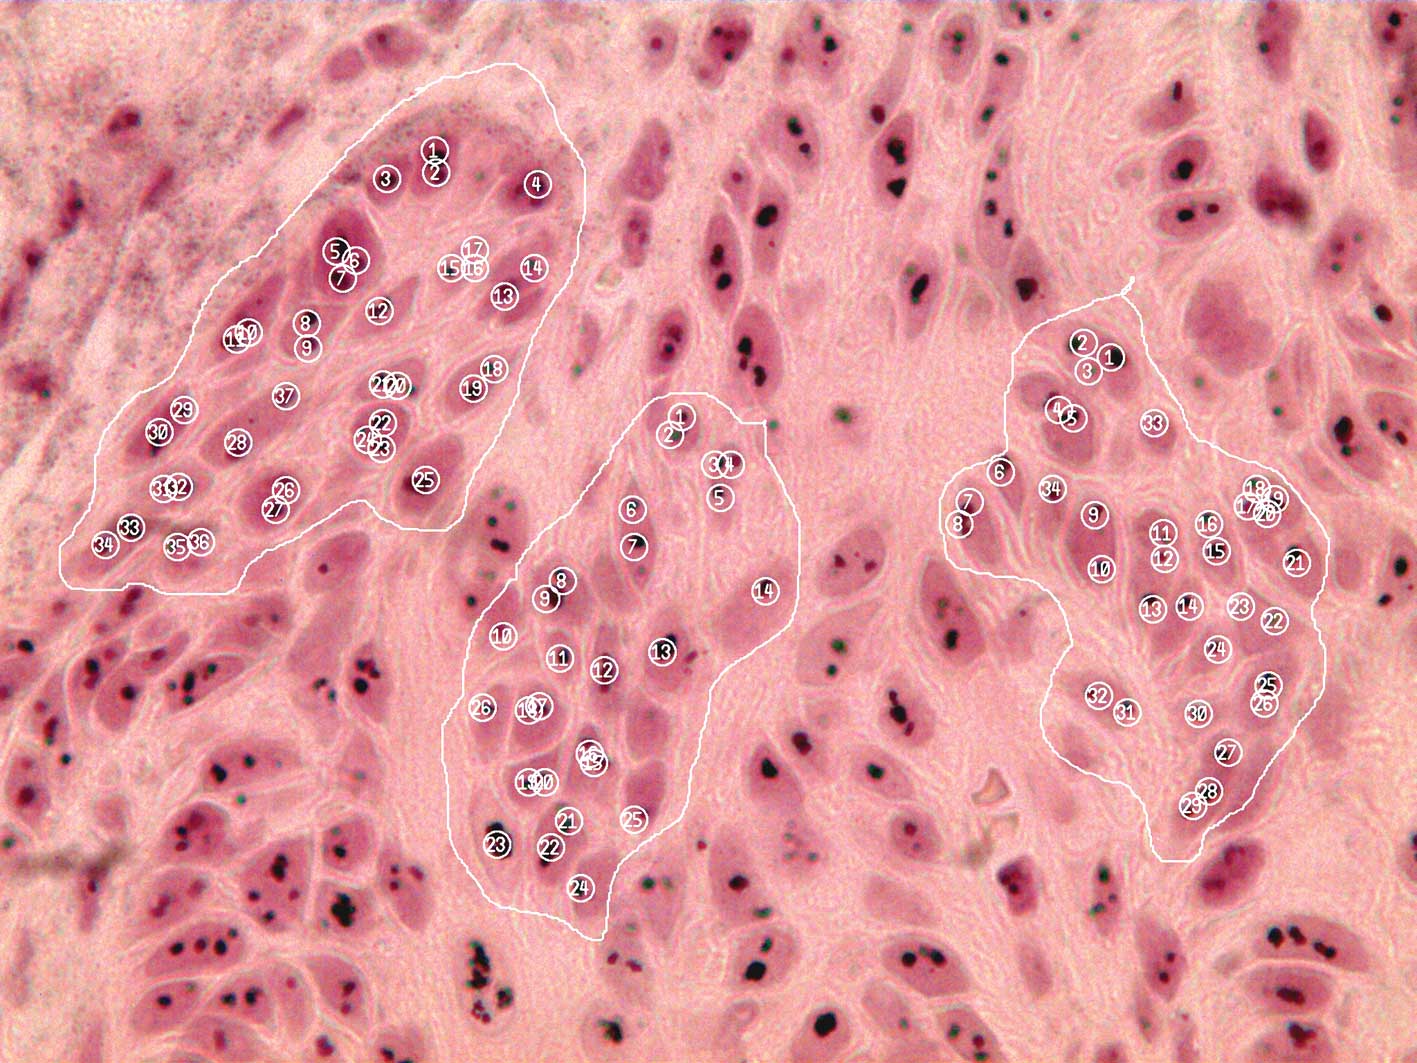
In the areas of squamous cell carcinomas, the plates
were photographed at a magnification of ×100, using a
Micrometrics® camera (Micrometrics® 122CU
1.3-megapixel 1/2′) attached to an optical microscope. Individual
microphotographs were morphometrically evaluated using a
semi-automatic electronic image analyzer (Microscope Software
AxioVision LE), for which measurements were performed in 2 fields
of 100 cells each to record the mean number of AgNORs per cell and
the distribution pattern of AgNORs. Fig. 2 shows how the counting was performed
manually using the software.
Analyses were performed by an oral pathologist
(B.V.) from the University of Talca. The observer was unaware of
the group to which the study samples belonged (single-blinded). We
determined the number and distribution pattern of AgNORs per cell,
according to the categories used in a previous study (8): clustered, AgNORs in contact; and
dispersed, no AgNORs in contact.
Statistical analysis
Qualitative data were analyzed using the Chi-square
statistical test with Pearson’s correlation. Quantitative data were
studied using the Mann-Whitney U test. P≤0.05 was considered to be
statistically significant for all tests.
Results
Severity of invasive carcinoma according
to the analysis of AgNORs
Restraint stress did not increase the severity
according to the number of AgNORs per cell of 4-NQO-induced OSCC
tongue lesions in CF-1 mice. Table
I shows that the two groups of mice demonstrated similar
results for the number of AgNORs per cell. The RS/4-NQO group had a
mean of 2.44 AgNORs per cell, compared to 2.41 for the 4-NQO group.
The Mann-Whitney U test was used to evaluate the difference between
the groups. No statistically significant differences were found
between the groups (p=0.97).
 | Table IAgNOR analysis in OSCC tongue lesions
induced by 4-NQO. |
Table I
AgNOR analysis in OSCC tongue lesions
induced by 4-NQO.
| Treatment | Samples | AgNORs in OSCC |
|---|
|
|---|
| AgNOR number by cell
(mean ± SD) | AgNOR distribution
pattern |
|---|
|
|---|
| Clustered | Dispersed |
|---|
| RS/4-NQO | 14 | 2.41±0.45 | 9 | 5 |
| 4-NQO | 17 | 2.44±0.56 | 7 | 10 |
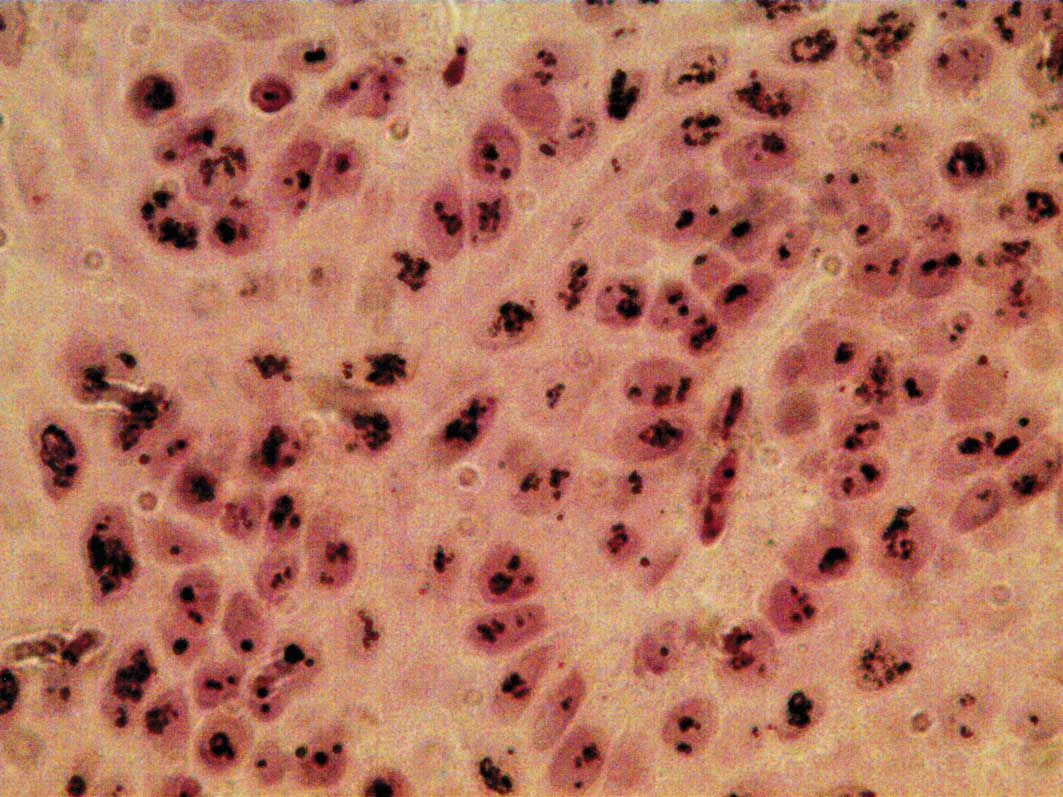
Restraint stress did not increase the severity
according to the distribution pattern of AgNORs of 4-NQO-induced
OSCC tongue lesions in CF-1 mice. Fig.
3 shows the distribution pattern prevailing in each group. The
RS/4-NQO group revealed 9 (64.3%) AgNOR cases with a clustered
distribution pattern and 5 (35.7%) dispersed ones. The 4-NQO group
had 7 (41.2%) clustered and 10 (58.8%) dispersed cases (Table I). The Chi-square test with
Pearson’s correlation revealed that the difference between the two
groups was not statistically significant (p=0.2).
Discussion
The histochemical technique with silver staining has
been used in a number of investigations since the early 1980s
(16) for the purpose of
visualizing NORs found in acrocentric chromosomes. Since its
beginnings, this technique has undergone various changes under the
enhanced expression of AgNORs, in an attempt to eliminate or reduce
those artifacts that may interfere with viewing them.
The application of morphological methods to study
cell proliferation is affected by various factors that can escape
any observer (13). During the
observation of samples in this study, background staining was
detected that hindered to a certain extent the process of analysis
and identification of AgNORs, which is consistent with observations
described by Lindner et al (17).
It has been reported that the number of AgNORs per
cell increased, and this increase is associated with significant
changes in the tissue (6).
In a similar study conducted by Venegas et al
(18), the mean number of AgNORs
per cell in the tongue epithelium of healthy CF-1 mice was found to
be 2.1. Our values were slightly higher, with a mean of 2.44 for
mice in the 4-NQO group and 2.41 in the RS/4-NQO group.
Notably, although a higher number of AgNORs per cell
was expected in plaques of mice with cancer and stress, the results
demonstrated otherwise. This finding may be correlated with the
distribution adopted by the AgNORs, as there was a greater tendency
for the AgNORs to cluster and overlap, and after counting, one unit
of a group of AgNORs could not be individually identified.
The second parameter used in this study was the
pattern of AgNOR distribution, for which a classification was
selected due to its simplicity and easy application (8). According to this analysis, the
clustered distribution corresponded to 64.3% in the RS/4-NQO group.
In mice in the 4-NQO group there was a predilection for the
dispersed distribution pattern, observed in 58.8% of all specimens
in this group. However, in spite of this finding, and although
there was a slightly higher trend towards a grouped distribution in
the cancer group receiving stress treatment, no statistically
significant difference was noted when comparing the distribution
patterns between the two groups of mice.
Although the AgNOR technique is described by certain
authors as being simple, cost-effective and easy to perform
(12,13,19),
it should also be taken into account that this technique is
sensitive to various factors, including the thickness of
histological sections, the reaction temperature of the solutions,
the concentration of silver nitrate, incubation times and even the
use of glass that is not perfectly clean (9). Such factors may hinder the
identification of the AgNORs. Furthermore, the interpretations of
these data are less reliable if not supported by a computational
method, which is a limitation of the research protocol.
The findings, in our view, indicate that the AgNOR
procedure is not a technique sufficiently sensitive to measure the
biological functions, at least related to the methods of our
research.
The methodology used in this study demonstrates that
chronic restraint stress has no involvement in the severity of
lingual carcinomas of CF-1 mice, according to the parameters
analyzed, consistent with our previous report (3). However, of note is that more sensitive
markers were analyzed by immunohistochemistry and molecular biology
methods.
Acknowledgements
This study was supported by grant CONICYT-PBCT
Anillo ACT 112, Chile.
References
|
1
|
Saul A, Oberyszyn T, Daugherty C, Kusewitt
D, Jones S, Jewell S, et al: Chronic stress and susceptibility to
skin cancer. J Natl Cancer Inst. 97:1760–1767. 2005. View Article : Google Scholar : PubMed/NCBI
|
|
2
|
Thaker P, Han L, Kamat A, Arevalo J,
Takahashi R, Lu C, et al: Chronic stress promotes tumor growth and
angiogenesis in a mouse model of ovarian carcinoma. Nat Med.
12:939–944. 2006. View
Article : Google Scholar : PubMed/NCBI
|
|
3
|
Rivera C, Droguett D, Kemmerling U and
Venegas B: Chronic restraint stress in oral squamous cell
carcinoma. J Dent Res. 90:799–803. 2011. View Article : Google Scholar : PubMed/NCBI
|
|
4
|
Cano L, Álvarez G, Valencia W, Ramírez J
and Prada C: Análisis del marcador tisular AgNOR en leucoplasia y
carcinoma escamocelular oral. Medicina Oral. 7:17–25. 2002.
|
|
5
|
Kanitakis J, Hoyo E, Hermier C, Chouvet B
and Thivolet J: Nucleolar organizer region enumeration in
keratoacanthomas and squamous cell carcinomas of the skin. Cancer.
69:2937–2941. 1992. View Article : Google Scholar : PubMed/NCBI
|
|
6
|
Schwint A, Gomez E, Itoiz M and Cabrini R:
Nucleolar organizer regions as markers of incipient cellular
alterations in squamous epithelium. J Dent Res. 72:1233–1236. 1993.
View Article : Google Scholar : PubMed/NCBI
|
|
7
|
Korneyev I, Mamaev N, Kozlov V and
Rybakova M: Interphase argyrophilic nucleolar organizer regions and
nucleolar counts in transitional cell bladder tumors. Mol Pathol.
53:129–132. 2000. View Article : Google Scholar : PubMed/NCBI
|
|
8
|
Palomo-González M, Pérez-Requena J,
Rego-González M, López-Nieto M and Cañizares C: Evaluación de
regiones organizadoras nucleolares argirófilas (AgNORs) en
neoplasias foliculares tiroideas. Rev Esp Patol. 35:95–100.
2002.PubMed/NCBI
|
|
9
|
Pich A, Chiusa L and Navone R: Prognostic
relevance of cell proliferation in head and neck tumors. Ann Oncol.
15:1319–1329. 2004. View Article : Google Scholar : PubMed/NCBI
|
|
10
|
Cabrini R, Schwint A, Mendez A, Femopase
F, Lanfranchi H and Itoiz M: Morphometric study of nucleolar
organizer regions inchuman oral normal mucosa, papilloma and
squamous cell carcinoma. Oral Pathol Med. 21:275–279. 1992.
View Article : Google Scholar : PubMed/NCBI
|
|
11
|
Derenzini M: The AgNORs. Micron.
31:117–120. 2000. View Article : Google Scholar
|
|
12
|
Leyva Huerta E, Vega E, Ramìrez M and
Zárate A: Marcador de regiones de organizadores nucleolares en
lesiones epiteliales de cavidad bucal. Rev Esp Patol. 37:287–293.
2004.
|
|
13
|
López-Muñiz A, Triviño A, Hernández L and
Herrero A: Valoración de las regiones organizadoras nucleares en
lesiones melánicas benignas y malignas de piel. Rev Cubana Med.
40:17–23. 2001.PubMed/NCBI
|
|
14
|
Wozniak Z, Usson Y, Parazza F,
Champelovier P, Leroux D and Seigneurin D: Quantitative analysis of
three-dimensional distribution of AgNOR proteins during interphase
in leukemic cells. Cytometry. 24:14–26. 1996. View Article : Google Scholar : PubMed/NCBI
|
|
15
|
Ploton D, Menager M, Jeanneson P, Himber
G, Piegon F and Adent JJ: Improvement in the staining and in the
visualization of argyrophilic proteins of the nucleolar organizer
region at the optical level. Histochem J. 18:5–14. 1986. View Article : Google Scholar : PubMed/NCBI
|
|
16
|
Warnakulasuriya K and Johnson N: Nucleolar
organiser region (NOR) distribution as a diagnostic marker in oral
keratosis, dysplasia and squamous cell carcinoma. J Oral Pathol
Med. 22:77–81. 1993. View Article : Google Scholar : PubMed/NCBI
|
|
17
|
Lindner L: Improvements in the
silver-staining technique for nucleolar organizer regions (AgNOR).
J Histochem Cytochem. 41:439–445. 1993. View Article : Google Scholar : PubMed/NCBI
|
|
18
|
Venegas B, Vildósola M and Droguett D:
AgNORs expression in experimental carcinogenesis. J Dent Res.
89(Spec Iss B): pp. 1916(www.dentalresearch.orgurisimplewww.dentalresearch.org).
2010
|
|
19
|
Rocher E, Blanco A and Palaoro L: Utilidad
de la técnica de AgNOR en la interpretación de los derrames de
cavidades serosas. Rev Med Chil. 128:963–968. 2000.
|