Introduction
Ovarian cancer is the most lethal gynecological
malignancy and the fifth leading cause of cancer-related mortality
among females, as well as the ninth most common cancer among
females. Its incidence rate ranks third, following that of cervical
and uterine cancer. Due to the lack of early symptoms, >70% of
patients are diagnosed with advanced-stage disease, by which stage
the cancer has spread into adjacent tissues and organs beyond the
ovaries (1). Furthermore, 30–40% of
patients will succumb to ovarian cancer even in the early stage.
For these reasons, the mortality rate of ovarian cancer ranks first
among the various tumors affecting females. The five-year survival
rate of ovarian cancer is <20%, and has shown only modest
improvement over the past 40 years (2). The most advanced stage ovarian cancer
patients are sensitive to standard chemotherapies, but relapse
occurs in over 70% of patients, resulting in chemoresistant, fatal
disease (3). Therefore, a better
understanding of the molecular pathogenesis of ovarian cancer will
contribute to identifying novel biomarkers in the early stage,
developing new therapeutic targets, and possibly increasing the
five-year survival rate of ovarian cancer, thus saving the lives of
many patients (4).
Epigenetic aberrations are common in the development
and progression of cancer cells and are mediated by DNA
methyltransferases (DNMTs), histone deacetylases (HDACs) and
microRNA (miRNA). These modifications alter gene function and
malignant cellular transformation. DNA methylation is a reversible
reaction, catalyzed by three major DNMTs. One is DNMT1, which
preserves the methylation patterns throughout each cell division
(5,6). The others are DNMT3a and DNMT3b, which
transfer a methyl group to previously unmethylated genomic regions
(7). Methylation occurs in specific
genomic areas called CpG islands (8,9),
usually at the promoter region of a gene, and prevents gene
expression.
Histone modifications, particularly acetylation and
deacetylation, are the major driving force for epigenetic gene
regulation. They may regulate gene transcription by regulating
acetylation of DNA sequence-specific transcription factors.
Examples include p53, E2F and Sp3, where deacetylation has been
linked to reduced DNA binding or transcriptional activity (10–12).
To date, 18 members of human HDACs have been identified and
categorized into four classes, based on homology to yeast HDACs and
phylogenetic analysis (13,14). In general, class I HDACs (HDACs 1–3
and 8) are primarily located in the nucleus and are associated with
transcriptional repressors and cofactors.
Overexpression of DNMTs and HDACs has been reported
in various types of cancers including ovarian cancer (15–21).
Recently, a number of studies have demonstrated that DNMTs and
HDACs contribute to the epigenetic regulation in cancer cells. The
results of investigations by Zhou et al(22) and You et al(23) have suggested that HDACs may have the
capacity to upregulate the expression of DNMTs. Fuks et al
found that HDAC1 has the ability to bind DNMT1 and purify
methyltransferase activity from nuclear extracts. Moreover, DNMT1
has a transcriptional repression domain, and directly recruits
histone deacetylase activity (24).
Clinical trials have demonstrated that DNMT and HDAC inhibitors may
be effective reagents for cancer therapy (25,26).
Therefore it is important to investigate the expression pattern and
correlation of DNMTs and HDACs in cancer and to guide clinical
anticancer therapy.
In our study, we investigated the expression levels
of DNMTs and class I HDACs in ovarian cancer tissues with
quantitative real-time reverse transcription polymerase chain
reaction (qRT-PCR) and immunohistochemical staining, and analyzed
the correlation of DNMTs and HDACs. The relevant mechanisms of DNMT
and HDAC collaboration in ovarian cancer await further
clarification.
Materials and methods
Antibodies and chemical reagents
Histostain™-Plus Kit (Cat. No. SP/9001) was a
product of Zymed Laboratories Inc. (San Francisco, CA, USA) and
purchased from Sizhengbai Biotech Company Ltd. (Beijing, China).
Rabbit anti-human DNMT1 polyclonal antibody (Cat. No. ab19905) was
purchased from Abcam plc. (Cambridge, UK). Rabbit anti-human DNMT3b
polyclonal antibody (Q-25, Cat. No. sc-130740) was bought from
Santa Cruz Biotechnology (Santa Cruz, CA, USA). TRIzol™ reagent was
purchased from Life Technologies Co. (Shanghai, China).
SuperScript™ one-step RT-PCR kit was bought from Toyobo (Shanghai)
Bio Co., Ltd. (Shanghai, China). SYBR-Green mix reagent was a
product of Takara Bio (Dalian) Co., Ltd. (Dalian, China).
Patients and tissue samples
A total of 22 freshly resected ovarian cancer tissue
samples and eight normal ovarian tissue samples (from
ovariectomized patients suffering from other gynecological
diseases) were collected at the Affiliated Hospital of Jiangsu
University, Zhenjiang, China, in accordance with institutional
guidelines and immediately frozen in liquid nitrogen for further
analysis. The study was approved by Jiangsu University’s ethical
review committee and informed consent for the use of tissues was
obtained for all individuals. The histopathological diagnosis was
based on WHO criteria; the samples were assigned a grade based on
Gynecologic Oncology Group criteria (27) and staged according to the
International Federation of Gynecology and Obstetrics system (FIGO)
(28).
The mean ages of normal and cancer patients were 54
years (range, 36 to 70 years) and 59 years (range, 37 to 76 years),
respectively. Stage breakdown was: 2 (9%) in stage I, 5 (22.7%) in
stage II, 9 (40.9%) in stage III, and 6 (27.3%) in stage IV. The
tumor histotype was serous carcinoma in 19 patients (86.4%) and
mucinous carcinoma in 3 (13.6%).
Total RNA extraction and qRT-PCR
RNA was extracted from frozen tissue samples using
the TRIzol reagent (Life Technologies) according to the
manufacturer’s instructions. The dissolved RNA was stored at −70°C
before use. RNA quality was assessed with a NanoDrop1000
spectrophotometer (Eppendorf; AG, Hamburg, Germany). RT-PCR was
carried out using a SuperScript™ one-step RT-PCR kit (Toyobo)
according to the manufacturer’s instructions. cDNA was synthesized
by utilizing an oligo (dT) primer from 1 μg total RNA at
42°C for 20 min, followed by inactivation of the reverse
transcriptase at 94°C for 5 min. The qRT-PCR was performed in a
final volume of 20 μl containing 10 μl SYBR-Green mix
reagent (Takara), sense and antisense primers (0.3 μl, 10
mM), and cDNA (1 μl) and DNA-free water (8.4 μl).
Primer sequences are listed in Table
I. Each DNMT and HDAC value was normalized to the expression of
β-actin. Values are presented as the mean ± standard deviation (SD)
of triplicate measurements.
 | Table I.Characteristics of primers used for
qRT-PCR. |
Table I.
Characteristics of primers used for
qRT-PCR.
| Primer | Sequence
(5′-3′) | Cycles | Annealing temp
(°C) |
|---|
| β-actin (genebank
no. NM-001101) | Sense:
CACGAAACTACCTTCAACTCC | | |
| Antisense:
CATACTCCTGCTTGCTGATC | 25 | 57 |
| HDAC1 (genebank no.
NM-004964) | Sense:
AACCTGCCTATGCTGATGCT | | |
| Antisense:
CAGGCAATTCGTTTATCAGA | 30 | 57 |
| HDAC2 (genebank no.
NM-001527) | Sense:
GGGAATACTTTCCTGGCACA | | |
| Antisense:
ACGGATTGTGTAGCCACCTC | 35 | 60 |
| HDAC3 (genebank no.
NM-003883) | Sense:
TGGCTTCTGCTATGTCAACG | | |
| Antisense:
GCACGTGGGTTGGTAGAAGT | 35 | 60 |
| HDAC8 (genebank no.
NM-001166418) | Sense:
TTTTCCCAGGAACAGGTGA | | |
| Antisense:
AGCTCCCAGCTGTAAGACC | 35 | 57 |
| DNMT1 (genebank no.
NM-001130823) | Sense:
CTACCAGGAGAAGGACAGG | | |
| Antisense:
CTCACAGACGCCACATCG | 30 | 62.5 |
| DNMT3a (genebank
no. NM-153759) | Sense:
TATGAACAGGCCGTTGGCATC | | |
| Antisense:
AAGAGGTGGCGGATGACTGG | 35 | 63.5 |
| DNMT3b (genebank
no. NM-001207056) | Sense:
TTGGGCATAAAGGTAGGAA | | |
| Antisense:
CATACTCCTGCTTGCTGATC | 35 | 57 |
Immunohistochemical staining
Formalin-fixed, serial paraffin-embedded ovarian
cancer tissues were immunostained by the
streptavidin-biotin-peroxidase complex (ABC) method, using a
Histostain-Plus Kit (Zymed Laboratories Inc.). Briefly,
3-μm-thick sections were placed on
3-aminopropyltriethoxysilane (APES)-coated slides, deparaffinized
and rehydrated routinely. To unmask the antigen, sections were
boiled in 0.01 M citrate buffer (pH 6.0) in a microwave oven for 20
min. For quenching of endogenous peroxidase activity, sections were
treated with 0.3% hydrogen peroxide for 10 min at room temperature.
After rinsing the sections in phosphate-buffered saline (PBS, pH
7.4), the nonspecific binding site was blocked with 10% normal goat
serum for 20 min at room temperature. The blocking serum was
discarded and then the primary antibodies were added directly.
Rabbit anti-human DNMT1 polyclonal antibody (Abcam) was diluted to
1:100, rabbit anti-human DNMT3b polyclonal antibody (Santa Cruz
Biotechnology) 1:50 in PBS, respectively. The sections were
incubated at 4°C overnight. After rinsing in PBS, biotinylated goat
anti-rabbit immunoglobulin G (IgG) (Zymed Laboratories Inc.) was
added, and the sections were incubated for 30 min at room
temperature. After washing in PBS, peroxidase conjugated
streptavidin was added and incubated for 30 min at room
temperature. While rinsing in PBS, the peroxidase reaction was
performed using 0.02% 3, 3′-diaminobenzidine tetrahydrochloride
(DAB) containing PBS and 0.15% hydrogen peroxidase for 3–15 min at
room temperature. Finally, tissues were stained with Mayer’s
hematoxylin, then dehydrated and mounted. Staining without primary
antibody was used as a negative control.
Statistical analysis
The data are expressed as the mean ± SD. Statistical
analysis was performed with the Mann-Whitney U test between the
normal group and tumor group, and we also used this statistical
method in comparison of stage III/IV and stage I/II cases.
Spearman’s rank correlation test was used to study correlations
between different genes.
Results
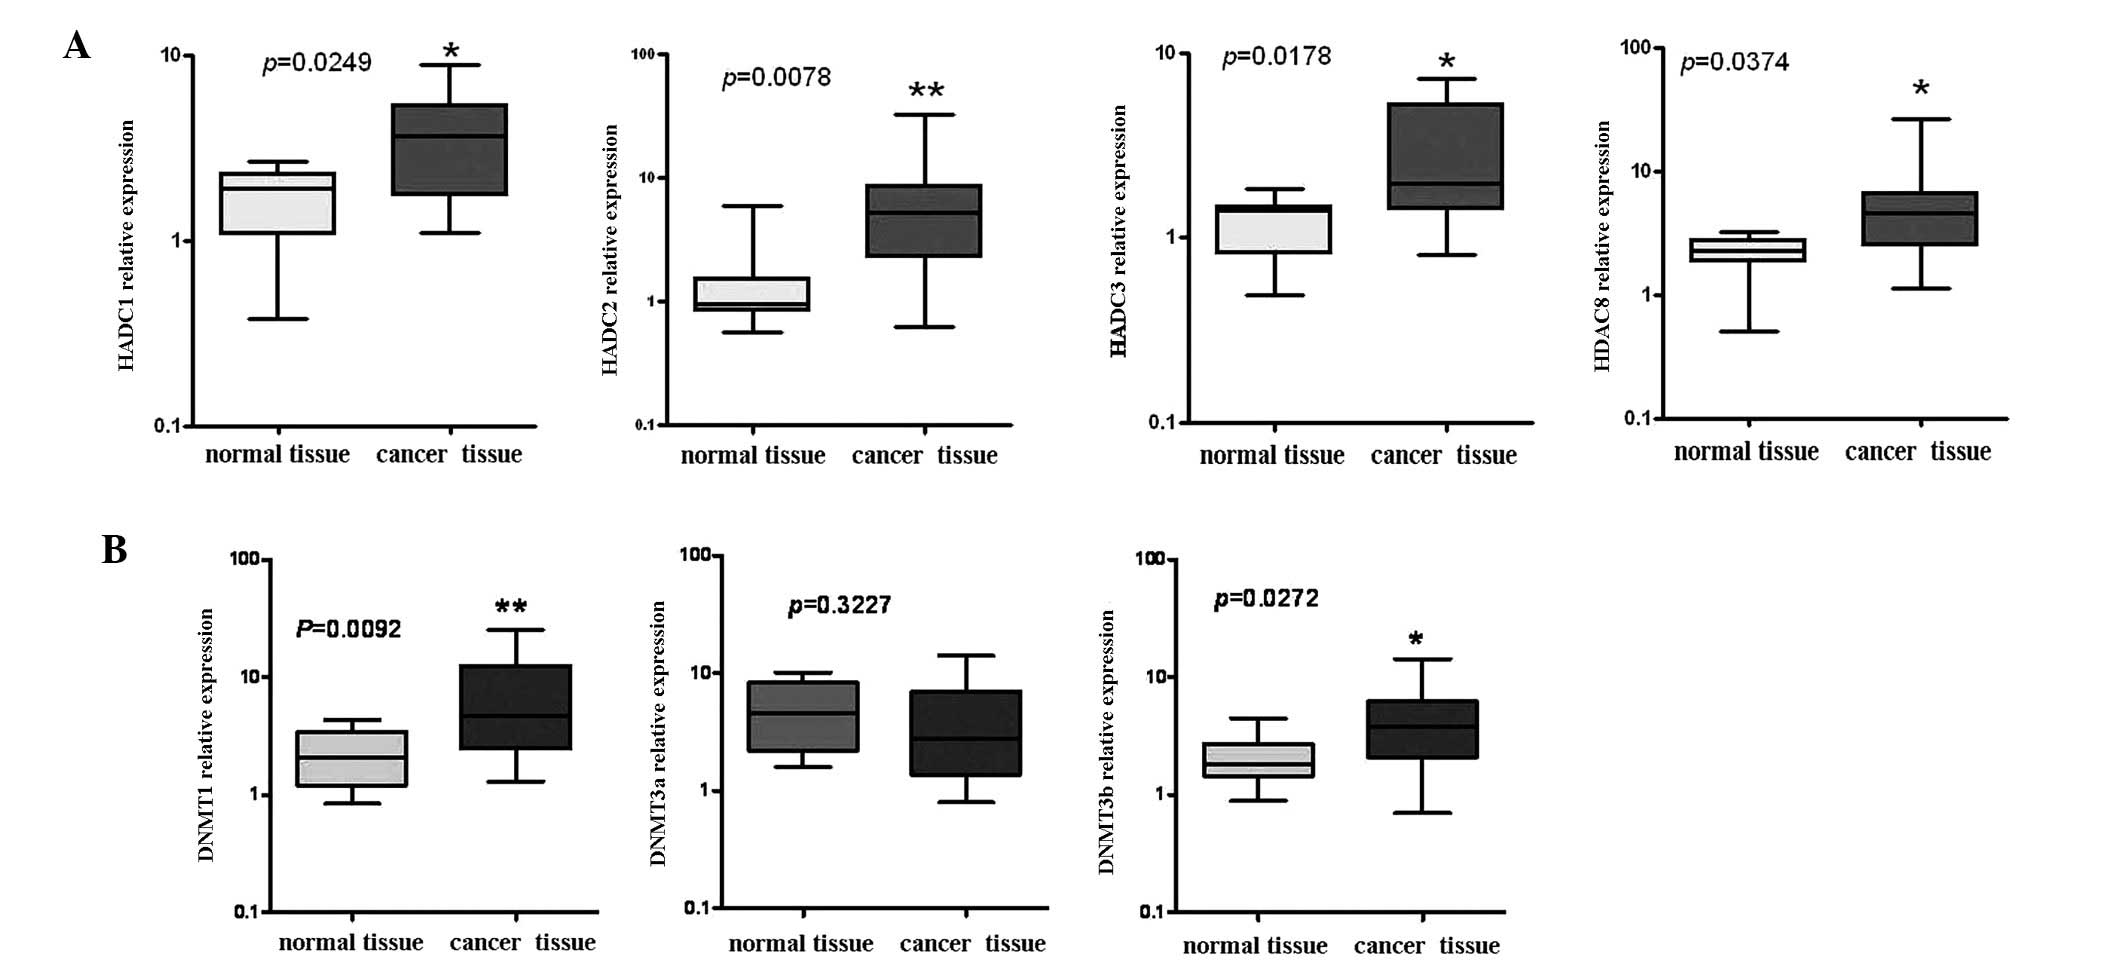
mRNA expression of class I HDACs, DNMT1
and DNMT3b is upregulated in ovarian cancers
The expression levels of the class I HDACs (HDAC 1,
2, 3 and 8), DNMT1, DNMT3a and DNMT3b transcripts were determined
by qRT-PCR analysis and shown in Fig.
1. The relative expressions of HDAC 1, 2, 3 and 8 mRNA in
ovarian cancers (n=22) were significantly higher than those in
normal tissues (n=8), particularly for HDAC2 (P<0.01; Fig. 1A). Similarly, the relative
expressions of DNMT1 and DNMT3b mRNA in ovarian cancers (n=22) were
significantly higher than those in normal tissues (n=8),
particularly for DNMT1 (P<0.01; Fig.
1B). The relative expression of DNMT3a was not different
between the two groups (P=0.03227; Fig.
1B middle panel).
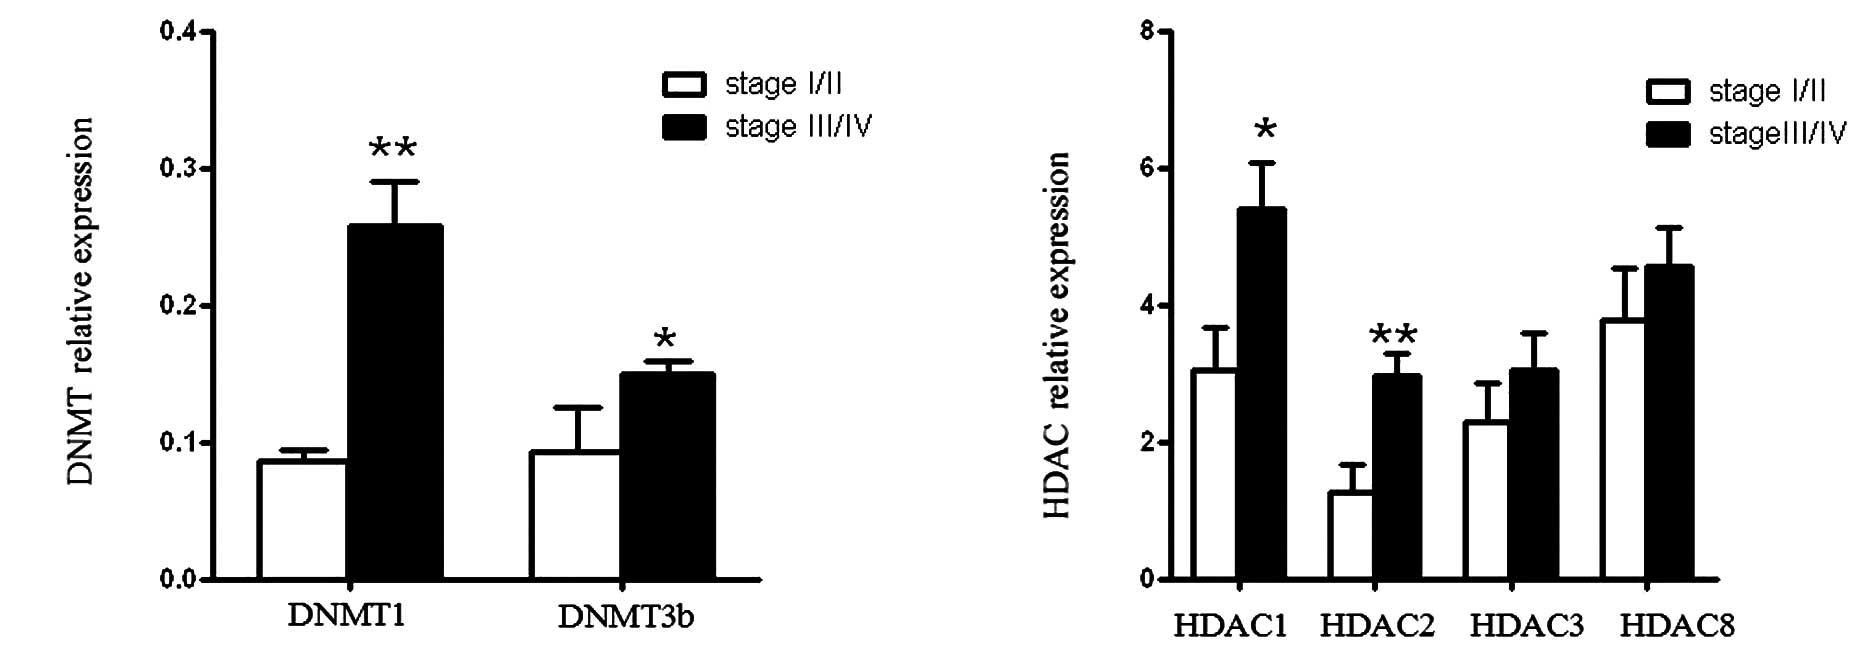
Gene expression levels of DNMTs and HDACs
were correlated with the FIGO stage
In accordance with FIGO stage, we divided the
patients into two groups; stage I/II (n=7) and stage III/IV (n=15);
and evaluated the mRNA levels at the different stages. Results
showed that DNMT1 and DNMT3b expression was significantly increased
in stage III/IV compared with stage I/II, particularly for DNMT1
(P<0.01; Fig. 2A). The relative
expression of HDAC1 and HDAC2 demonstrated a similar result
(Fig. 2B). In contrast, the levels
of HDAC3 and HDAC8 were not different between the two groups
(Fig. 2B).
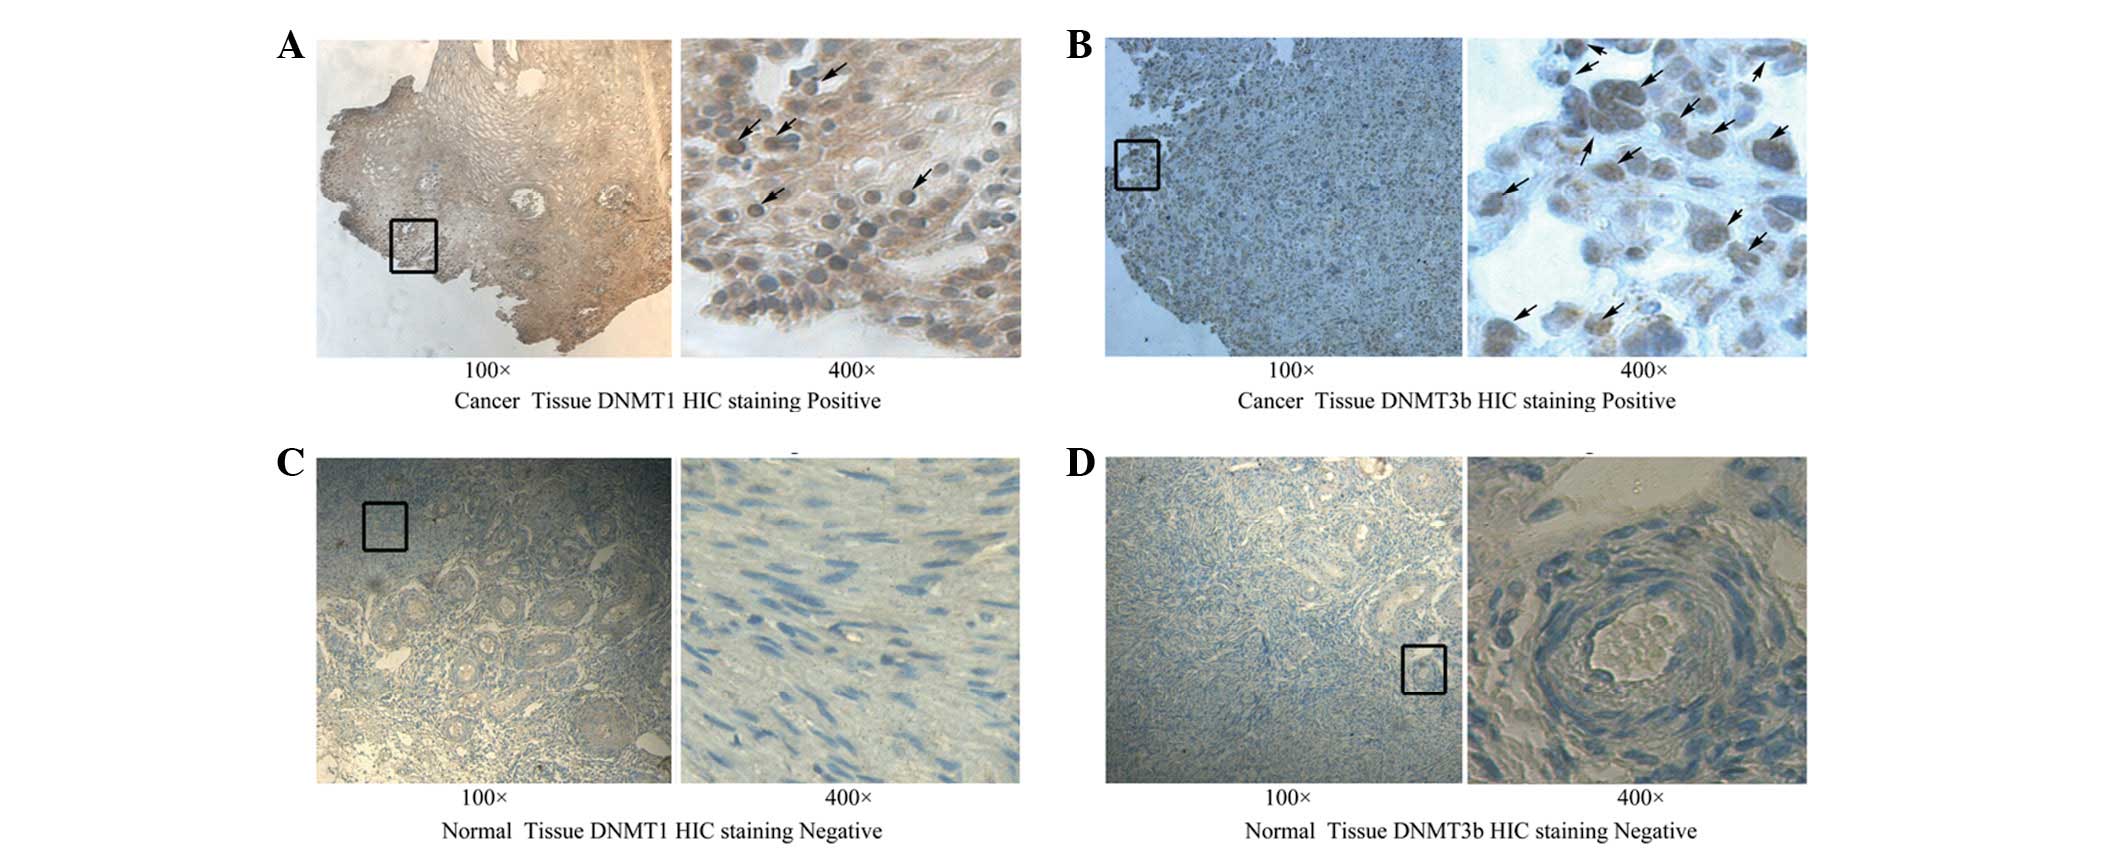
Protein expression levels of DNMT1 and
DNMT3b were increased in ovarian cancers
The expression of DNMT1 and DNMT3b was assessed
in situ on paraffin sections of normal ovarian tissues (n=8)
and malignant ovarian tumors (n=22). Fig. 3 shows the representative
immunohistochemistry results for DNMT1 and DNMT3b expression in
tissues. The intensity of staining for DNMT1 and DNMT3b in
malignant ovarian tumors was significantly greater than that in
normal tissues (Fig. 3).
Correlation among the mRNA expression of
class I HDACs, DNMT1 and DNMT3b
We examined the correlation among the expression of
class I HDACs, DNMT1 and DNMT3b. The expression of HDAC2 showed a
significantly positive correlation with HDAC1 (ϱ= 0.4958,
P=0.0309), HDAC3 (ϱ=0.4719, P=0.0413) and HDAC8 (ϱ=0.6123,
P=0.0027). Similarly, there was a positive correlation between
DNMT1 and DNMT3b (ϱ=0.4736, P=0.026). Unexpectedly, there was no
correlation with HDAC1, HDAC3 and HDAC8. Notably, DNMT3b had a
positive correlation with HDAC1 (ϱ=0.5158, P=0.0238) and HDAC2
(ϱ=0.4857, P=0.035; Table II). In
addition, in most ovarian cancer patients the expression of the
DNMTs were found to be upregulated, the expressions of HDACs are
also upregulated; while the expressions of the HDACs are increased,
but the expression of DNMTs are not as increased as expected
(Table III).
| Table II.Spearman’s correlations between the
mRNA of class I HDACs, DNMT1 and DNMT3b. |
Table II.
Spearman’s correlations between the
mRNA of class I HDACs, DNMT1 and DNMT3b.
| Gene | Correlation
analysis | HDAC1 | HDAC2 | HDAC3 | HDAC8 | DNMT1 | DNMT3a | DNMT3b |
|---|
| HDAC1 | Correlation
coefficient | 1.000 | 0.4958a | 0.3361 | −0.2027 | 0.2214 | 0.0542 | 0.5158a |
| P-value | | 0.0309 | 0.0797 | 0.4052 | 0.3622 | 0.8105 | 0.0238 |
| HDAC2 | Correlation
coefficient | | 1.000 | 0.4719a | 0.6123b | −0.2784 | 0.4490 | 0.4587a |
| P-value | | | 0.0413 | 0.0027 | 0.2484 | 0.0361a | 0.035 |
| HDAC3 | Correlation
coefficient | | | 1.000 | −0.1659 | −0.224 | 0.0616 | −0.2767 |
| P-value | | | | 0.2487 | 0.3566 | 0.7854 | 0.2515 |
| HDAC8 | Correlation
coefficient | | | | 1.000 | 0.2082 | 0.0311 | −0.2047 |
| P-value | | | | | 0.3924 | 0.8908 | 0.4007 |
| DNMT1 | Correlation
coefficient | | | | | 1.000 | 0.0734 | 0.4736a |
| P-value | | | | | | 0.7454 | 0.026 |
| DNMT3a | Correlation
coefficient | | | | | | 1.000 | 0.0429 |
| P-value | | | | | | | 0.8496 |
| DNMT3b | Correlation
coefficient | | | | | | | 1.000 |
| P-value | | | | | | | |
| Table III.Relative expression of class I HDACs,
DNMT1 and DNMT3b in 22 samples of ovarian cancer. |
Table III.
Relative expression of class I HDACs,
DNMT1 and DNMT3b in 22 samples of ovarian cancer.
| | The Ct values for
ovarian cancer tissues/the Ct values for normal control tissues
|
|---|
| Sample | Stage | DNMT 1 | DNMT 3a | DNMT 3b | HDAC1 | HDAC2 | HDAC3 | HDAC8 |
|---|
| 1 | I | 0.75 | 0.69 | 1.59a | 1.61b | 0.37 | 0.77 | 1.42 |
| 2 | I | 1.27 | 1.18 | 1.60a | 1.27 | 1.22 | 1.95b | 2.09b |
| 3 | II | 0.62 | 0.87 | 1.02 | 1.57b | 0.55 | 2.82b | 1.91b |
| 4 | II | 0.89 | 0.73 | 0.89 | 0.64 | 1.80b | 0.65 | 2.03b |
| 5 | II | 1.72a | 0.71 | 1.38 | 0.67 | 1.36 | 1.36 | 0.75 |
| 6 | II | 1.61a | 1.13 | 1.87a | 2.34b | 2.04b | 4.32d | 8.02f |
| 7 | II | 1.29 | 1.42 | 1.42 | 0.89 | 0.90 | 1.58b | 1.12 |
| 8 | III | 1.43 | 0.98 | 0.93 | 1.80 | 1.60 | 0.77 | 1.36 |
| 9 | III | 1.63a | 0.63 | 4.64c | 4.99d | 0.82 | 0.82 | 3.12d |
| 10 | III | 1.81a | 0.70 | 1.34 | 0.97 | 1.02 | 1.59b | 2.78b |
| 11 | III | 3.37c | 0.70 | 3.58c | 5.33d | 2.05b | 1.14 | 2.41b |
| 12 | III | 14.6e | 1.22 | 8.62e | 5.05d | 8.57f | 2.28b | 1.74b |
| 13 | III | 3.10c | 0.68 | 1.72a | 2.78b | 2.55b | 4.76d | 3.08d |
| 14 | III | 1.01 | 0.81 | 5.14c | 0.94 | 1.69b | 3.26d | 0.73 |
| 15 | III | 1.68a | 1.27 | 18.12e | 3.65d | 13.21f | 5.60d | 3.11d |
| 16 | III | 3.58c | 1.34 | 1.32 | 2.50b | 2.10b | 1.46 | 1.81b |
| 17 | III | 2.24a | 1.14 | 3.68c | 1.40 | 3.70d | 2.03b | 2.17b |
| 18 | IV | 3.11c | 2.16a | 3.64c | 3.05d | 5.85d | 1.72b | 2.49b |
| 19 | IV | 1.70a | 2.18a | 1.68a | 1.84b | 5.48d | 0.65 | 10.8f |
| 20 | IV | 1.55a | 0.76 | 0.95 | 0.64 | 1.55b | 1.06 | 2.45b |
| 21 | IV | 4.61c | 0.57 | 4.40c | 2.06b | 2.60b | 4.26d | 2.68b |
| 22 | IV | 2.50a | 1.32 | 3.12c | 1.94b | 3.40d | 0.55 | 4.60d |
Discussion
Previous studies have confirmed the epigenetic
regulation of the development and differentiation of the body.
Epigenetic abnormalities often have a close correlation with the
occurrence of a number of diseases, including cancer, alcoholic
liver diseases, degenerative diseases of the nervous system, mental
diseases, autoimmune diseases and cardiovascular diseases (29–31).
It has been found that most cancers have abnormal DNA methylation,
DNA deacetylation and miRNA expression, while the expression of
DNMTs and HDACs is generally increased (32,33).
In mammals, DNA methylation and deacetylation are mostly mediated
by DNMT1, DNMT3a, DNMT3b and class I HDAC regulation. It has been
indicated that HDACs and DNMTs have important regulatory roles in
human breast and cervix cancer cells. Furthermore, the inhibition
of HDACs downregulates the expression of DNMT1 (22,23).
Ovarian cancer is one of the common malignant tumors in female
reproductive organs and is associated with high expression of DNMTs
and of HDACs (4,34,35),
but there are no studies concerning the correlation between DNMTs
and HDACs in ovarian cancer.
In this study, we describe a high-level expression
of class I HDAC isoforms and two functional DNMTs in ovarian cancer
which catalyze cytosine methylation, and may therefore be of
importance in dysregulating gene expression, in particular that of
tumor suppressor genes. We used qRT-PCR assays to study the mRNA
expression of DNMTs and class I HDACs in a series of 22 ovarian
cancers. Overexpression of HDACs results in repression of important
growth suppressive genes in numerous cancer cells, and is an
important mechanism to promote cancer cell proliferation (36). Weichert et al revealed that a
high proportion of ovarian carcinomas demonstrated class I HDAC
protein expression using a tissue microarray, and the expression of
class I HDACs indicates poor prognosis (37). High expression levels for class I
HDACs were assessed by immunohistochemistry (38,39),
which is in line with our results. Compared with normal ovarian
tissue, our results showed that HDAC2 was highly prominent
(P<0.01). At the same time, the expression of HDAC2 was
significantly higher at stage III/IV than at stage I/II
(P<0.01). Overexpression of HDAC2 was reportedly correlated with
a more advanced stage in gastric carcinoma and it was also a
prognostic indicator for a poor outcome in cases of prostate
carcinoma (16,21). Although these studies indicated that
the increasing expression of HDAC2 was associated with tumor
progression, our study is the first to demonstrate a clear
correlation between HDAC2 expression and advanced stage ovarian
cancer (Table II). On the other
hand, DNA hypermethylation of tumor suppressor genes in the
promoter region was frequently observed in hepatocellular
carcinomas (40), DNMTs are
possibly responsible for DNA hypermethylation of these genes since
their expression levels are known to increase during early
tumorigenesis (17). We found that
the mRNA and protein expression levels of DNMT1 and 3b were high in
ovarian cancers compared with normal tissues, while for DNMT3a
there was no difference between them. The result was similar to
those observed in breast cancer (41). DNMT1 was highly prominent
(P<0.01) among these DNMTs. Furthermore, the expression of DNMT1
was significantly higher at stage III/IV than at stage I/II
(P<0.01), supporting a role for DNMT1 in tumorigenesis (42). The mRNA expression of DNMT1, DNMT3b,
HDAC1 and HDAC2 were particularly prominent in high-grade tumors in
ovarian cancers, which indicated that they may be the biomarkers of
tumor aggressiveness and proliferation, as their high expression is
closely associated with ovarian carcinoma progression. In our
results, the expression of HDAC2 was correlated with HDCA1, HDAC3
and HDAC8, and the expression of DNMT1 was correlated with DNMT3b.
A notable aspect of our results is that the level of DNMT3b was
correlated with HDAC1 and HDAC2 in ovarian cancer, which
demonstrated that the two epigenetic events cooperated in
controlling ovarian cancer progression (Table II). There have been reports that
methylation of histone H3 lysine 9 may be triggered by DNA
methylation (43), and DNMTs have
also been shown to interact with HDACs, histone methyltransferases
(HMTs) and methylcytosine-binding proteins in a complex network
(22,23,44).
Our results also imply that the expression of the DNMTs are
regulated by HDACs (Table III);
however, these findings need to be demonstrated by further
research. This finding was in accordance with the research results
of Zhou et al(22) and You
et al(23).
In summary, our studies demonstrate that the mRNA
expression of DNMT1, DNMT3b and class I HDACs was increased in
ovarian cancers. HDAC1, HDAC2, DNMT1 and DNMT3b expression
increased with stage. Furthermore, HDAC1, HDAC2 and DNMT3b
cooperated in controlling ovarian cancer progression and the HDACs
may upregulate the expression of DNMTs. Detecting the expressions
of the DNMTs and HDACs may aid the diagnosis and guide the clinical
use of the inhibitors of DNMTs and HDACs to treat ovarian cancer.
Further exploration is warranted to gain more information.
Acknowledgements
This study was supported by the
following grants: The National Natural Science Foundation of China
(Grant nos. 30671984, 8127302, 31200676 and 81172834), The Natural
Science Foundation of Jiangsu Province of China (Grant no.
BK2008231) and Sci-tech Innovation Team of Jiangsu University
(Grant no. 2008-018-02).
References
|
1.
|
Barnholtz-Sloan JS, Schwartz AG, Qureshi
F, Jacques S, Malone J and Munkarah AR: Ovarian cancer: changes in
patterns at diagnosis and relative survival over the last three
decades. Am J Obstet Gynecol. 189:1120–1127. 2003. View Article : Google Scholar : PubMed/NCBI
|
|
2.
|
Jemal A, Siegel R, Ward E, et al: Cancer
statistics, 2008. CA Cancer J Clin. 58:71–96. 2008. View Article : Google Scholar
|
|
3.
|
Liu CM: Cancer of the ovary. N Engl J Med.
352:1268–1269; author reply 1268–1269. 2005. View Article : Google Scholar : PubMed/NCBI
|
|
4.
|
Kwon MJ and Shin YK: Epigenetic regulation
of cancer-associated genes in ovarian cancer. Int J Mol Sci.
12:983–1008. 2011. View Article : Google Scholar : PubMed/NCBI
|
|
5.
|
Li E, Bestor TH and Jaenisch R: Targeted
mutation of the DNA methyltransferase gene results in embryonic
lethality. Cell. 69:915–926. 1992. View Article : Google Scholar : PubMed/NCBI
|
|
6.
|
Li E, Beard C and Jaenisch R: Role for DNA
methylation in genomic imprinting. Nature. 366:362–365. 1993.
View Article : Google Scholar : PubMed/NCBI
|
|
7.
|
Okano M, Bell DW, Haber DA and Li E: DNA
methyltransferases Dnmt3a and Dnmt3b are essential for de novo
methylation and mammalian development. Cell. 99:247–257. 1999.
View Article : Google Scholar : PubMed/NCBI
|
|
8.
|
Weber M, Hellmann I, Stadler MB, et al:
Distribution, silencing potential and evolutionary impact of
promoter DNA methylation in the human genome. Nat Genet.
39:457–466. 2007. View
Article : Google Scholar : PubMed/NCBI
|
|
9.
|
Herman JG and Baylin SB: Gene silencing in
cancer in association with promoter hypermethylation. N Engl J Med.
349:2042–2054. 2003. View Article : Google Scholar : PubMed/NCBI
|
|
10.
|
Gu W and Roeder RG: Activation of p53
sequence-specific DNA binding by acetylation of the p53 C-terminal
domain. Cell. 90:595–606. 1997. View Article : Google Scholar : PubMed/NCBI
|
|
11.
|
Marzio G, Wagener C, Gutierrez MI,
Cartwright P, Helin K and Giacca M: E2F family members are
differentially regulated by reversible acetylation. J Biol Chem.
275:10887–10892. 2000. View Article : Google Scholar : PubMed/NCBI
|
|
12.
|
Ammanamanchi S, Freeman JW and Brattain
MG: Acetylated sp3 is a transcriptional activator. J Biol Chem.
278:35775–35780. 2003. View Article : Google Scholar : PubMed/NCBI
|
|
13.
|
de Ruijter AJ, van Gennip AH, Caron HN,
Kemp S and van Kuilenburg AB: Histone deacetylases (HDACs):
characterization of the classical HDAC family. Biochem J. 370(Pt
3): 737–749. 2003.PubMed/NCBI
|
|
14.
|
Gregoretti IV, Lee YM and Goodson HV:
Molecular evolution of the histone deacetylase family: functional
implications of phylogenetic analysis. J Mol Biol. 338:17–31. 2004.
View Article : Google Scholar : PubMed/NCBI
|
|
15.
|
Mizuno S, Chijiwa T, Okamura T, et al:
Expression of DNA methyltransferases DNMT1, 3A, and 3B in normal
hematopoiesis and in acute and chronic myelogenous leukemia. Blood.
97:1172–1179. 2001. View Article : Google Scholar : PubMed/NCBI
|
|
16.
|
Yang B, Guo M, Herman JG and Clark DP:
Aberrant promoter methylation profiles of tumor suppressor genes in
hepatocellular carcinoma. Am J Pathol. 163:1101–1107. 2003.
View Article : Google Scholar : PubMed/NCBI
|
|
17.
|
Girault I, Tozlu S, Lidereau R and Bièche
I: Expression analysis of DNA methyltransferases 1, 3A, and 3B in
sporadic breast carcinomas. Clin Cancer Res. 9:4415–4422.
2003.PubMed/NCBI
|
|
18.
|
Ahluwalia A, Hurteau JA, Bigsby RM and
Nephew KP: DNA methylation in ovarian cancer. II. Expression of DNA
methyltransferases in ovarian cancer cell lines and normal ovarian
epithelial cells. Gynecol Oncol. 82:299–304. 2001.PubMed/NCBI
|
|
19.
|
Omisanjo OA, Biermann K, Hartmann S, et
al: DNMT1 and HDAC1 gene expression in impaired spermatogenesis and
testicular cancer. Histochem Cell Biol. 127:175–181. 2007.
View Article : Google Scholar : PubMed/NCBI
|
|
20.
|
Weichert W: HDAC expression and clinical
prognosis in human malignancies. Cancer Lett. 280:168–176. 2009.
View Article : Google Scholar : PubMed/NCBI
|
|
21.
|
Weichert W, Röske A, Gekeler V, et al:
Histone deacetylases 1, 2 and 3 are highly expressed in prostate
cancer and HDAC2 expression is associated with shorter PSA relapse
time after radical prostatectomy. Br J Cancer. 98:604–610. 2008.
View Article : Google Scholar : PubMed/NCBI
|
|
22.
|
Zhou Q, Agoston AT, Atadja P, Nelson WG
and Davidson NE: Inhibition of histone deacetylases promotes
ubiquitin-dependent proteasomal degradation of DNA
methyltransferase 1 in human breast cancer cells. Mol Cancer Res.
6:873–883. 2008. View Article : Google Scholar : PubMed/NCBI
|
|
23.
|
You JS, Kang JK, Lee EK, et al: Histone
deacetylase inhibitor apicidin downregulates DNA methyltransferase
1 expression and induces repressive histone modifications via
recruitment of corepressor complex to promoter region in human
cervix cancer cells. Oncogene. 27:1376–1386. 2008. View Article : Google Scholar
|
|
24.
|
Fuks F, Burgers WA, Brehm A, Hughes-Davies
L and Kouzarides T: DNA methyltransferase Dnmt1 associates with
histone deacetylase activity. Nat Genet. 24:88–91. 2000. View Article : Google Scholar : PubMed/NCBI
|
|
25.
|
Boumber Y and Issa JP: Epigenetics in
cancer: what’s the future? Oncology (Williston Park). 25:220–226.
228:2011.
|
|
26.
|
Marks PA: Epigenetic targeted anti-cancer
drugs: an unfolding story. Oncology (Williston Park).
25:2312352011.PubMed/NCBI
|
|
27.
|
Benda JA and Zaino R: GOG Pathology
Manual. Buffalo, NY: Gynecologic Oncology Group; 1994
|
|
28.
|
Staging announcement: FIGO cancer
committee. Gynecol Oncol. 25:41986.
|
|
29.
|
Tsankova N, Renthal W, Kumar A and Nestler
EJ: Epigenetic regulation in psychiatric disorders. Nat Rev
Neurosci. 8:355–367. 2007. View
Article : Google Scholar
|
|
30.
|
Halusková J: Epigenetic studies in human
diseases. Folia Biol (Praha). 56:83–96. 2010.
|
|
31.
|
Mandrekar P: Epigenetic regulation in
alcoholic liver disease. World J Gastroenterol. 17:2456–2464. 2011.
View Article : Google Scholar : PubMed/NCBI
|
|
32.
|
Brait M and Sidransky D: Cancer
epigenetics: above and beyond. Toxicol Mech Methods. 21:275–288.
2011. View Article : Google Scholar : PubMed/NCBI
|
|
33.
|
Ferguson LR, Tatham AL, Lin Z and Denny
WA: Epigenetic regulation of gene expression as an anticancer drug
target. Curr Cancer Drug Targets. 11:199–212. 2011. View Article : Google Scholar : PubMed/NCBI
|
|
34.
|
Chen H, Hardy TM and Tollefsbol TO:
Epigenomics of ovarian cancer and its chemoprevention. Front Genet.
2:672011. View Article : Google Scholar : PubMed/NCBI
|
|
35.
|
Maldonado L and Hoque MO: Epigenomics and
ovarian carcinoma. Biomark Med. 4:543–570. 2010. View Article : Google Scholar : PubMed/NCBI
|
|
36.
|
Abbas A and Gupta S: The role of histone
deacetylases in prostate cancer. Epigenetics. 3:300–309. 2008.
View Article : Google Scholar : PubMed/NCBI
|
|
37.
|
Weichert W, Denkert C, Noske A, et al:
Expression of class I histone deacetylases indicates poor prognosis
in endometrioid subtypes of ovarian and endometrial carcinomas.
Neoplasia. 10:1021–1027. 2008.PubMed/NCBI
|
|
38.
|
Hayashi A, Horiuchi A, Kikuchi N, et al:
Type-specific roles of histone deacetylase (HDAC) overexpression in
ovarian carcinoma: HDAC1 enhances cell proliferation and HDAC3
stimulates cell migration with downregulation of E-cadherin. Int J
Cancer. 127:1332–1346. 2010. View Article : Google Scholar : PubMed/NCBI
|
|
39.
|
Song J, Noh JH, Lee JH, et al: Increased
expression of histone deacetylase 2 is found in human gastric
cancer. APMIS. 113:264–268. 2005. View Article : Google Scholar : PubMed/NCBI
|
|
40.
|
Sun L, Hui AM, Kanai Y, Sakamoto M and
Hirohashi S: Increased DNA methyltransferase expression is
associated with an early stage of human hepatocarcinogenesis. Jpn J
Cancer Res. 88:1165–1170. 1997. View Article : Google Scholar : PubMed/NCBI
|
|
41.
|
Braconi C, Huang N and Patel T:
MicroRNA-dependent regulation of DNA methyltransferase-1 and tumor
suppressor gene expression by interleukin-6 in human malignant
cholangiocytes. Hepatology. 51:881–890. 2010.PubMed/NCBI
|
|
42.
|
Wang L, Zou X, Berger AD, et al: Increased
expression of histone deacetylaces (HDACs) and inhibition of
prostate cancer growth and invasion by HDAC inhibitor SAHA. Am J
Transl Res. 1:62–71. 2009.PubMed/NCBI
|
|
43.
|
Tariq M, Saze H, Probst AV, Lichota J,
Habu Y and Paszkowski J: Erasure of CpG methylation in Arabidopsis
alters patterns of histone H3 methylation in heterochromatin. Proc
Natl Acad Sci USA. 100:8823–8827. 2003. View Article : Google Scholar : PubMed/NCBI
|
|
44.
|
Fuks F, Hurd PJ, Wolf D, Nan X, Bird AP
and Kouzarides T: The methyl-CpG-binding protein MeCP2 links DNA
methylation to histone methylation. J Biol Chem. 278:4035–4040.
2003. View Article : Google Scholar : PubMed/NCBI
|