Introduction
Gastric cancer remains a health-threatening disease.
Its incidence ranks fourth among all cancers, with up to 80 new
cases per 100,000 people every year in Asian countries such as
Japan, South Korea, North Korea and China. Gastric cancer is the
second most frequent cause of cancer-related mortality following
lung cancer, and its mortality rate has reached 85% (1). Currently, surgery is the most common
treatment for gastric cancer; however, controversy remains
regarding the preferred method of lymph node clearance as neither
D1 lymphadenectomy proposed by Western researchers nor D2
lymphadenectomy proposed by Japanese researchers can be achieved
with high specificity (2). The
tracking and imaging of gastric tumor cells hinders the development
of treatments for gastric cancer.
In tumor imaging, the ideal method should be
sensitive, accurate, rapid, noninvasive, nonradioactive and
potentially useful in a laparoscopic setting. Previous sentinel
lymph node (SLN) mapping has usually involved preoperative
injection of a radioactive colloid tracer such as 99mTc sulfur
colloid followed by an intraoperative injection of a visible blue
dye such as isosulfan blue. However, these staining materials have
deficits in imaging such as poor tissue contrast and difficult
detection in deeper anatomical regions. There is also a high
false-positive rate in lymphatic mapping using the blue dye. As
with radioactive isotopes, the high radioactivity of the primary
injection site may interfere with intraoperative in vivo
detection of nearby nodes (3,4). The
emerging nanocrystal fluorescence material, namely semiconductor
quantum dots (QDs) or semiconductor nanocrystals, are not only free
from such problems, but also have unique optical properties. Under
proper light excitation, semiconductor QDs of different sizes and
materials emit a narrow and tunable spectrum (5,6).
Compared with organic dyes such as rhodamine, semiconductor QDs are
20 times brighter, 100 times more stable against photobleaching and
are 1/3 wider in spectral bandwidth. Moreover, this nanocrystal
fluorescence material is water-soluble and biocompatible (7,8). In
addition, the surface area-to-volume ratio of semiconductor QDs is
larger and may therefore be grafted onto the surface of certain
specific biomolecules, such as peptides, polyethylene, ligands and
antibodies (9,10). However, QDs have their shortcomings.
Primary QDs, driven by internal circulation, fail to bind
specifically to target proteins and remain in place. On this basis,
we grafted primary QDs onto the monoclonal antibody CC49 for the
purpose of obtaining CC49-QDs that not only bind specifically to
tumor cells but also maintain the desired optical properties. These
QDs therefore work as bioprobes in immunofluorescence imaging
(11).
In this study, tumor-associated glycoprotein TAG-72
was adopted, with a macromolecular weight of approximately 220 to
400 kDa (12), as it is expressed
on the surface of or in tumor cells in a variety of cancers, such
as colonic adenocarcinoma, invasive ductal carcinoma of the breast,
non-small cell lung carcinoma, epithelial ovarian carcinoma, and
pancreatic and gastric cancers, while it cannot be expressed in
normal tissues and cells (13). The
expression rate of TAG-72 in gastric cancers has been revealed to
be as high as 75% (14). CC49 was
adopted as the antibody. The first generation antibody B72.3 and
the second generation CC antibodies are both commonly used to react
with TAG-72. The CC series, comprised of 28 antibodies, was
purified from the first generation antibody and has been shown to
be capable of reacting with TAG-72 via both radioimmunoassay and
immunohistochemical analyses. According to the reactive results of
CC antibodies in a direct-binding radioimmunoassay to a range of
human carcinomas, western blotting, live cell surface binding
assays, five liquid competition radioimmunoassays and Ka
measurements, nine CC antibodies (CC11 CC15, CC29, CC30, CC40,
CC46, CC49, CC83 and CC92) were selected for further analyses
(15,16). Thus, CC49 was selected, as it has a
much higher Ka than B72.3 (16×109 vs.
2.5×10⁹/mol), to bind to primary QDs to synthesize
CC49-QDs. These CC49-QDs are able to specifically bind to gastric
tumor cell antigens (17).
It has been found that following injection into
living animals, the localization of QDs may be monitored via
fluorescence imaging; i.e., QDs can be used in vivo
(18,19). Therefore, CC49-QDs were synthesized
by binding primary QDs to CC49 antibodies in the hope that CC49-QDs
could hold on to the target protein via an antibody-antigen
reaction and then be observed via fluorescence imaging. However,
the synthesis of CC49-QDs may lead to size changes that directly
affect optical properties, which may further exert an influence on
their feasibility in animal experiments and clinical practice.
Hence, in this investigation, primary QDs and CC49-QDs were
analyzed to assess potential size changes and subsequent wavelength
changes caused by the size changes, using spectrum analysis.
Thereafter, both primary QDs and CC49-QDs were used to label
gastric tumor cells with immunofluorescence. Meanwhile, a blank
control group and a positive control group with fluorescein
isothiocyanate (FITC)-labeled secondary antibodies were also
determined.
Materials and methods
Materials and apparatus
Cadmium chloride (CdCl2),
3-mercaptopropionic acid (MPA) and sodium borohydride
(NaBH4) were purchased from Acros Organics (Geel,
Belgium). Tellurium powder was purchased from Sigma Aldrich (St.
Louis, MO, USA). N-(3-dimethylaminopropyl)-N-ethylcarbodiimide
hydrochloride (EDC) and N-hydroxysuccinimide (NHS) were supplied by
Shanghai Medpep Co., Ltd, (Shanghai, China). The gastric cancer
cell line MGC80-3 was supplied by the Shanghai Institute for
Biological Sciences, Chinese Academy of Sciences. Certified fetal
bovine serum (US) and bovine serum were supplied by Gibco (Grand
Island, NY, USA). RPMI-1640 and enhanced chemiluminescent (ECL)
substrate were supplied by Hyclone (South Logan, UT, USA). Cell
lysis buffer, phenylmethanesulfonyl fluoride (PMSF) and
4′,6-diamidino-2-phenylindole (DAPI) were supplied by Beyotime
(Shanghai, China). The Enhanced BCA Protein Assay kit was supplied
by BioTek (Highland Park, MI, USA). Goat-anti-mouse IgG (H+L) was
supplied by Jackson Immunoresearch (West Grove, PA, USA).
Beta-actin (ACTB) antibody RabMAb was supplied by Epitomics
(Burlingame, CA, USA). Polyvinylidene fluoride (PVDF) membranes
(0.45 μm) were supplied by Millipore (Billerica, MA, USA).
CC49 monoclonal antibody and secondary antibody were purchased from
Santa Cruz Biotechnology Inc. (Santa Cruz, CA, USA). A transmission
electron microscope (FEI Tecnai F20) purchased from FEI (Lausanne,
Switzerland) and a Fluorescence Lifetime and Steady State
Spectroscopy (FLS920) apparatus purchased from Edinburgh
Instruments (Livingston, UK) were the main imaging devices used in
this experiment. SuperSignal West Femto (FUJIFILM LAS-3000) was
purchased from Thermo Fisher Scientific (Waltham, MA, USA) and a
fluorescence microscope (NIKON 80i) was purchased from Nikon
(Tokyo, Japan).
Synthesis of cadmium telluride (CdTe)
QDs
The synthesis of CdTe QDs has been described in
detail in other studies (20,21).
The first step was to prepare a sodium hydrogen telluride (NaHTe)
solution. NaBH4 (100 mg) was dissolved into 20 ml
distilled water. In an ice-water bath, the solution was deoxidized
under steady nitrogen flow for 30 min. Tellurium powder (127 mg; 1
mmol) was quickly added into the solution. With continuous steady
nitrogen flow and vigorous stirring, a clear purple NaHTe solution
was successfully produced. The second step was to prepare a
CdCl2-MPA solution. CdCl2 (366.6 mg; 2 mmol)
was injected into 100 ml distilled water to produce a solution with
a concentration of 20 mmol. MPA (382.1 mg; 3.6 mmol) was added to
ensure a molar ratio of Cd2+ to MPA of 1:1.8. The pH
level was adjusted to 9.0 by adding 2 mol/l NaOH solution dropwise.
The final step was the preparation of CdTe. NaHTe solution (1 ml)
and CdCl2-MPA (20 ml) were mixed and stirred rapidly.
The mixture precursor solution (9 ml) was transferred into a
teflon-lined stainless steel autoclave which was subsequently
placed in a drying oven at 185˚C for a set amount of time. The
precipitation products were washed three times by ethanol and then
placed into a vacuum drying oven at 40˚C. Primary QDs were thus
obtained.
Synthesis of CC49-QDs
The preparation of CC49-QDs involved EDC and NHS,
which functioned as cross-linkers, TAG-72 monoclonal antibody CC49
and near-infrared CdTe QDs, and was performed by mixing 13.5
μl EDC (0.1 mM), 13.5 μl NHS and 50 μl QD
solution. After shaking for 0.5 h at room temperature, 594
μl CC49 monoclonal antibodies were added, resulting in a 1:4
ratio of CdTe to antibody. Another 2 h was needed for reaction at
room temperature prior to centrifugation, which was performed four
times using a 100 K ultra filter at 5,000 rpm for 15 min. Each
time, the lower strata liquids were discarded, and the supernatant
products were diluted by 200 μl PBS prior to subsequent
centrifugation. The final product was diluted by PBS (pH 7.4) and
stored in a refrigerator at 4°C (22).
QD and CC49-QD electron microscopy and
spectrum analysis
The prepared primary QDs and CC49-QDs were
separately diluted in deionized water and several drops were
applied to two pieces of carbon film supported by a copper mesh.
When the water volatilized, they were placed under an electron
microscope which was adjusted to 200 V under the stem mode for
observation. Images were then obtained.
Diluted QDs and CC49-QDs were placed under a
spectrofluorimeter with a 450 nm excitation wavelength and a 1 mm
slit. The curves of the spectra were drawn by recording the
intensities of each nanometer of emission light between 550 and 800
nm.
Antigen expression analysis
For protein extraction and quantification, cells
were cultured in 10% fetal bovine serum, which was diluted by
modified RPMI-1640 in a CO2 incubator. Approximately
106 cells were washed twice in precooled PBS, and 395
μl cell lysis buffer and 5 μl PMSF were added. The
cells were lysed on ice for 30 min, scraped using a cell scraper
and transferred into a 1.5 ml EP tube to be stored at 4˚C for
another 30 min. They were subsequently centrifuged at 12,000 rpm
for 5 min at 4˚C and the supernatant was quantified using a BCA
Protein Assay kit. The supernatant (40 μl) was mixed with
SDS sample buffer and packed into a 0.2 ml EP tube. This was used
in the western blot analysis following heating.
For the western blot analysis, samples containing
approximately 80 μg protein were mixed with SDS sample
buffer and set in a 100˚C heating block for 5 min prior to
separation on a board with a 6% spacer gel and 8% separation gel
under 120 V. The protein was then transferred onto a PVDF membrane
along with a spectra multicolor broad range protein ladder.
Following the transfer, the PVDF membrane was blocked with 5%
non-fat dry milk in TBS/0.1% Tween-20 (TBST) for 2 h on the shaker
and then incubated with the monoclonal antibody CC49 at a dilution
of 1:500. Given that TAG-72 was our target protein, whose molecular
weight is between 220 and 240 kDa, beta-actin was adopted at
approximately 40 kDa as a housekeeping protein and it was detected
with the beta-actin antibody RabMAb diluted to 1:1,000. The
relative intensity of the beta-actin protein bands for the cell
line was used to evaluate the amount of the sample protein that was
loaded. Following an overnight incubation at 4˚C the PVDF membrane
was washed 3 times, each for 5 min in TBST at room temperature.
Thereafter, the secondary antibody, HRP-linked anti-mouse IgG
(H+L), diluted at 1:2,000, was added and the membrane was incubated
for 1 h at room temperature and washed again 3 times for 5 min with
TBST. Following incubation of the membrane for 1 min, the protein
was visualized with ECL substrate and subsequently exposed for 30
sec (12).
Immunofluorescence
Cells were distributed into four 6-well chamber
slides and labeled as group 1, 2, 3 or 4. Group 1, the blank group,
formed the negative control group. Group 2 was set as the CC49-QD
group and Group 3 was set as the primary QD group. Group 4, the
fluorescent secondary antibody group, was the positive control
group. All four slides were incubated in a CO2 incubator
until the cells covered the bottom of the wells. The culture
solution was then removed and the cells were washed three times
with PBS, each for 5 min. Another three washes for 5 min each with
PBS were needed after the cells were incubated in 4%
paraformaldehyde for 15 min. The cells were then blocked in 10%
bovine serum for 30 min and subjected to three more washes.
Subsequently, 1 ml PBS, 1 ml CC49-QDs, 1 ml primary QDs and 1 ml
CC49 monoclonal antibody, diluted to 1:500 with PBS, were added
into the wells of groups 1–4, respectively. Following incubation
for 2 h in an incubator at 37˚C, groups 1–3 were subjected to
nuclear staining using DAPI for 5 min, and then washed three times
with PBS (each for 3 min) before being observed under a fluorescent
microscope. Group 4, prior to observation, underwent three PBS
washes (each for 3 min), then 1 ml fluorescent secondary antibody
was added and diluted to 1:1,000 with PBS. Group 4 cells were
subsequently incubated at 37˚C for 1 h, stained using DAPI and
finally washed again three times each for 5 min. Thus,
immunofluorescent images of the four groups were obtained (23).
Results
QD and CC49-QD electron microscopy and
spectrum analysis
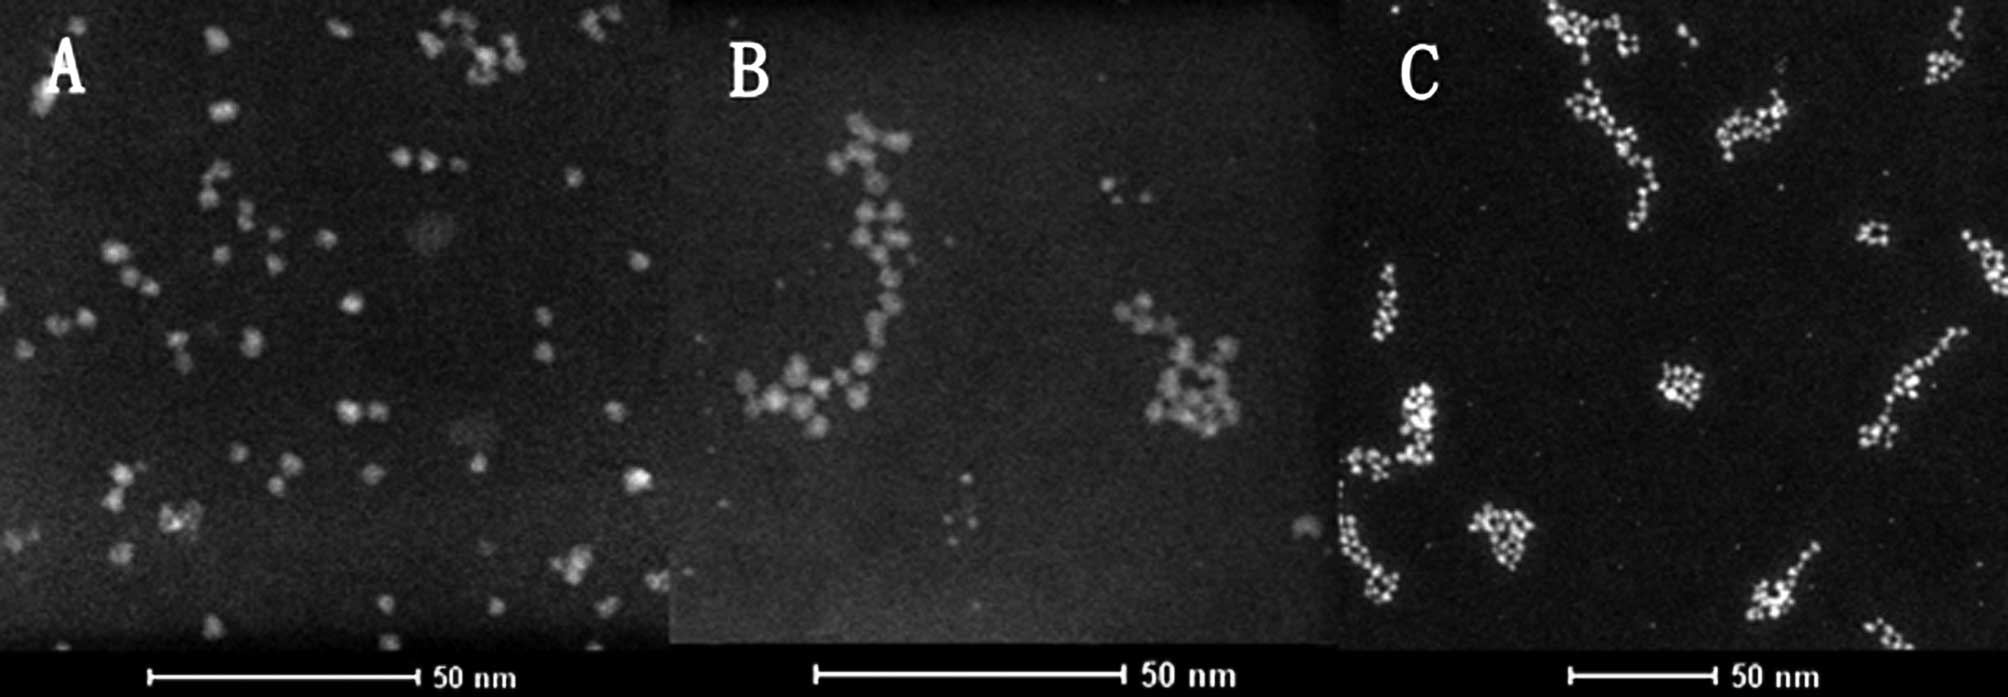
Transmission electron microscopy revealed that the
diameters of QDs were approximately 2.24 to 4.91 nm, averaging 3.47
nm (Fig. 1A). The diameters of
CC49-QDs were approximately 3.30 to 5.65 nm, averaging 3.72 nm
(Fig. 1B), with a 0.25 nm higher
average than that of QDs. Fig. 1B and
C shows how certain CC49-QDs assembled together, resulting in
the formation of QD clusters of different diameters from 7.69 to
55.77 nm, averaging 23.76 nm.
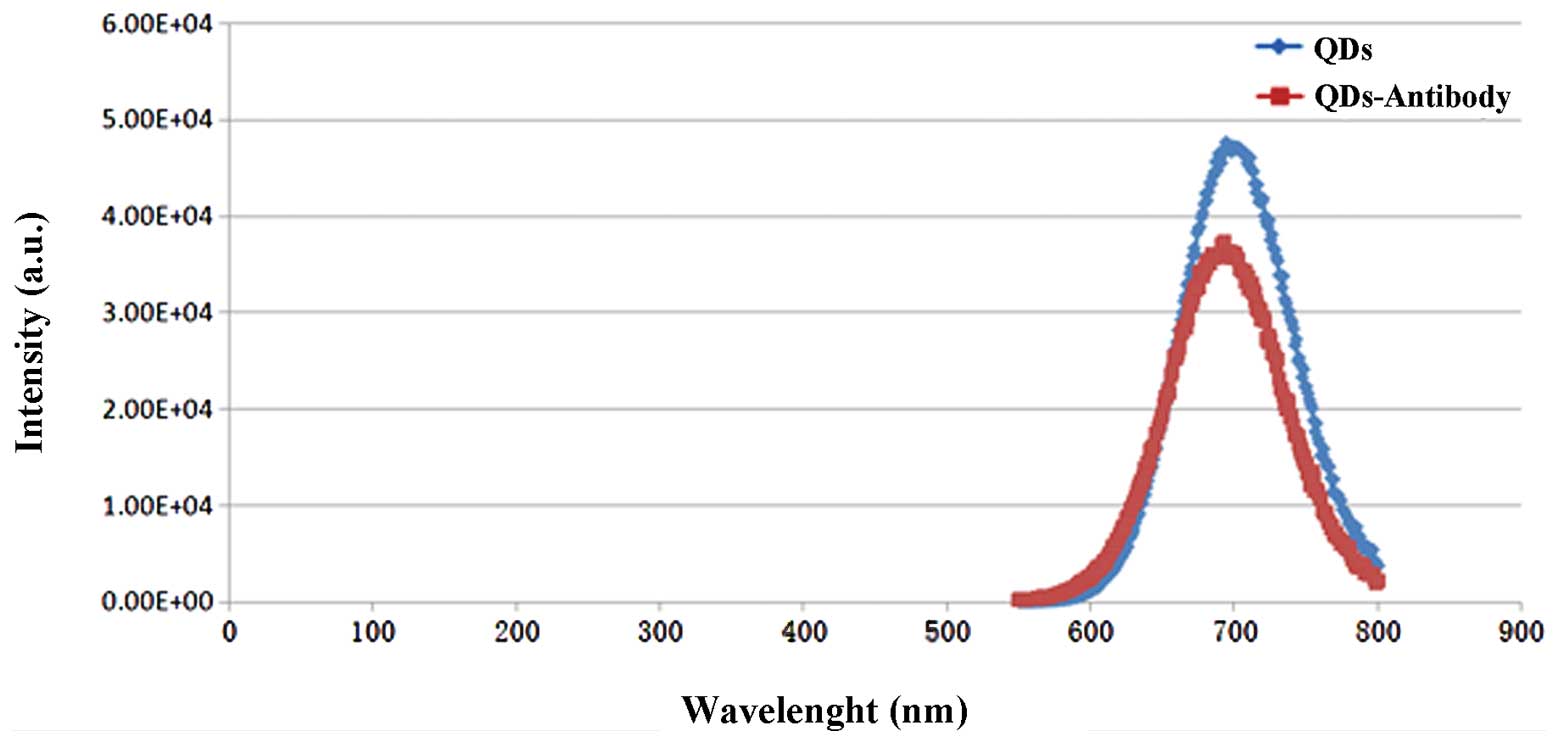
With the ordinate denoting light intensity and the
abscissa denoting wavelength, the spectrum curves for QDs and
CC49-QDs were drawn. As shown in Fig.
2, the emission light wavelengths of primary QDs were between
620 and 780 nm, and the peak appeared at approximately 680 nm. The
wavelengths of the CC49-QD emission light were between 600 and 800
nm, and the peak appeared at approximately 710 nm. Although the
light dimmed slightly following grafting, it was still
significantly stronger than that of organic dyes.
Western blotting
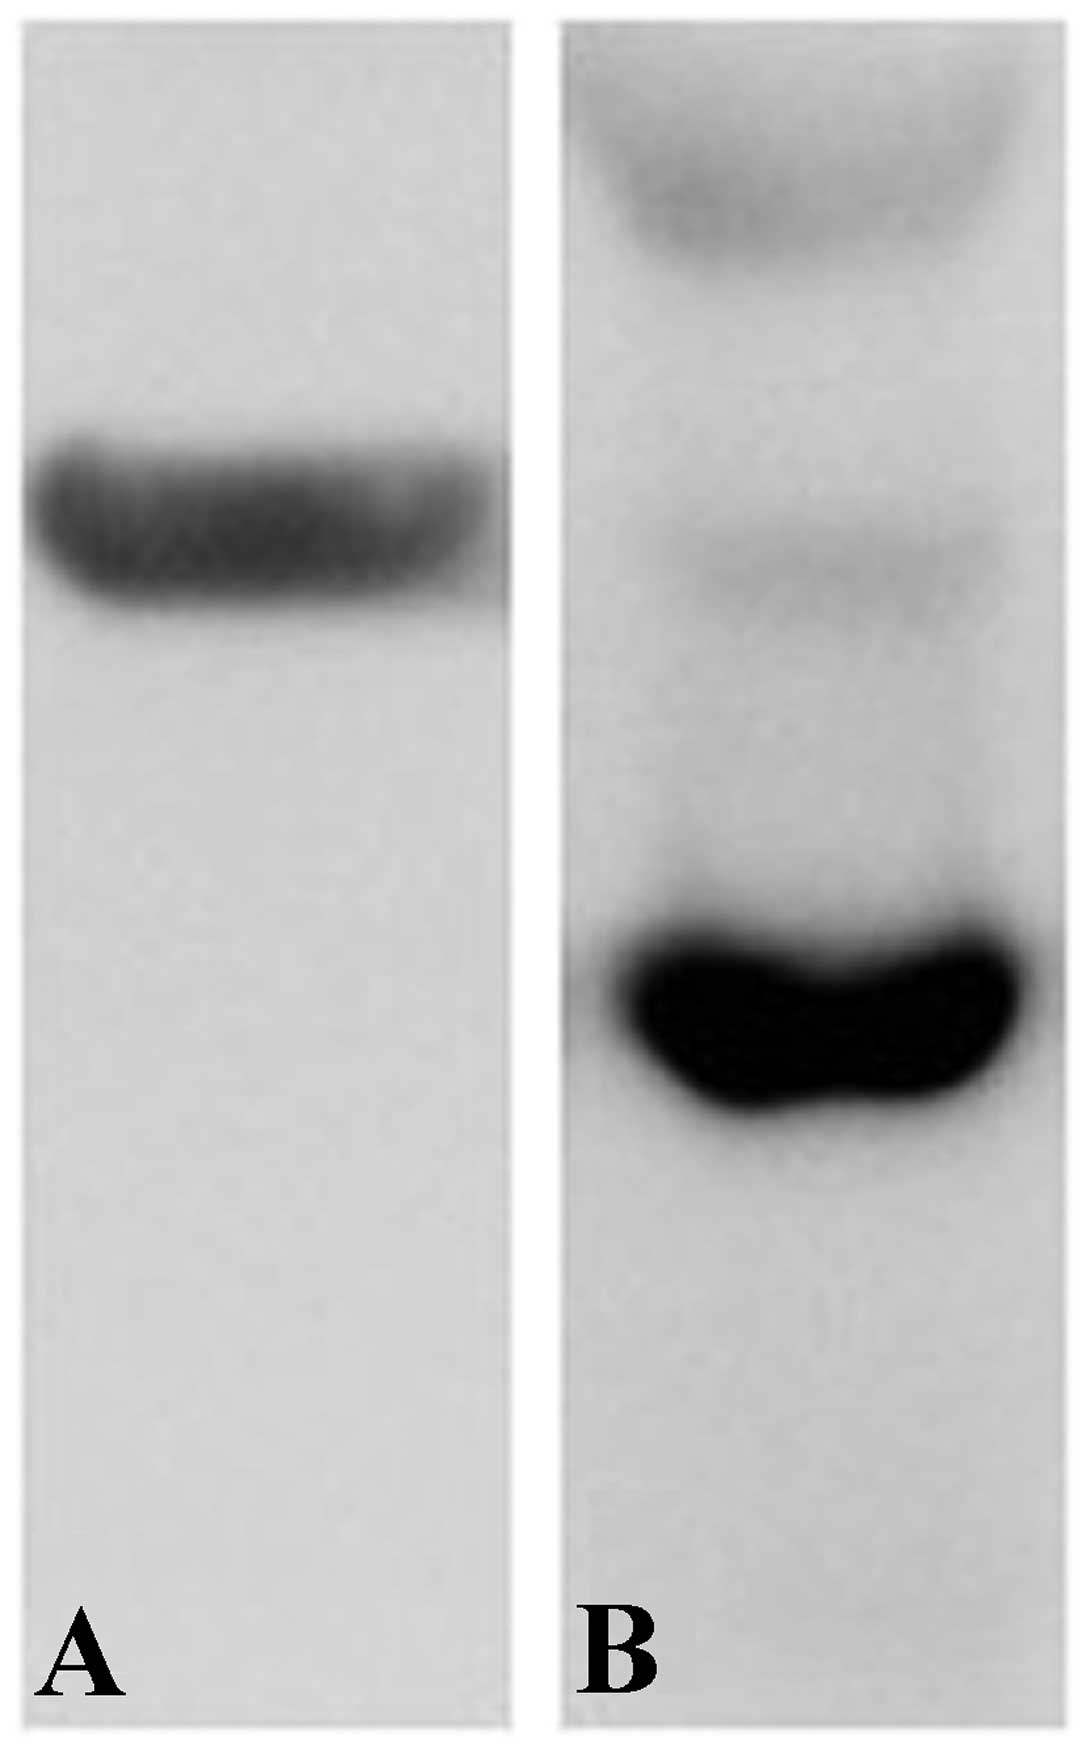
In the experiment, the protein contents of 1, 2, 4
and 8 μl protein solutions were measured to be 1.849, 3.702,
7.214 and 15.515 μg/μl, respectively. When the volume
of the sample exceeded 12 μl, the content was beyond the
capability of the measuring device. Consequently, we conjectured,
based on the above measurement of the protein content of the
40-μl sample in the western blot, that is was approximately
80 μg. As a result, two protein images were obtained; one
was the dark-colored beta-actin image (Fig. 3B) and the other was the
light-colored TAG-72 image (Fig.
3A).
Immunofluorescent imaging
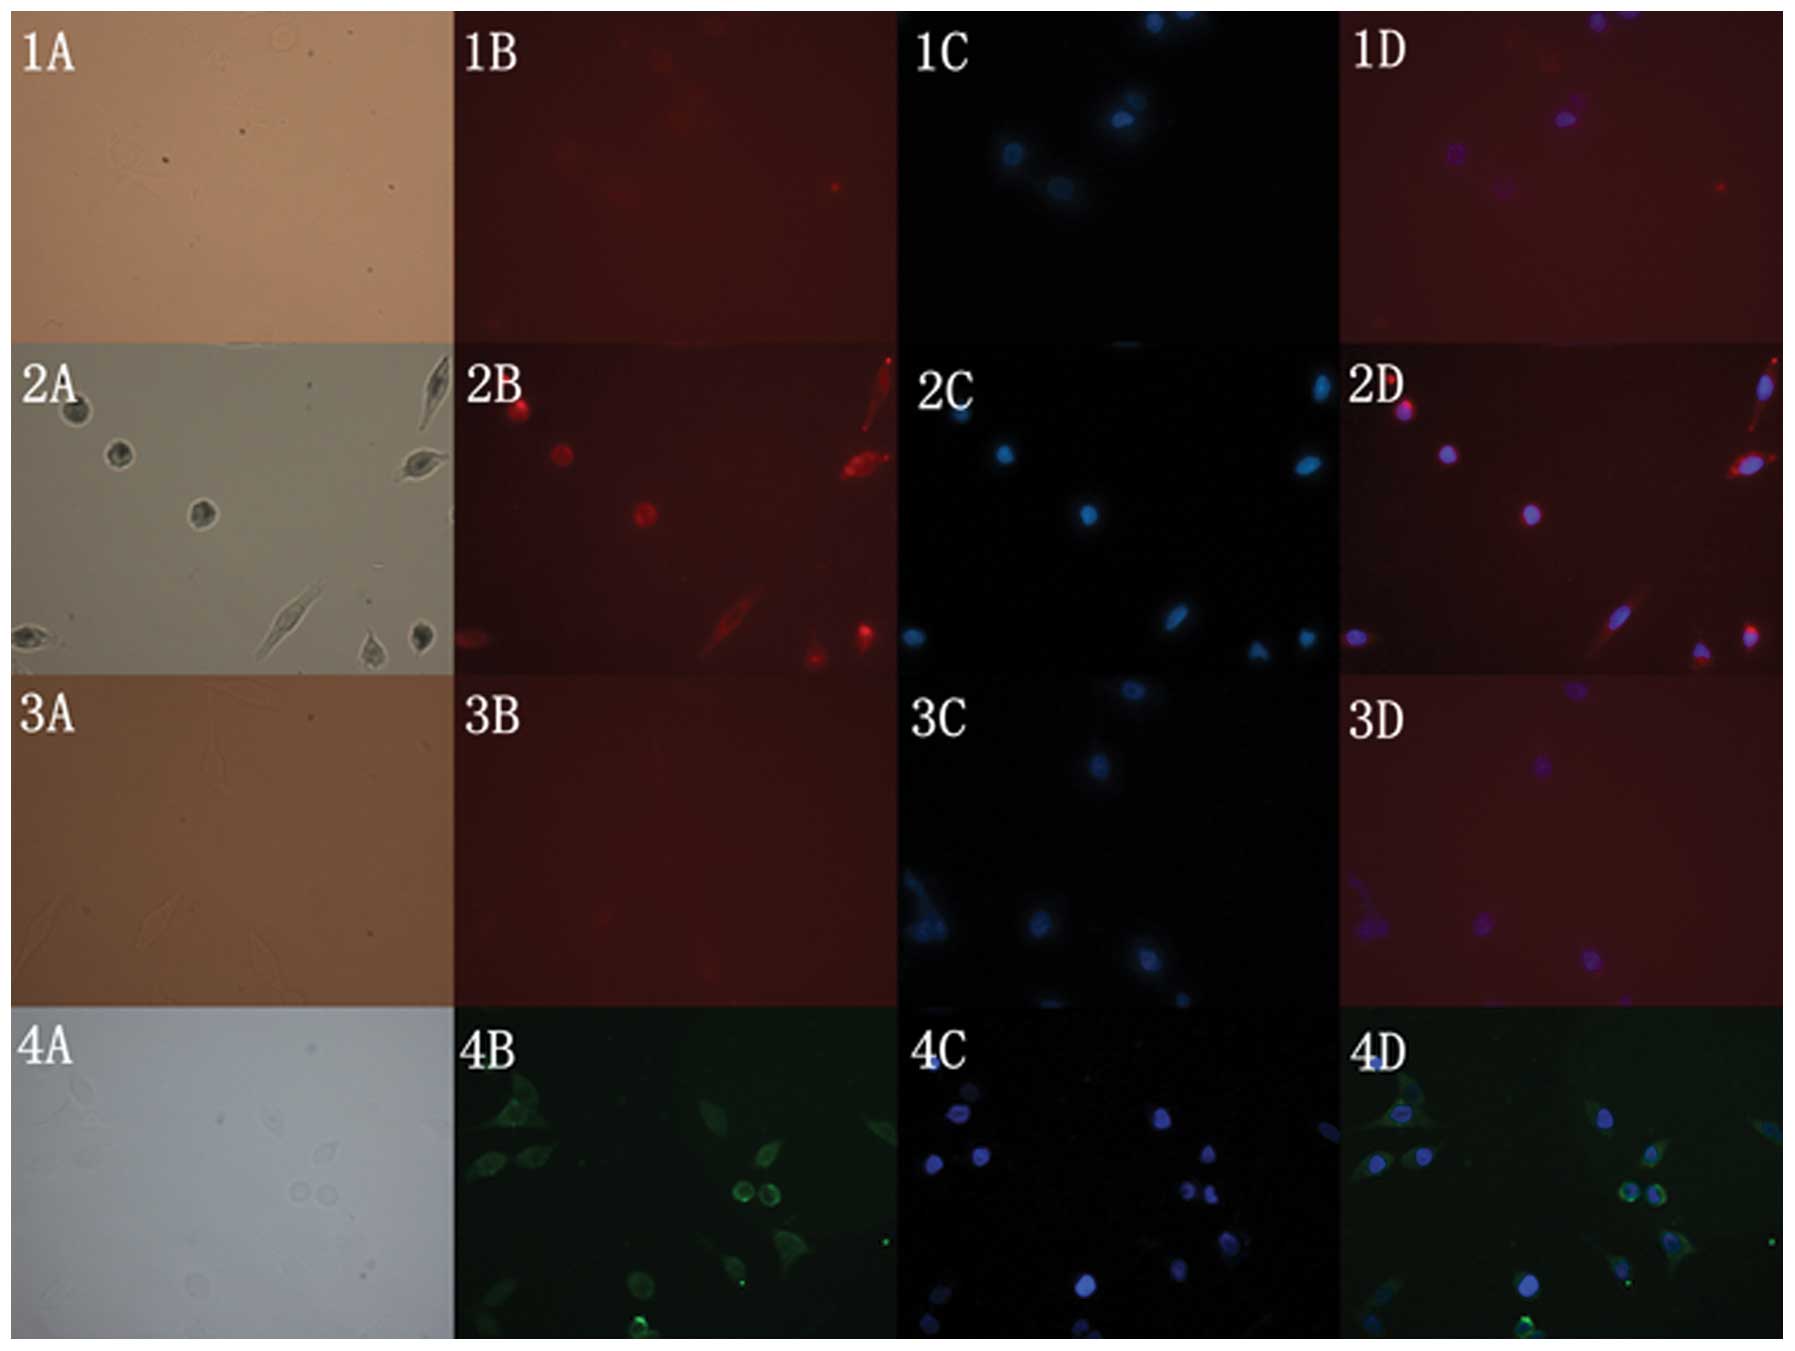
The images of the four groups were all observed
under an optical microscope and fluorescence microscope. The blank
group had an unclear image under the optical microscope [Fig. 4(1A)] and the fluorescence microscope
[Fig. 4(1B], while the nuclei
stained by DAPI were observed clearly under the ultraviolet
excitation light [Fig. 4(1C)]. For
the CC49-QD group, a clear image was observed both under the
optical microscope [Fig. 4(2A)] and
the fluorescence microscope [Fig.
4(2B)]. The nuclei stained by DAPI were also observed clearly
under the ultraviolet excitation light [Fig. 4(2C)]. From Fig. 4(2D), which was formed by merging
Fig. 4(2B) and (2C), we found that
the highlighted cell fluorescence image overlapped with the nucleus
image perfectly. In contrast, for the primary QD group, it was hard
to distinguish the cell image under the optical microscope
[Fig. 4(3A)] and the fluorescence
microscope [Fig. 4(3B)]; however,
the DAPI-stained nuclei were observed [Fig. 4(3C)]. In the positive control group,
a vague cell image was visible under the optical microscope. Since
it was labeled by a fluorescent secondary antibody with a FITC
wavelength, a highlighted and clear cell fluorescent image could be
visualized under the FITC stem mode [Fig. 4(4B)]. The DAPI-stained nucleus image
was also observed clearly [Fig.
4(4C)]. Fig. 4(4D) was the
result of merging Fig. 4(4B) and
(4C), denoting the cell fluorescence image and the nucleus
overlap.
Discussion
For non-invasive imaging, near-infrared QDs are
better than traditional organic dyes in many ways and manifest
great potential value in the clinical detection and treatment of
cancer. Therefore, in this experiment, they were adopted to bind
with CC49 monoclonal antibodies to form CC49-QDs. The synthesized
CC49-QDs worked as a specific bioprobe and were employed in
immunofluorescence imaging. In addition, CC49-QDs may also be
further applied to animal models of gastric cancer for tracking
tumor metastasis.
In this study, the near-infrared CdTe QDs were
synthesized by a hydrothermal method (23,24).
There are two commonly used methods for QD preparation: organic
metal synthesis and aqueous medium synthesis. The former, also
named TOP-TOPO (trioctylphosphine oxide-trioctylphosphine) is
widely used and has high quantum yields; however, it also has a
high cost and demands strict external conditions. In addition,
certain materials that are needed, such as dimethylcadmium, are
highly toxic and harmful to health. Above all, the CC49-QDs
prepared by this route are not able to dissolve into the internal
environment due to low solubility unless subjected to complicated
modification. All of these factors prevent wider use and extensive
research using QDs. Hence, following the development of synthetic
techniques and the ability to grow in yields, aqueous medium
synthesis predominates due to its simplicity and reproducibility.
Materials used in this method are of lower toxicity and do not
demand strict external conditions, which lead to a significant cost
reduction. In addition, QDs produced by this method dissolve in the
internal environment easily and may be stored for up to 2 years
after drying. The bioprobe made in this way, bearing higher
solubility and smaller size, promotes more effective in vivo
fluorescence imaging (24).
With bioprobe production, near-infrared QDs occupy
many superior optical properties compared to traditional organic
dyes. They have a larger Stoke’s shift (the wavelength difference
between the excitation light and emission light), which helps avoid
overlap of emission and excitation lights and thereby enhances the
sensitivity of immunofluorescence (25). The Stoke’s shift of organic
fluorescence dyes is smaller and their emission wavelengths are
usually between 450 and 550 nm. Within this range, strong
background autofluorescence is produced from endogenous
chromophores such as collagens, porphyrins and flavins, therefore
the label fluorescence may be overwhelmed. For this reason, its
utilization in bioluminescence imaging is confined (26). In contrast, near-infrared QDs
surmount the organic fluorescence dyes in the above-mentioned
aspects. Furthermore, within the wavelength range of the
near-infrared spectrum (650–900 nm) (27), the absorbance by water and red blood
cells is low, absorption and scattering of optical photons in
tissues is low and the optical photon emission intensity is the
strongest. All these factors are favorable for producing clearer
fluorescence images (28). As
mentioned above, a 450-nm excitation light was adopted in our study
to excite the primary QDs and CC49-QDs. The measurement revealed
that the emission light wavelengths of primary QDs were between 620
and 780 nm and the peak appeared at approximately 680 nm. The
wavelengths of the CC49-QD emission light were between 600 and 800
nm and the peak appeared at approximately 710 nm. The Stoke’s shift
was approximately 200–300 nm and the emission light was near
infrared. This result demonstrated that the Stoke’s shift of our
CC49-QDs was large enough and its wavelength allowed the
autofluorescence to dominate. More sensitive real-time imaging of
tissues and cells can be achieved; therefore, the use of CC49-QDs
as bioprobes in living animals is of great practical value.
QDs have advantages as a promising bioprobe
material; however, certain disadvantages have hindered its
practical use. For example, primary QDs tend not to conduct
specificity in binding to target proteins due to surface carboxylic
acid and amines. Bulks may grow due to their non-specific binding
to cellular membranes, proteins and extracellular matrix materials.
In any case, it is the non-specificity that causes a high level of
background fluorescence and false-positive results in imaging.
Therefore, the surface of QDs needs modification for practical
application, including direct ligand exchange reactions and
indirect surface encapsulation. Materials used in surface coating
are silica, lipid and amphiphatic molecular polymers (29,30).
In the present study, an MPA coating was used to minimize the
non-specific absorption. We demonstrated that MPA markedly reduced
exposed free carboxylic acids, prevented non-specific binding and
guaranteed the stability of QDs in water solution. In this way,
non-specific binding did not blur the imaging (31).
The optical properties of QDs are size-dependent;
that is, when excited by proper light, QDs of different sizes emit
narrow and tunable lights of different wavelengths. It follows that
the size of QDs defines their optical properties and proceeds to
impact their use in immunofluorescence imaging as bioprobes. The
surface coating and CC49 monoclonal antibody may impact the QD size
and optical properties, which seemingly countered our initial
design. To avoid this, we first measured the diameters of primary
QDs and CC49-QDs under an optical microscope. This revealed that
the diameters of QDs were approximately 2.24 to 4.91 nm, averaging
3.47 nm (Fig. 1A), while those of
the CC49-QDs were approximately 3.30 to 5.65 nm, averaging 3.72 nm
(Fig. 1B). The difference was not
significant and was only approximately 0.25 nm; however, CC49-QDs
gathered together and formed 7.69 to 55.77-nm-sized QD bulks in
solution, with an average size of 23.76 nm. This change was
significant in relation to primary QDs. Consequently, a spectrum
analysis was needed to judge its availability. Fig. 2 shows the analysis results. The
emission light wavelengths of modified QDs were between 620 and 780
nm, while those of CC49-QDs emission lights were between 600 and
800 nm. With a 480-nm excitation light, their emission spectrum
regions were approximately the same. Thus, it was justified to use
CC49-QDs for tumor cell imaging since the modification did not
change the optical properties.
The most superior property of the prepared CC49-QDs,
however, lay in the binding specificity of the CC49 monoclonal
antibody to gastric tumor cell antigen TAG-72. Due to this
specificity, we achieved fluorescence labeling of gastric tumor
cells using CC49-QDs. In other words, the presence of TAG-72 served
as the prerequisite for immunofluorescence imaging in our study. To
justify the feasibility of immunofluorescence imaging, western
blotting was adopted to determine the characterization of MGC80-3
gastric tumor cell lines. It verified the existence of TAG-72 in
gastric tumor cell lines.
As for the results of immunofluorescence imaging,
only vague cell images were observed in the primary QD group as in
the negative control group. Compared with the images in the
positive control group, the intensity was similar. By contrast, in
the CC49-QD group, the cell boundaries were clear and the intensity
was even stronger than in the positive control group. This result
indicated that there were many more QDs binding to gastric tumor
cells in the target QD group than in the primary QD group. To
confirm the binding, DAPI was used to stain the nucleus in order to
locate cells. In this way, a perfect overlap could be obtained, and
it was found that the stained nuclei were lying in the center of
the cells, surrounded by the fluorescence boundaries. We thereby
confirmed specific binding. The study demonstrated the specific
binding of CC49-QD probes to gastric tumor cells, which facilitated
immunofluorescence labeling. In addition, the detection of their
optical properties demonstrated their advantages as a type of
bioprobe. These results provide experimental support for tracking
gastric tumor cell metastasis in gastric tumor animal models.
Acknowledgements
This study was supported by the
National Nature Science Foundation of China (No. 20874015) and the
Science and Technology Commission Nano Special Fund of the Shanghai
Municipality (No. 1052nm03802).
References
|
1.
|
GJ KrejsGastric cancer: epidemiology and
risk factorsDig Dis28600603201010.1159/00032027721088409
|
|
2.
|
Japanese Gastric Cancer
AssociationJapanese gastric cancer treatment guidelinesGastric
Cancer141131232011
|
|
3.
|
EG SolteszS KimSW KimRG LaurenceAM GrandCP
ParungoLH CohnMG BawendiJV FrangioniSentinel lymph node mapping of
the gastrointestinal tract by using invisible lightAnn Surg
Oncol13386396200610.1245/ASO.2006.04.02516485157
|
|
4.
|
S OhnishiSJ LomnesRG LaurenceA GogbashianG
MarianiJV FrangioniOrganic alternatives to quantum dots for
intraoperative near-infrared fluorescent sentinel lymph node
mappingMol Imaging4172181200516194449
|
|
5.
|
X MichaletFF PinaudLA BentolilaJM TsayS
DooseJJ LiG SundaresanAM WuSS GambhirS WeissQuantum dots for live
cells, in vivo imaging, and
diagnosticsScience307538544200510.1126/science.110427415681376
|
|
6.
|
AP AlivisatosW GuC LarabellQuantum dots as
cellular probesAnnu Rev Biomed
Eng75576200510.1146/annurev.bioeng.7.060804.10043216004566
|
|
7.
|
WC ChanS NieQuantum dot bioconjugates for
ultrasensitive nonisotopic
detectionScience28120162018199810.1126/science.281.5385.20169748158
|
|
8.
|
ME ÅkermanWC ChanP LaakkonenSN BhatiaE
RuoslahtiNanocrystal targeting in vivoPNAS9912617126212002
|
|
9.
|
X GaoL YangJA PetrosFF MarshallJW SimonsS
NieIn vivo molecular and cellular imaging with quantum dotsCurr
Opin Biotechnol166372200510.1016/j.copbio.2004.11.00315722017
|
|
10.
|
ZG LiK YangYA CaoG ZhengDP SunC ZhaoJ
YangIn vivo study of the effects of peptide-conjugated
near-infrared fluorescent quantum dots on the tumorigenic and
lymphatic metastatic capacities of squamous cell carcinoma cell
line Tca8113 and U14Int J Mol
Sci1114131422201010.3390/ijms1104141320480027
|
|
11.
|
K YangFJ ZhangH TangC ZhaoYA CaoXQ LvD
ChenYD LiIn vivo imaging of oral squamous cell carcinoma by EGFR
monoclonal antibody conjugated near-infrared quantum dots in
miceInt J Nanomedicine617391745201110.2147/IJN.S2334821980236
|
|
12.
|
L ChenY WangX LiuS DouG LiuDJ HnatowichM
RusckowskiA new TAG-72 cancer marker peptide identified by phage
displayCancer
Lett272122132200810.1016/j.canlet.2008.07.00918723274
|
|
13.
|
AJ PatersonJ SchlomHF SearsJ BennettD
ColcherA radioimmunoassay for the detection of a human tumor
associated glycoprotein (TAG-72) using monoclonal antibody B72.3Int
J Cancer37659666198610.1002/ijc.29103705043699929
|
|
14.
|
A ThorN OhuchiCA SzpakWW JohnstonJ
SchlomDistribution of oncofetal antigen tumor-associated
glycoprotein-72 defined by monoclonal antibody B72.3Cancer
Res463118312419863516392
|
|
15.
|
VG JohnsonJ SchlomAJ PatersonJ BennettJL
MagnaniD ColcherAnalysis of a human tumor - associated glycoprotein
(TAG-72) identified by monoclonal antibody B72.3Cancer
Res4685085719863940648
|
|
16.
|
R MuraroM KurokiD WunderlichDJ PooleD
ColcherA ThorJW GreinerJF SimpsonA MolinoloP NoguchiJ
SchlomGeneration and characterization of B72.3 second generation
monoclonal antibodies reactive with the tumor-associated
glycoprotein 72 antigenCancer Res484588459619883396010
|
|
17.
|
DG SheerJ SchlomHL CooperPurification and
composition of the human tumor-associated glycoprotein (TAG-72)
defined by monoclonal antibodies CC49 and B72.3Cancer
Res486811681819883180090
|
|
18.
|
B BallouBC LagerholmLA ErnstMP BruchezAS
WaggonerNoninvasive imaging of quantum dots in miceBioconjugate
Chem157986200410.1021/bc034153y14733586
|
|
19.
|
X GaoY CuiRM LevensonLW ChungS NieIn vivo
cancer targeting and imaging with semiconductor quantum dotsNat
Biotechnol22969976200410.1038/nbt99415258594
|
|
20.
|
J GuoW YangC WangSystematic study of the
photoluminescence dependence of thiol-capped CdTe nanocrystals on
the reaction conditionsJ Phys Chem
B1091746717473200510.1021/jp044770z16853233
|
|
21.
|
H ZhangL WangH XiongL HuB YangW
LiHydrothermal synthesis for high-quality CdTe nanocrystalsAdv
Mater1517121715200310.1002/adma.200305653
|
|
22.
|
M HuJ YanY HeH LuL WengS SongC FanL
WangUltrasensitive, multiplexed detection of cancer biomarkers
directly in serum by using a quantum dot-based microfluidic protein
chipACS Nano4488494201010.1021/nn901404h20041634
|
|
23.
|
P ZouS XuSP PovoskiA WangMA JohnsonEW
Martin JrV SubramaniamR XuD SunNear-infrared fluorescence labeled
anti-TAG-72 monoclonal antibodies for tumor imaging in colorectal
cancer xenograft miceMol
Pharm6428440200910.1021/mp900005219718796
|
|
24.
|
N GaponikDV TalapinAL RogachK HoppeEV
ShevchenkoA KornowskiA EychmullerH WellerThiol-capping of CdTe
nanocrystals: an alternative to organometallic synthetic routesJ
Phys Chem B10671777185200210.1021/jp025541k
|
|
25.
|
JK JaiswalSM SimonPotentials and pitfalls
of fluorescent quantum dots for biological imagingTrends In Cell
Biol14497504200410.1016/j.tcb.2004.07.01215350978
|
|
26.
|
MK SoC XuAM LoeningSS GambhirJ
RaoSelf-illuminating quantum dot conjugates for in vivo imagingNat
Biotechnol24339343200610.1038/nbt118816501578
|
|
27.
|
Z ChengY WuZ XiongSS GambhirX
ChenNear-infrared fluorescent RGD peptides for optical imaging of
integrin αVβ3 expression in living miceBioconjugate
Chem16143314412005
|
|
28.
|
H TanisakaS Kizaka-KondohA MakinoS TanakaM
HiraokaS KimuraNear-infrared fluorescent labeled peptosome for
application to cancer imagingBioconjugate
Chem19109117200810.1021/bc700166518163535
|
|
29.
|
BA KairdolfMC ManciniAM SmithS
NieMinimizing nonspecific cellular binding of quantum dots with
hydroxylderivatized surface coatingsAnal
Chem8030293034200810.1021/ac800068q18324840
|
|
30.
|
EL BentzenID TomlinsonJ MasonP GreschMR
WarnementD WrightE Sanders-BushR BlakelySJ RosenthalSurface
modification to reduce nonspecific binding of quantum dots in live
cell assaysBioconjugate
Chem1614881494200510.1021/bc050200616287246
|
|
31.
|
D GerionF PinaudSC WilliamsJW ParakD
ZanchetS WeissAP AlivisatosSynthesis and properties of
biocompatible water-soluble silica-coated CdSe/ZnS semiconductor
quantum dotsJ Phys Chem B10588618871200110.1021/jp0105488
|