Introduction
Melanoma, a malignancy that arises from melanocytes,
accounts for approximately 10% of skin tumors. It has hereditary
aspects (1), and in recent years
its incidence has increased (2).
The early symptoms are often difficult to detect, thus making
treatment more challenging since the disease progresses rapidly and
undergoes metastasis to result in poor prognosis. Clinical
diagnosis is most frequently made once the cancer has undergone
distant metastasis or regional lymph node metastasis. The mortality
rate currently stands at 80%, while the 5-year survival rate is
less than 5% and is significantly correlated with the number of
metastases (3). Therefore, the
interpretation of melanoma invasion and metastasis mechanisms to
control tumor development is the key to lowering mortality.
microRNAs are small, non-coding RNAs that regulate
gene expression by binding to mRNA 3’UTRs, which results in mRNA
degradation or translation (4–8).
microRNA regulates embryonic development, cell proliferation,
apoptosis, cell differentiation, lipid metabolism and other
important cellular functions, particularly in tumor development,
where its function is similar to that of oncogenes or tumor
suppressor genes (9–11). When oncogenes and tumor suppressor
genes are disrupted, or the activity of telomerase persists,
tumorigenesis occurs. The most notable feature of tumor cells is
uncontrolled proliferation and non-differentiation. There are three
checkpoints in the cell cycle, which control
G0/G1, G1/S and G2/M.
By regulating the cell cycle, it is possible to inhibit tumor
growth and proliferation.
In clinical specimens of skin melanoma, we
previously found that let-7b, microRNA-199a and microRNA-33 were
significantly associated with metastatic melanoma (12). Notably, opposing findings have been
described for ovarian carcinoma (13) and non-small cell lung cancer
(14). Downregulated expression of
let-7b and microRNA-199a was significantly correlated with poor
prognosis in ovarian carcinoma (13). In this study, B16F10 melanoma cells
were transfected with plasmids that targeted let-7b and
microRNA-199a, in order to investigate the correlation between
microRNA expression and melanoma metastasis.
Materials and methods
The study was approved by the The Third XiangYa
Hospital of Central South University, Hunan, China.
Materials
PGCsi-U6/neo/GFP-hsa-let-7b plasmid and
PGCsi-U6/neo/GFP-hsa-miR-199a plasmid were obtained from Ji Kai
Chemical Technology Company (Shanghai, China). Hsa-let-7b miRNA
inhibitor, hsa-microRNA-199a miRNA inhibitor and
microRNA-Ribo™ Inhibitor Negative Control were purchased
from Rui Bo Biological Technology Company (Guangzhou, China).
Grouping
Experiments were divided into the following groups:
i) control group: B16F10 cells; ii) let-7b plasmid group:
liposome-mediated targeting of let-7b overexpression plasmid; iii)
microRNA-199a plasmid group: liposome-mediated targeting of
microRNA-199a overexpression plasmid; iv) empty plasmid group:
liposome-mediated targeting of empty plasmid; v) let-7b microRNA
inhibitor group: liposome-mediated targeting of let-7b inhibitor
fragment; vi) microRNA-199a inhibitor group: liposome-mediated
targeting of microRNA-199a inhibitor fragment; vii) inhibitor
control group: liposome-mediated targeting of negative control
inhibitor fragment.
Transfection
B16F10 cells were seeded at a density of
5x10⁴ cells/ml in 6-well plates. Each well contained 2
ml RPMI-1640 complete medium. When cells had reached 80–90%
confluency, plasmids were transfected, while inhibitor fragments
were transfected into cells at 30–50% confluency. Cells were washed
twice with PBS, and 1.5 ml serum-free RPMI-1640 medium was added to
each well. Then 4.0 μg plasmid DNA or 5.0 μl inhibitor was added to
250 μl serum-free RPMI-1640 medium (liquid A), and 8 μl or 5 μl
liposomes were added to 250 μl serum-free RPMI-1640 medium (liquid
B). Then, liquids A and B were mixed, incubated for 15 min at room
temperature, and added to 6-well plates at 500 μl/well.
Approximately 4–6 h after transfection, RPMI-1640 complete medium
was replaced.
Real-time PCR verification of let-7b and
microRNA-199a expression
Cells were collected at 24–36 h after transfection
and lysed using TRIzol solution to extract RNA. Following
quantitation using an ultraviolet spectrophotometer, 1 μg genomic
RNA was incubated in 12 μl buffer solution at 70°C for 10 min. The
reaction protocol was performed according to the manufacturer’s
instructions (reverse transcription kit, K1662, Fermentas, Canada),
and DNA was amplified by PCR. Reactions consisted of the following
constituents: RNA (1 μg), 62.5 nM RT primer mix (1 μl), DEPC water
(added to make the total volume to 20 μl), 5X reaction buffer (4
μl), 20 μg/μl RNase inhibitor (1 μl), 10 mM dNTP mix (2 μl) and
M-MuLv (1 μl), totaling 20 μl reaction volume. Reaction conditions
consisted of 42°C for 60 min, then 70°C for 5 min. Following
reverse transcription, reactions were prepared according to SYBR
Premix Ex Taq™ (DRRO41A, Takara, Japan) instructions. The following
reaction constituents were used: cDNA (2 μl), SYBR (10 μl), 10 μM
forward primer (0.4 μl), 10 μM reverse primer (0.4 μl), 50X ROX
(0.4 μl), ddH2O (6.8 μl), totaling 20 μl. Reaction
conditions were as follows: 95°C for 10 sec, then 95°C for 5 sec,
60°C for 30 sec, 95°C for 15 sec, 60°C for 15 sec and 95°C for 15
sec for a total of 40 cycles. Based on the results obtained, the
relative expression value F=2-ΔΔct was calculated (Δct1
= sample group average target gene ct value - average internal
reference gene value; Δct2 = control group average target gene ct
value - average internal reference gene value; ΔΔct =
Δct1 - Δct2).
Western blot verification of cyclin D1
and Met expression
Cells were harvested 72 h after transfection then
lysed with sodium dodecyl sulfate loading buffer solution. The
protein concentration of each sample was determined using the
Bradford method. Thirty micrograms of protein supernatant was
subjected to sodium dodecyl sulfate-polyacrylamide gel
electrophoresis and transferred onto nitrocellulose membranes.
Membranes were blocked for 1.5 h and incubated with mouse
anti-cyclin D1 antibody (1:1,000), mouse anti-Met antibody
(1:1,000), or mouse anti-α-tubulin antibody (1:10,000). All
membranes were incubated at 4°C overnight. Membranes were washed
three times with PBST then incubated for 1 h at room temperature in
anti-mouse secondary antibody (1:10,000). ECL chemiluminescence was
used to reveal proteins, and Bandscan software (Glyko, Novato, CA,
USA) was used to scan the gray value of western blot bands to
calculate the relative content of protein as follows: protein
relative content = gray value of protein bands/gray value of
α-tubulin bands.
MTT mapping cell growth curve
96-well plates were inoculated with 10,000 B16F10
cells per well. After 24 h, cells were transfected with plasmids
(five wells per group). MTT assays were performed 1 to 5 days after
transfection as follows: 20 μl MTT solution was added to each well
and cells were incubated for 4 h, then the supernatant was
carefully discarded to terminate the reaction. Next, 150 μl DMSO
was added to each well, and samples were oscillated for 10 min to
fully dissolve any crystals. Absorption was measured at 490 nm.
Apoptotic rate detected by flow
cytometry
Cells were harvested 24 h after transfection, then
centrifuged at 800 rpm for 5 min and supernatant was removed. The
cell suspension was then fixed in pre-cooled 10% (v/v) ethanol at
4°C for 24 h. The cell density was adjusted to 10,000 cells/ml and
fixed cells were treated with propidium iodide staining solution
for 30 min in the dark. Apoptosis was measured using a flow
cytometer.
Statistical analysis
Data were analyzed with SPSS 13.0 (SPSS, Chicago,
IL, USA). Experimental data were presented as means ± SD and the
paired t-test was used to show differences between each group.
P<0.05 was considered to indicate a statistically significant
difference.
Results
Transfection of plasmids or inhibitors
into B16F10 cells
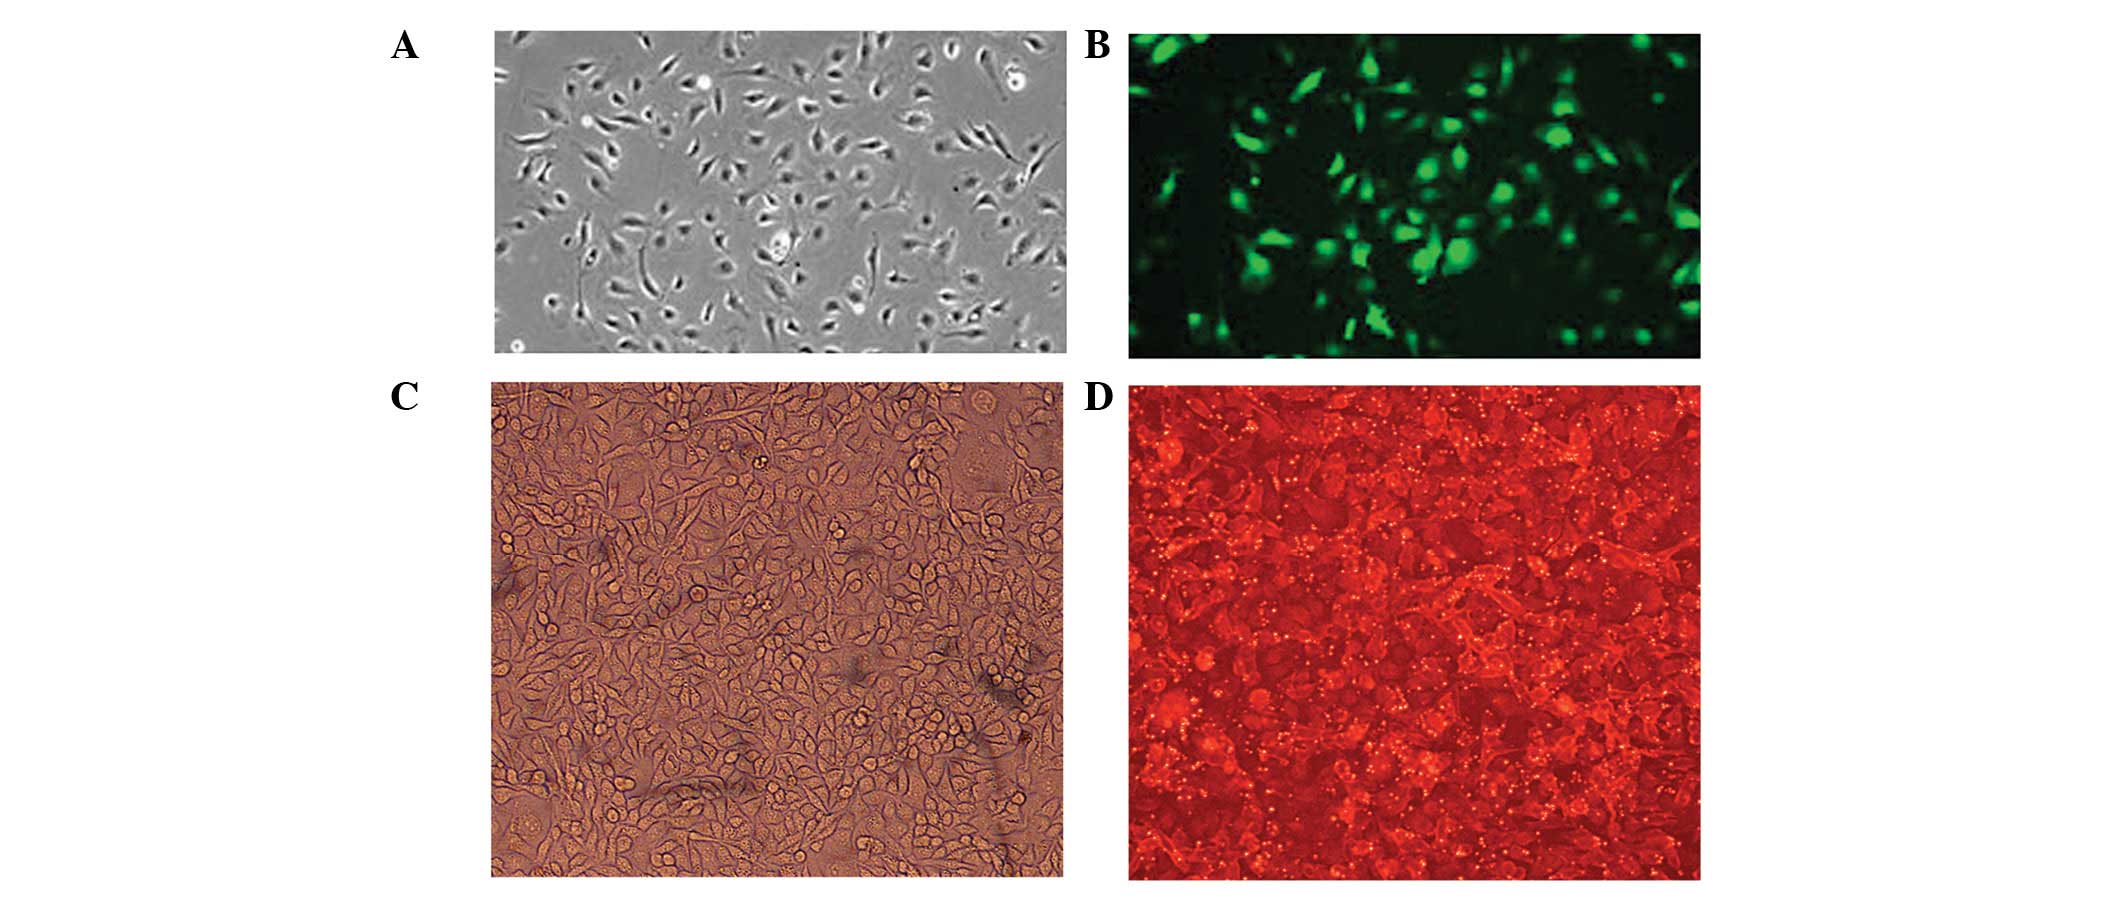
At 24 h after transfection, B16F10 cells were
examined by fluorescence microscopy to ensure successful uptake of
plasmids or inhibitors. Green fluorescent cells were observed in
the empty plasmid, let-7b plasmid and microRNA-199a plasmid groups
(Fig. 1A and B), and red
fluorescent cells were observed in the let-7b inhibitor,
microRNA-199a inhibitor and inhibitor control groups (Fig. 1C and D). In turn, no green
fluorescent cells were observed in the control group. Plasmids were
tagged with green fluorescent protein (GFP), and inhibitor
fragments were labeled with cyanine (Cy) 3.
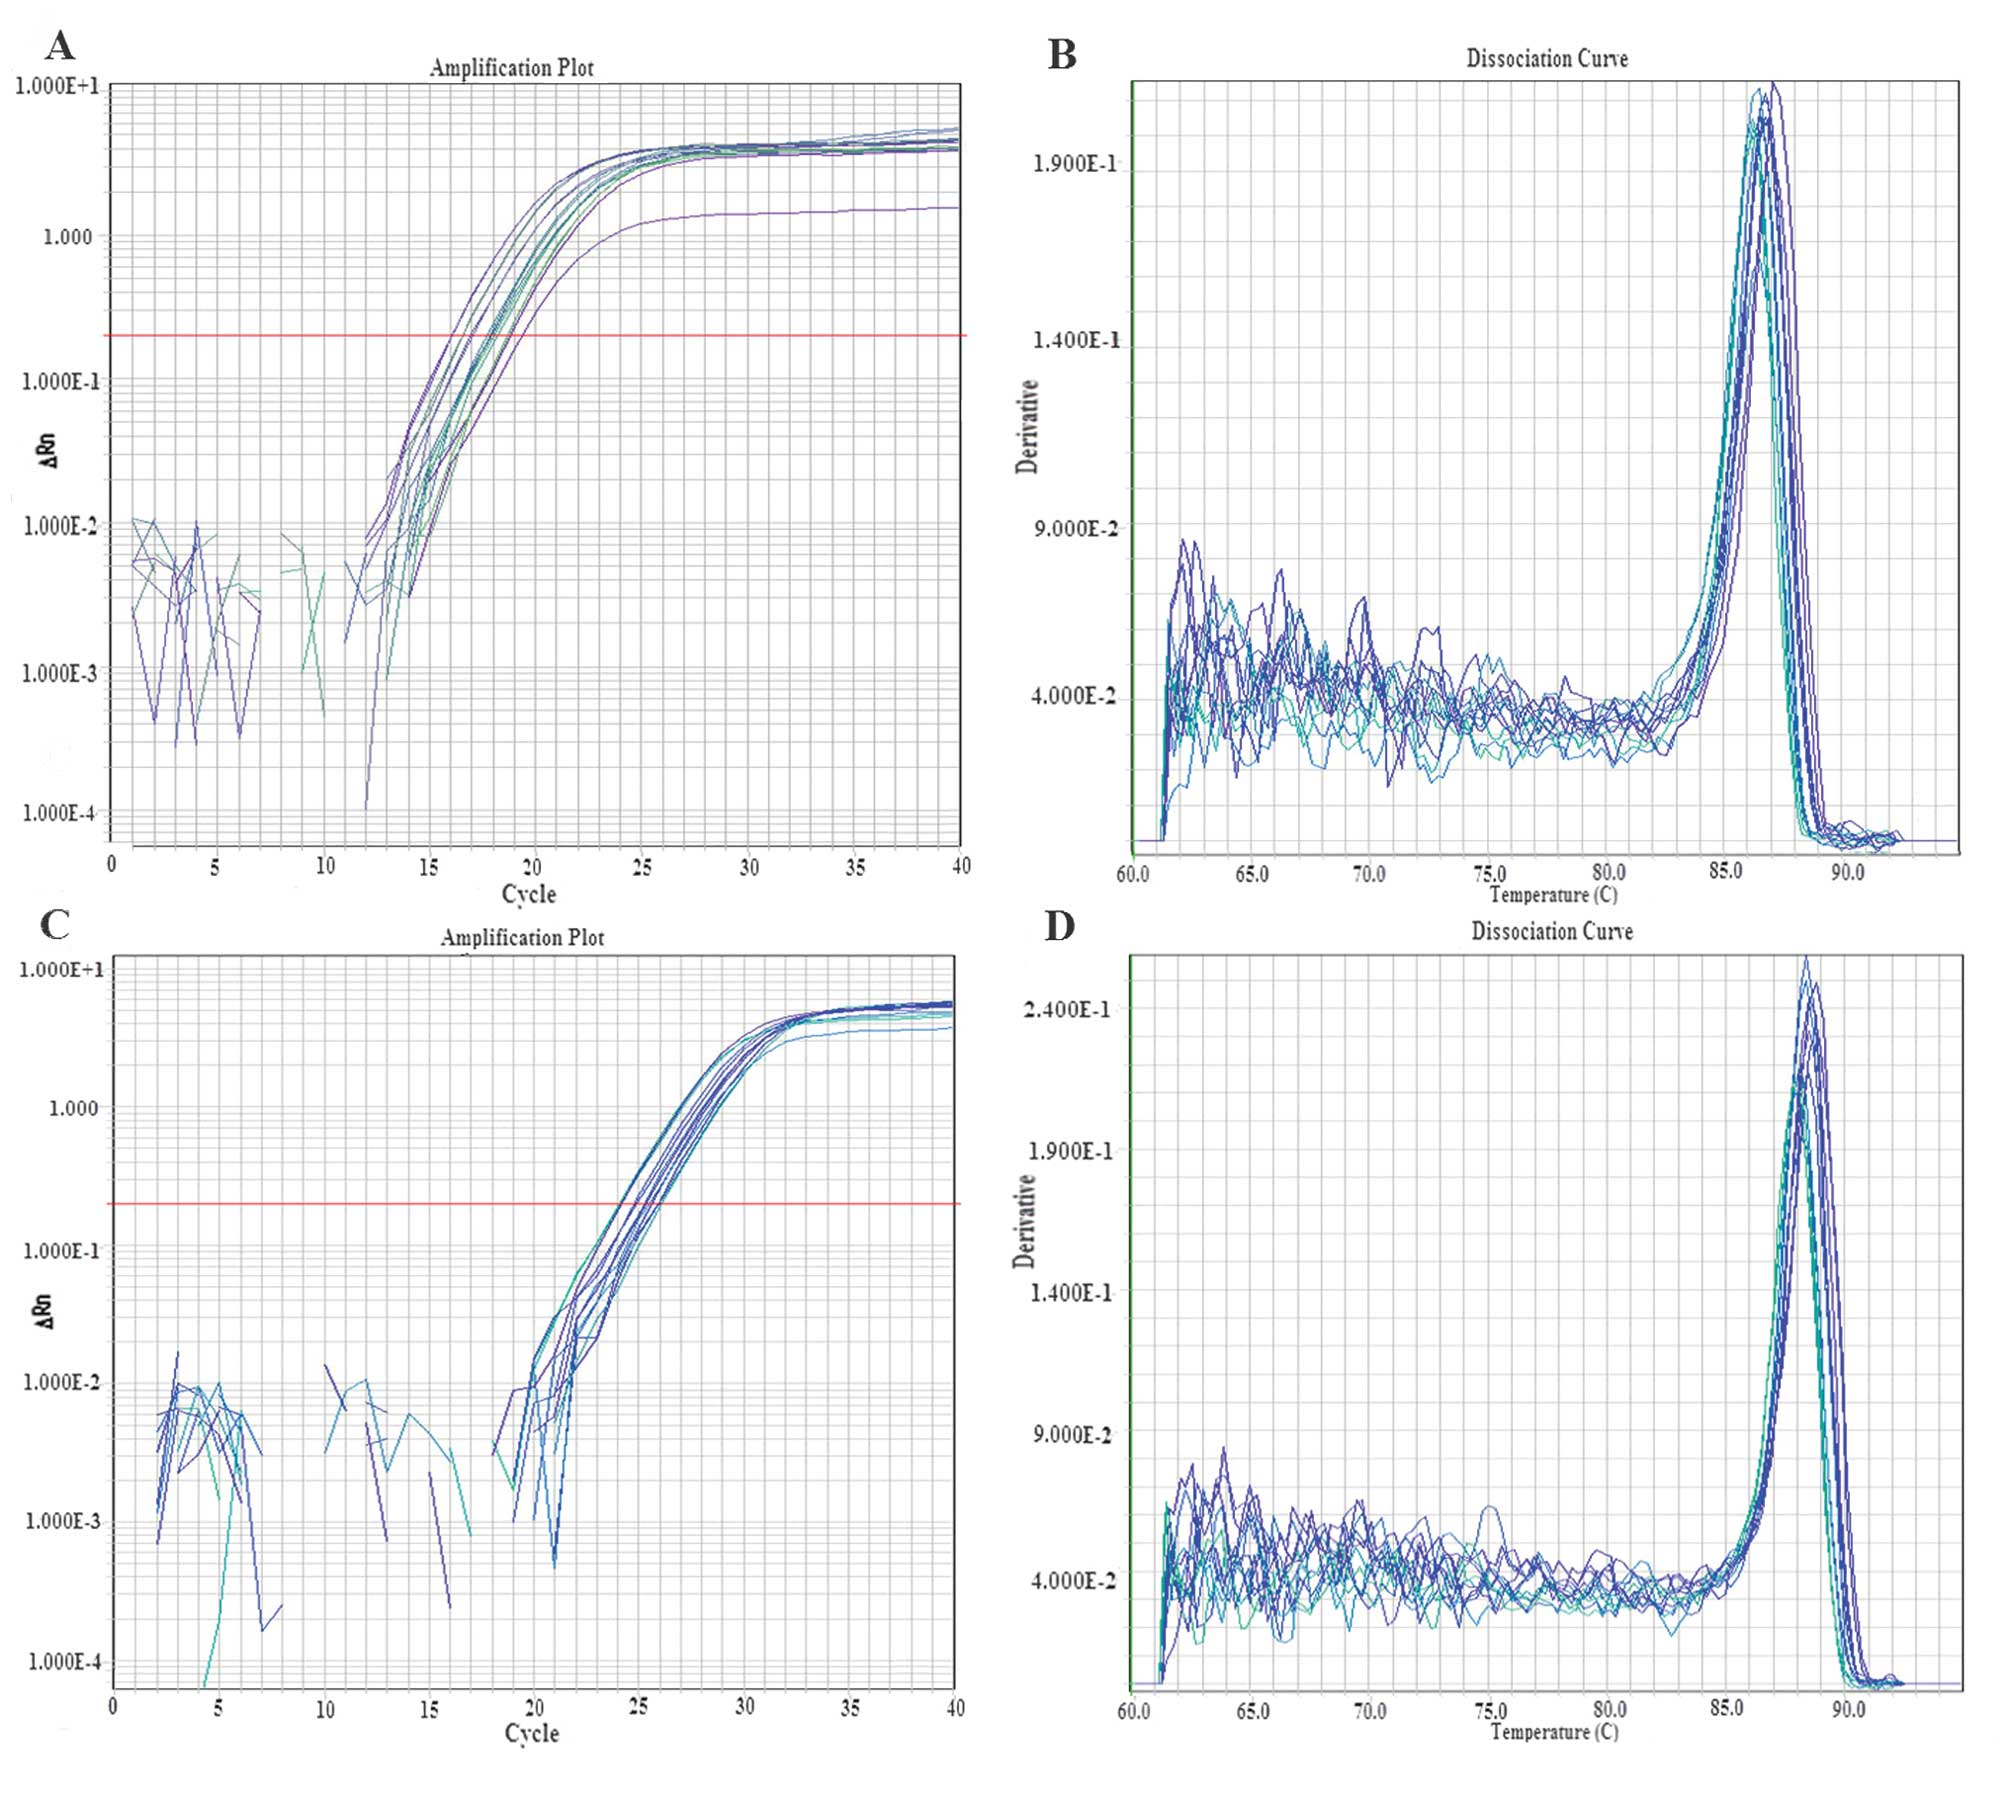
Real-time PCR verification of let-7b and
microRNA-199a gene expression Let-7b gene expression
Compared with the control group, the relative gene
expression of the let-7b plasmid group (3.8776±0.1372) was
significantly higher (t=29.651, P<0.05), and the relative
expression of the let-7b inhibitor group (0.2057±0.0263) was
significantly lower (t=42.704, P<0.05). However, there were no
significant differences between the empty plasmid group
(1.1400±0.2769) and the inhibitor control group (0.9760±0.2300)
(P>0.05; Fig. 2A and B).
microRNA-199a gene expression
Compared with the control group, the relative
expression of the microRNA-199a plasmid group (2.8660±0.2821) was
significantly higher (t=13.656, P<0.05), while the relative
expression of the microRNA-199a inhibitor group (0.2656±0.0253) was
significantly lower (t= 41.028, P<0.05). However, there were no
significant differences between the empty plasmid group
(0.9809±0.1703) and the inhibitor control group (0.7512±0.0690)
(P>0.05; Fig. 2C and D).
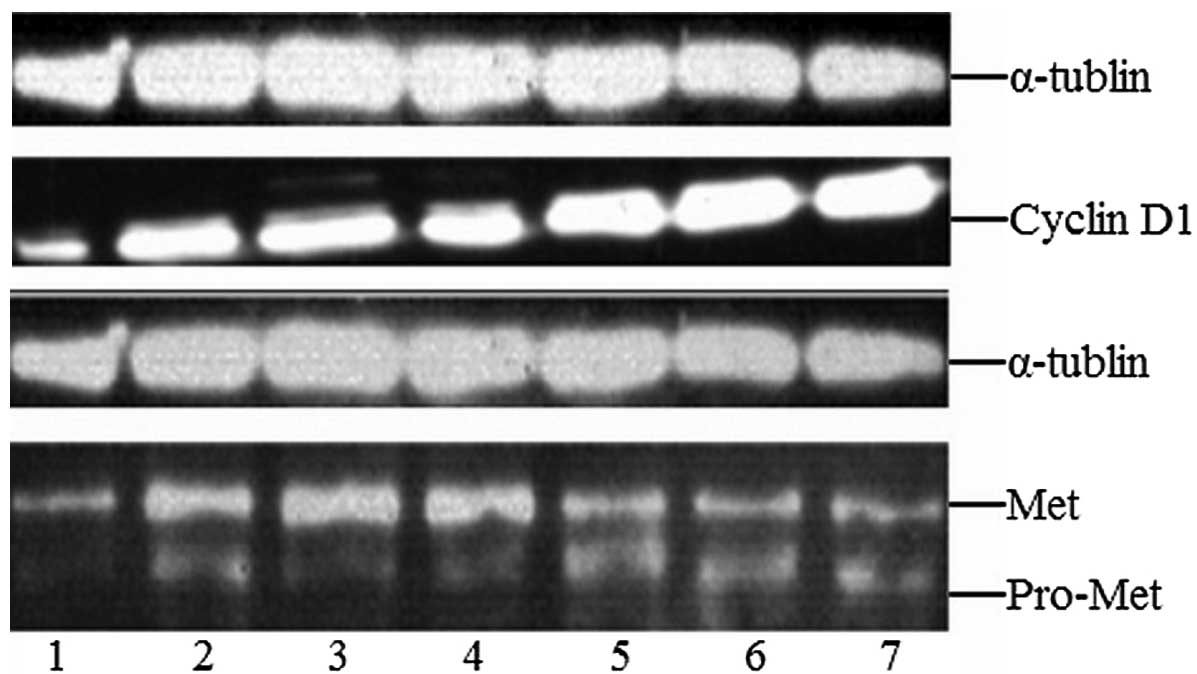
Western-blot detection of cyclin D1 and
Met expression Cyclin D1 protein expression
Compared with the control group (0.997±0.041), the
relative expression of cyclin D1 in the let-7b plasmid group
(2.023±0.315), the microRNA-199a plasmid group (1.763±0.172), the
empty plasmid group (1.490±0.292), the let-7b inhibitor group
(1.857±0.377), the microRNA-199a inhibitor group (1.590±0.286) and
the inhibitor control group (1.443±0.099) was higher. However, in
the let-7b plasmid and let-7b inhibitor groups the relative
expression of cyclin D1 was significantly increased (t≥13.733,
P<0.05), and between other groups there were no significant
differences (P>0.05; Fig.
3).
Met protein expression
Compared with the control group (2.2±0.198), the
expression of Met in the let-7b plasmid group (3.24±0.340), the
microRNA-199a plasmid group (5.19±0.309), the empty plasmid group
(2.85±0.047), the let-7b inhibitor group (2.49±0.068), the
microRNA-199a inhibitor group (4.87±0.044) and the inhibitor
control group (2.73±0.033) was higher. However, in the
microRNA-199a plasmid and microRNA-199a inhibitor groups the
relative expression of Met was significantly increased (t≥17.905,
P<0.05), and between other groups, there were no statistically
significant differences (P>0.05; Fig. 3).
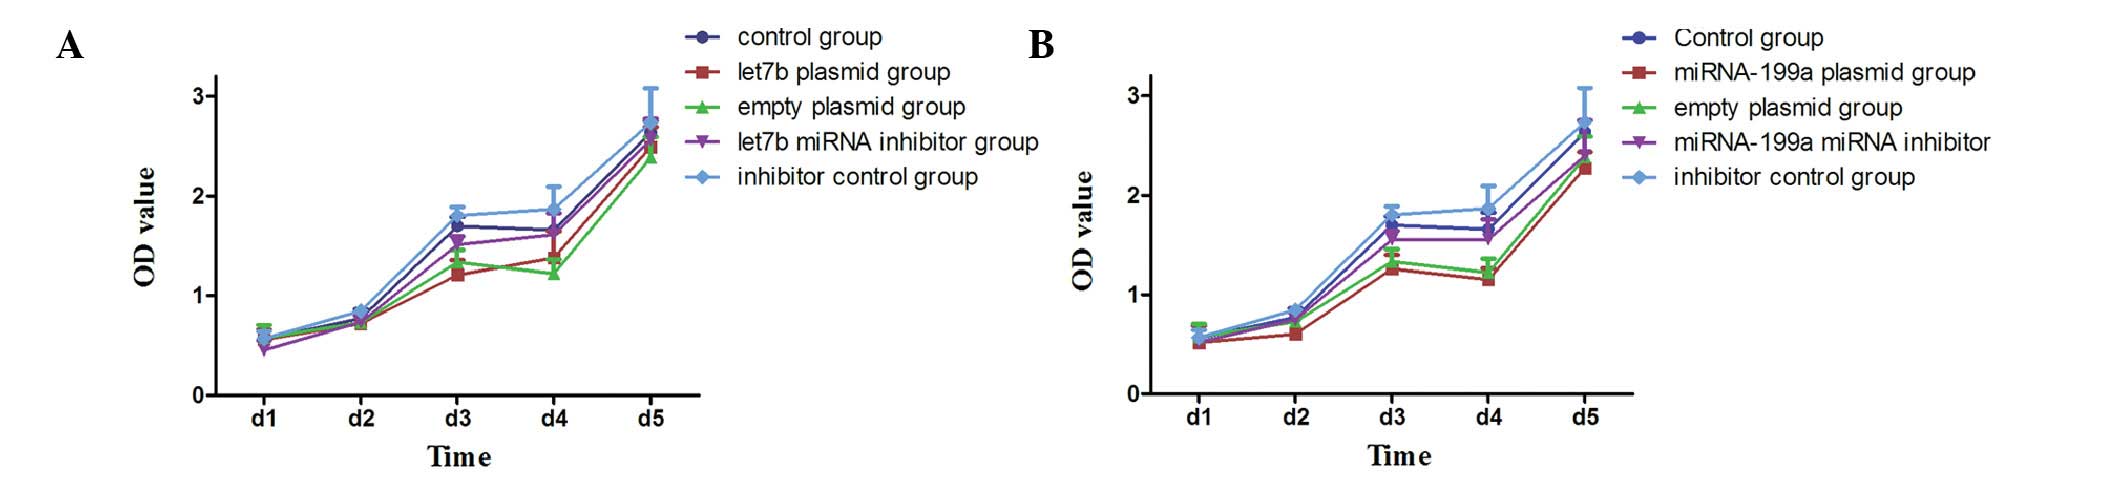
Cell proliferation rate
B16F10 cells were treated with the different
plasmids or inhibitors, and 1–5 days after transfection absorption
values were measured, as described in Materials and methods
(Fig. 4).
Compared with the control group, the proliferation
rate of B16F10 cells transfected with let-7b or microRNA-199a was
lower, and on the third day after transfection, the rate reached
the lowest value (P<0.05). The rate was not significantly
different in the empty plasmid, let-7b inhibitor, microRNA-199a
inhibitor and inhibitor control groups (P>0.05).
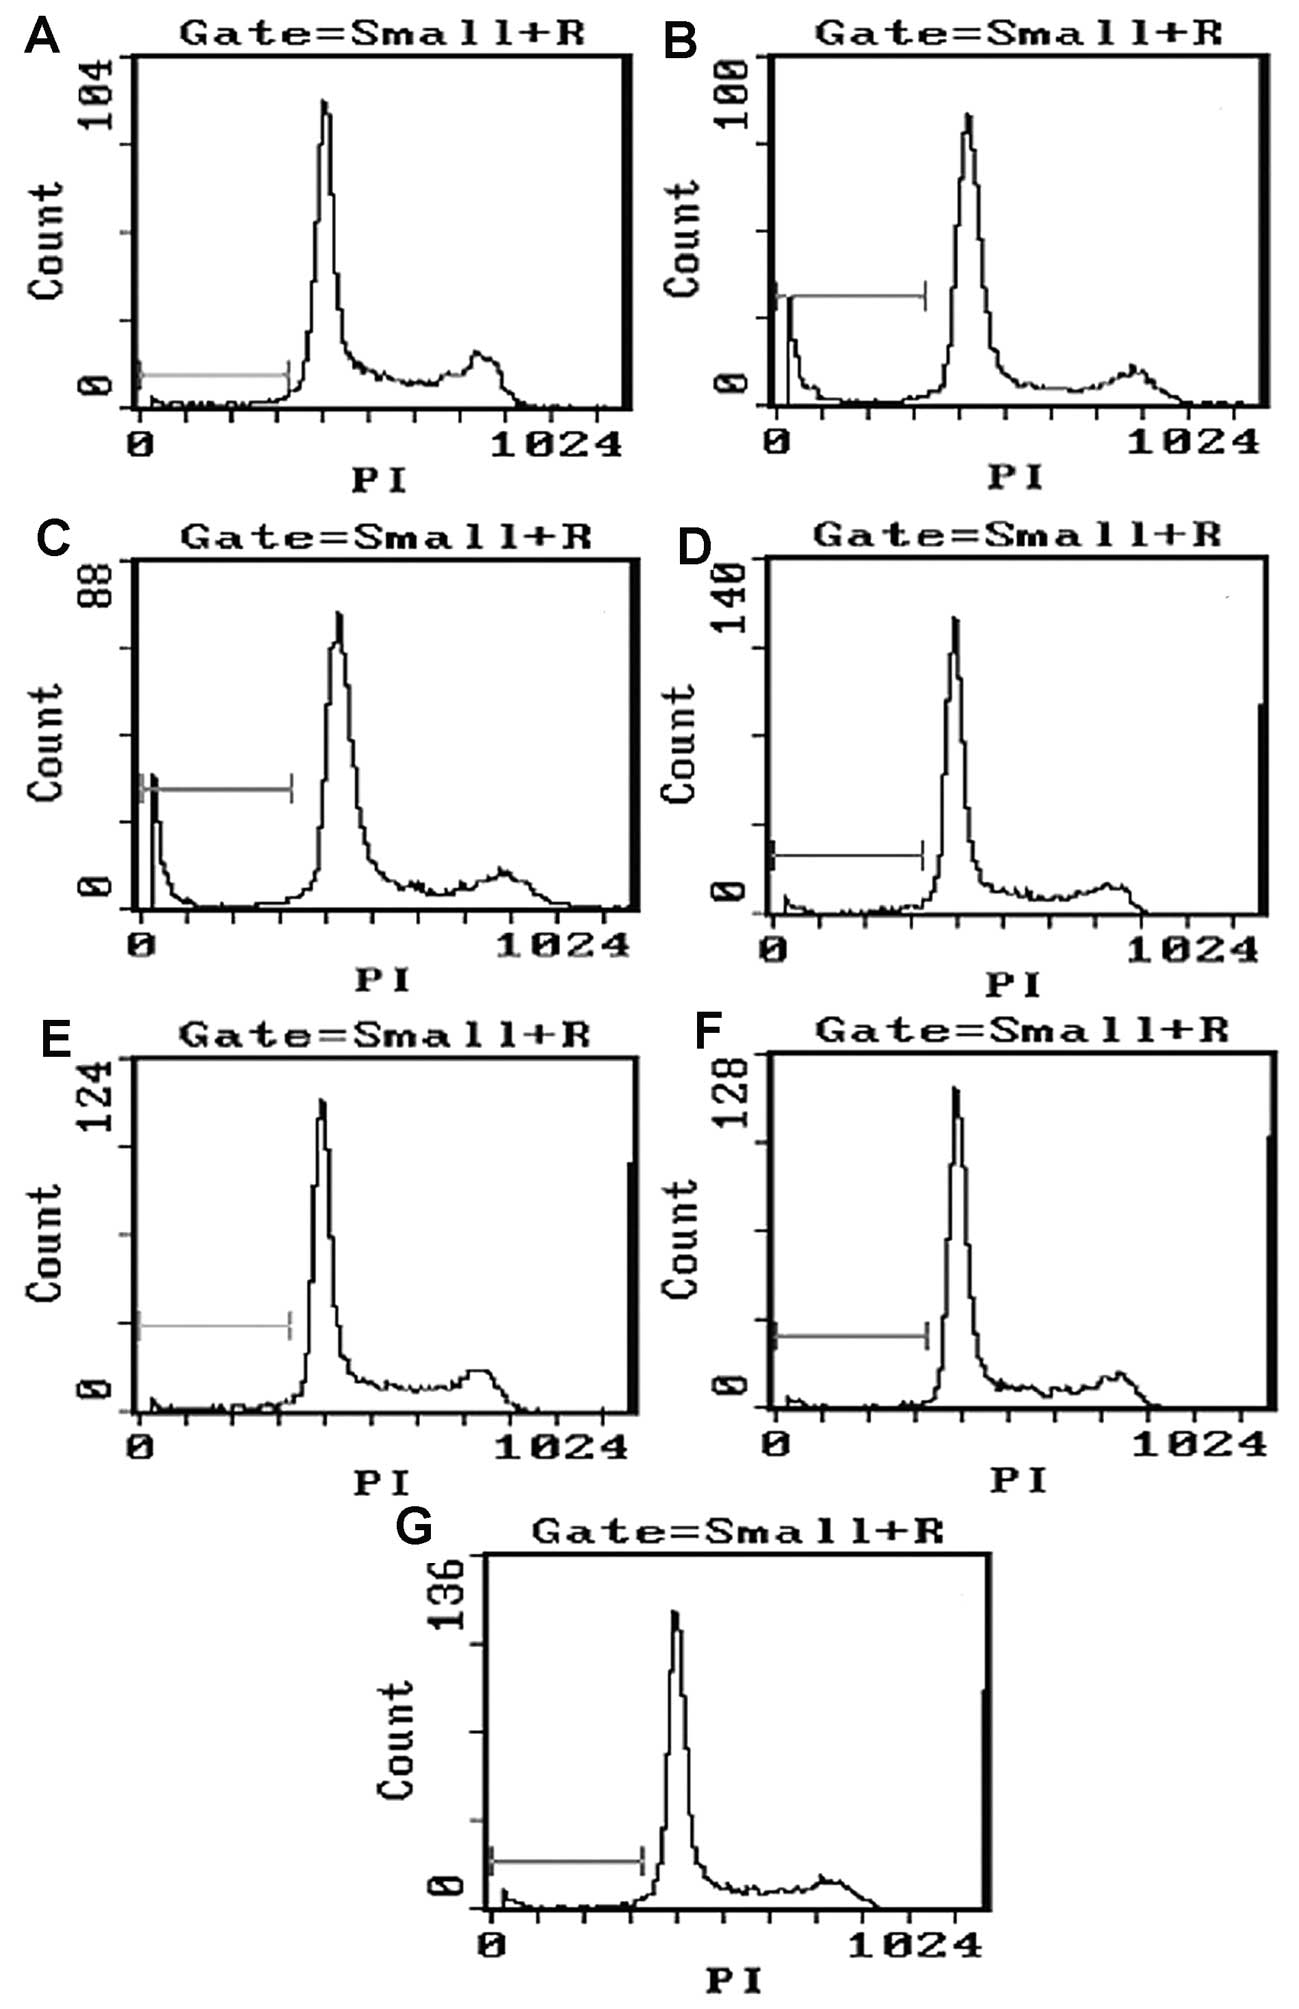
Apoptotic rate detected by flow
cytometry
Compared with the control group (5.77±1.74%), the
apoptotic rate of the let-7b plasmid group (11.8±1.19%) and the
microRNA-199a plasmid group (11.3±1.59%) was significantly higher
(t≥36.867, P<0.05). However, no significant differences were
found in apoptotic rates between the empty plasmid group
(6.75±1.59%), the let-7b inhibitor group (4.39±1.52%), the
microRNA-199a inhibitor group (4.97±1.47%), the inhibitor control
group (6.68±1.71%) and the control group (P>0.05; Fig. 5).
Discussion
Very little is known about microRNA expression
patterns in melanoma. Our previous studies have shown that in
meta-static skin melanoma 47 microRNAs showed a two-fold or greater
reduction in expression, while 6 microRNAs exhibited a two-fold or
greater increase in expression, including let-7b, microRNA-199a,
microRNA-33, microRNA-193b, microRNA-22 and microRNA-222.
Quantitative polymerase chain reaction (qPCR) of tumor samples
revealed that let-7b, microRNA-199a, microRNA-33 and clinical
transfer index (age, survival time, metastasis and death resulting
from metastasis) are positively correlated (12). It has been reported that microRNA
signatures differentiate melanoma subtypes; seven microRNAs
(microRNA-142-3p, microRNA-486, microRNA-214, microRNA-218,
microRNA-362, microRNA-650 and microRNA-31) significantly
correlated with acral melanoma compared to non-acral melanoma
(15). Furthermore, let-7b and
microRNA-199a were upregulated in uveal (ocular) melanoma, showing
highly significant associations with the high metastatic gene
expression signature and loss of chromosome 3, which have been
shown to be more accurate predictors of metastasis than any
clinical or pathological factors, and have served as surrogate
endpoints for the identification of biomarkers in uveal melanoma
(16–18). Similar findings have been found in
both skin melanoma and uveal (ocular) melanoma, but it is unclear
as to whether this finding is coincidental or whether it is an
important indicator of metastasis.
Let-7b and microRNA-199a are involved in ovarian
carcinogenesis and are associated with the prognosis of serous
ovarian carcinoma; lower let-7b and microRNA-199a expression is
correlated with worse prognosis (13). Let-7b is significantly downregulated
in acute lymphoblastic leukemia compared with acute myeloid
leukemia (19).
microRNA regulates the expression of genes at the
post-transcriptional level, which can directly regulate oncogene
and/or tumor suppressor gene expression, and is also associated
with the cyclin kinases to regulate the cell cycle. For example,
let-7b negatively regulates the expression of Ras (20). In vitro overexpression of
let-7b in melanoma cells downregulated the expression of cyclins
D1, D3, A and cyclin-dependent kinase (Cdk) 4 (21). Let-7b overexpression leads to an
increased fraction of cells in G2/M, direct downregulation of
Cdc34, and stabilization of Wee-1 kinase in primary human
fibroblasts (22). microRNAs may
also desensitize stem cells to external signals, leading to cell
cycle arrest in G1/S transition (23,24).
In this study, we investigated the effect of let-7b
and microRNA-199a overexpression and inhibition on a melanoma cell
line. We found that the expression of let-7b and microRNA-199a
unexpectedly contrasted with the corresponding protein expression,
suggesting that other mechanisms may be involved aside from
microRNAs. microRNAs generally negatively control gene function;
however, when an internal environmental factor changes they may
switch to positively regulating gene function. Our study suggests
that inhibitors of let-7b and microRNA-199a genes caused these
microRNAs to perform opposing functions in melanoma cells.
microRNAs can act upon different target mRNAs. For example, let-7b
controls CDC25A, CCND1, PLXND1, basigin expression (25), and also controls tumor suppressor
genes such as RB1 and DLC1. In B16F10 cells, let-7b and
microRNA-199a are expressed at different levels than in normal
cells, and have different target genes, regulating cyclin D1 or
acting as the inhibitory factor of Met protein deactivation to
elevate the expression of cyclin D1 or Met protein. The genes
regulating the expression of proteins are different, but these
genes may act as a network so that when the intracellular
equilibrium is altered to affect the expression of a signaling
protein this affects the expression of another factor, and thus
indirectly controls protein expression. microRNA-193b represses
cell proliferation and regulates cyclin D1 in melanoma (26), while microRNA-34b, microRNA-34c and
microRNA-199a have been shown to negatively regulate MET expression
(27). Notably, microRNA-199a is
downstream of ERK2 (28). While we
have not determined the microRNA target genes in this study, our
results demonstrate the existence of networks between
microRNAs.
This study also explored the effect of let-7b and
microRNA-199a at the cellular level using B16F10 cells.
Overexpression of let-7b and microRNA-199a significantly decreased
cell proliferation and increased apoptosis, suggesting that let-7b
and microRNA-199a may be negative regulators of B16F10 cells.
microRNAs are of high interest in cancer research
but are difficult to investigate (29). In this study, we investigated the
effect of let-7b and microRNA-199a on melanoma proliferation at the
microRNA level, providing new scientific evidence and ideas for
clinical diagnosis and treatment. However, the mechanism of
microRNA regulation of mRNA and its clinical applicability requires
further study.
Acknowledgements
This research was supported by the
National Natural Science Foundation of China (nos. 81071645,
81171882 and 30672035), and the National Natural Science Foundation
of Hunan Province (nos. 11JJ6085 and 10JJ3030). The authors thank
the Chinese State Key Laboratory of Medical Genetics for providing
the experiment technology and equipment support, and Xia Jiahui for
experimental design advice and technical guidance.
References
|
1.
|
Y XuJ ZhouC LuoQ HeX NieY ZhaoP PokharelS
WangD XuMelanoma clinical characteristics in ChinaActa Laser
Biology Sinica167927942007
|
|
2.
|
DS RigelTrends in dermatology: melanoma
incidenceArch
Dermatol146318201010.1001/archdermatol.2009.37920231504
|
|
3.
|
B SchwartzO ShoseyovVO MelnikovaM McCartyM
LeslieL RoizP SmirnoffGF HuD LevM Bar-EliACTIBIND, a T2 RNase,
competes with angiogenin and inhibits human melanoma growth,
angiogenesis, and metastasisCancer
Res6752585266200710.1158/0008-5472.CAN-07-012917545605
|
|
4.
|
L HeGJ HannonMicroRNAs: small RNAs with a
big role in gene regulationNat Rev
Genet5522531200410.1038/nrg137915211354
|
|
5.
|
AB ShyuMF WilkinsonA van HoofMessenger RNA
regulation: to translate or to degradeEMBO
J27471481200810.1038/sj.emboj.760197718256698
|
|
6.
|
LA NeelyS PatelJ GarverM GalloM HackettS
McLaughlinM NadelJ HarrisS GullansJ RookeA single-molecule method
for the quantitation of microRNA gene expressionNat
Methods34146200610.1038/nmeth82516369552
|
|
7.
|
E BerezikovE CuppenRH PlaterkApproaches to
microRNA discoveryNat Genet38S2S7200610.1038/ng1794
|
|
8.
|
JL ClancyM NouschDT HumphreysBJ WestmanTH
BeiharzT PreissMethods to analyze microRNA-mediated control of mRNA
translationMethods
Enzymol43183111200710.1016/S0076-6879(07)31006-917923232
|
|
9.
|
S HatfieldH Ruohola-BakerMicroRNA and stem
cell functionCell Tissue
Res3315766200810.1007/s00441-007-0530-3
|
|
10.
|
A GiannakakisG CoukosA HatzigeorgiouR
SandaltzopoulosL ZhangmiRNA genetic alterations in human
cancersExpert Opin Biol
Ther713751386200710.1517/14712598.7.9.137517727327
|
|
11.
|
TE CallisJF ChenDZ WangMicroRNAs in
skeletal and cardiac muscle developmentDNA Cell
Biol26219225200710.1089/dna.2006.055617465888
|
|
12.
|
J ZhouJ TanH XieY WangW LiS ZhongPrimary
cutaneous melanoma of microRNA gene chipsJournal of Chinese
physician134054062010
|
|
13.
|
EJ NamH YoonSW KimH KimYT KimJH KimJW KimS
KimMicroRNA expression profiles in serous ovarian carcinomaClin
Cancer Res1426902695200810.1158/1078-0432.CCR-07-173118451233
|
|
14.
|
NH HeegaardAJ SchetterJA WelshM YonedaED
BowmanCC HarrisCirculating microRNA expression profiles in early
stage non-small cell lung cancerInt J CancerMay4doi:
10.1002/ijc.261532011
|
|
15.
|
E ChanR PatelS NallurE RatnerA
BacchiocchiK HoytS SzpakowskiS GodshalkS AriyanM SznolR HalabanM
KrauthammerD TuckFJ SlackJB WeidhaasMicroRNA signatures
differentiate melanoma subtypesCell
Cycle1018451852201110.4161/cc.10.11.1577721543894
|
|
16.
|
LA WorleyMD OnkenE PersonD RobirdsJ
BransonDH CharA PerryJW HarbourTranscriptomic versus chromosomal
prognostic markers and clinical outcome in uveal melanomaClin
Cancer Res1314661471200710.1158/1078-0432.CCR-06-240117332290
|
|
17.
|
MD OnkenLA WorleyE PersonDH CharAM
BowcockJW HarbourLoss of heterozygosity of chromosome 3 detected
with single nucleotide polymorphisms is superior to monosomy 3 for
predicting metastasis in uveal melanomaClin Cancer
Res1329232927200710.1158/1078-0432.CCR-06-238317504992
|
|
18.
|
LA WorleyMD LongMD OnkenJW
HarbourMicro-RNAs associated with metastasis in uveal melanoma
identified by multiplexed microarray profilingMelanoma
Res18184190200810.1097/CMR.0b013e3282feeac618477892
|
|
19.
|
S MiJ LuM SunZ LiH ZhangMB NeillyY WangZ
QianJ JinY ZhangSK BohlanderMM Le BeauRA LarsonTR GolubJD RowleyJ
ChenMicroRNA expression signatures accurately discriminate acute
lymphoblastic leukemia from acute myeloid leukemiaProc Natl Acad
Sci USA1041997119976200710.1073/pnas.070931310418056805
|
|
20.
|
GA CalinC SevignaniCD DumitruT HyslopE
NochS YendamuriM ShimizuS RattanF BullrichM NegriniCM CroceHuman
microRNA genes are frequently located at fragile sites and genomic
regions involved in cancersProc Natl Acad Sci
USA10129993004200410.1073/pnas.030732310114973191
|
|
21.
|
J SchultzP LorenzG GrossS IbrahimM
KunzMicroRNA let-7b targets important cell cycle molecules in
malignant melanoma cells and interferes with anchorage-independent
growthCell Res18549557200810.1038/cr.2008.4518379589
|
|
22.
|
A Legesse-MillerO ElementoS PfauJJ FormanS
TavazoieHA Collerlet-7 Overexpression leads to an increased
fraction of cells in G2/M, direct down-regulation of Cdc34, and
stabilization of Wee1 kinase in primary fibroblastsJ Biol
Chem28466056609200910.1074/jbc.C90000220019126550
|
|
23.
|
SD HatfieldHR ShcherbataKA FischerK
NakaharaRW CarthewH Ruohola-BakerStem cell division is regulated by
the microRNA
pathwayNature435974978200510.1038/nature0381615944714
|
|
24.
|
X KarpV AmbrosEnhanced: encountering
microRNAs in cell fate
signalingScience31012881289200510.1126/science.112156616311325
|
|
25.
|
TY FuCC ChangCT LinCH LaiSY PengYJ KoPC
TangLet-7b-mediated suppression of basigin expression and
metastasis in mouse melanoma cellsExp Cell
Res317445451201110.1016/j.yexcr.2010.11.00421087605
|
|
26.
|
J ChenHE FeilotterGC ParéX ZhangJG
PembertonC GaradyD LaiX YangVA TronMicroRNA-193b represses cell
proliferation and regulates cyclin D1 in melanomaAm J
Pathol17625202529201010.2353/ajpath.2010.09106120304954
|
|
27.
|
C MiglioreA PetrelliE GhisoS CorsoL
CapparucciaA EramoPM ComoglioS GiordanoMicroRNAs impair
MET-mediated invasive growthCancer
Res681012810136200810.1158/0008-5472.CAN-08-214819074879
|
|
28.
|
S KimUJ LeeMN KimEJ LeeJY KimMY LeeS
ChoungYJ KimYC ChoiMicroRNA miR-199a* regulates the MET
proto-oncogene and the downstream extracellular signal-regulated
kinase 2 (ERK2)J Biol Chem28318158181662008
|
|
29.
|
M OsakiF TakeshitaT OchiyaMicroRNAs as
biomarkers and therapeutic drugs in human
cancerBiomarkers13658670200810.1080/1354750080264657219096960
|