Introduction
Breast cancer (BC) is one of the most common causes
of mortality among females, accounting for 23% of total cancer
cases and 14% of cancer mortality around the world (WHO, 2010).
Lately, the number of BC fatalities has increased approximately to
40,000 annually in Mexico (http://www.sinais.salud.gob.mx/estadisticasportema.html).
In human cancer, oncogenes such as her-2 have been
identified and used as molecular markers. her-2 is one of
the most frequently studied BC genes due to its overexpression
observed in 20–30% of aggressive cases. High levels of her-2
have also been found in several ovarian and endometrial tumors
(1). Clinical studies have shown
that her-2 gene upregulation and Her-2 protein
overproduction predicts poor prognosis in BC patients lacking
estrogen and progesterone receptors, inducing a high rate of cell
proliferation and tumor chemotherapy resistance (2,3). The
discovery of her-2 gene overexpression in BC tissues and its
association with aggressive clinical behavior has generated
diagnostic interest by using her-2 gene expression as a
predictive marker for herceptin treatment response (1–3).
Immunohistochemistry (IHC) is the first methodology selected for
Her-2 protein evaluation since it is the most economical; however,
it is not the most precise. Females with an IHC score 3+ are
candidates for the costly herceptin treatment. Samples with IHC
score of 2+ are considered as inconclusive and a second evaluation
with fluorescent in situ hybridization (FISH) methodology is
required. FISH analysis is frequently omitted due to its high cost,
the time-consuming methods involved and the shortage of specialized
laboratories in which to perform it. The lack of a rapid, precise
and economical her-2/Her-2 diagnostic test makes it
necessary to implement alternative methodologies that have a lower
cost, are less time-consuming and are more precise. In this study
we standardize a quantitative polymerase chain reaction (qPCR)
methodology that satisfies all premises mentioned before; being
less expensive and less time-consuming than FISH and more precise
than IHC.
Materials and methods
Tissue sample preparation and DNA biopsy
extraction
Twenty-six biopsies of BC tissue fixed in
formaldehyde and embedded in paraffin were previously analyzed by
IHC. Eight of these samples were evaluated as IHC 3+, fifteen were
evaluated as IHC 2+ and three of them were negative for Her-2 using
the same methodology. All samples came from a private laboratory of
clinical pathology in Ensenada (Baja California, Mexico). Biopsies
were collected between 2004 and 2008 and stored at room
temperature. Block samples were cut into 10-μm-thick sections and
transferred into a sterile 1.7-ml tube. Paraffin was removed twice
using 1 ml xylene for a 10 min incubation period and washed using 1
ml absolute ethanol, 1 ml 90% ethanol and 1 ml 70% ethanol,
followed by 1 ml TE buffer. Tissues were pelleted following each
step by centrifugation at 8,000 x g for 5 min. Final pellets were
treated with 390 μl lysis buffer [150 mM NaCl, 15 mM EDTA, 60 mM
Tris, (pH 8.0)], 50 μl 10% SDS, 25 μl lysozyme at 10 mg/ml, 10 μl
RNase at 10 mg/ml and incubated at 37°C for 30 min. Proteinase K
digestion was carried out overnight out using 1 mg/ml of the enzyme
at 37°C (4). Chromosomal DNA was
extracted by the standard protocol of phenol/chloroform/isoamyl
alcohol and stored at −20°C until use. Quantification of DNA
molecules extracted from paraffin-embedded tissue samples was
estimated by spectrophotometer at 260 nm (5).
The study was approved by the ethics committee of
the Center for Scientific Research and Education (CICESE),
Ensenada, Baja California, Mexico.
Control curve standardization
PCR products from her-2 (103 bp) and winged
helix nude (whn; 93 bp) control gene were obtained using
fresh placental-extracted DNA and her-2-F, 5′-AAC TGG TGT ATG CAG
ATT GC-3′ and her-2-R, 5′-AGC AAG AGT CCC CAT CCT A-3′; whn-F,
5′-GGT GGA ATG ACC GAA GCT AT-3′ and whn-R, 5′-GTC CTT CTG TGG CTC
AAT CT-3′; primers previously published (6,7). PCR
products were cloned using a pGEM vector (Promega®;
Madison, WI, USA) and positive clones were grown in LB broth medium
with 50 μg/ml ampicillin. Plasmid DNA was purified using
Qiagen® miniprep kit (Hilden, Germany) and its
concentration was measured by spectrophotometry assuming 1 OD at
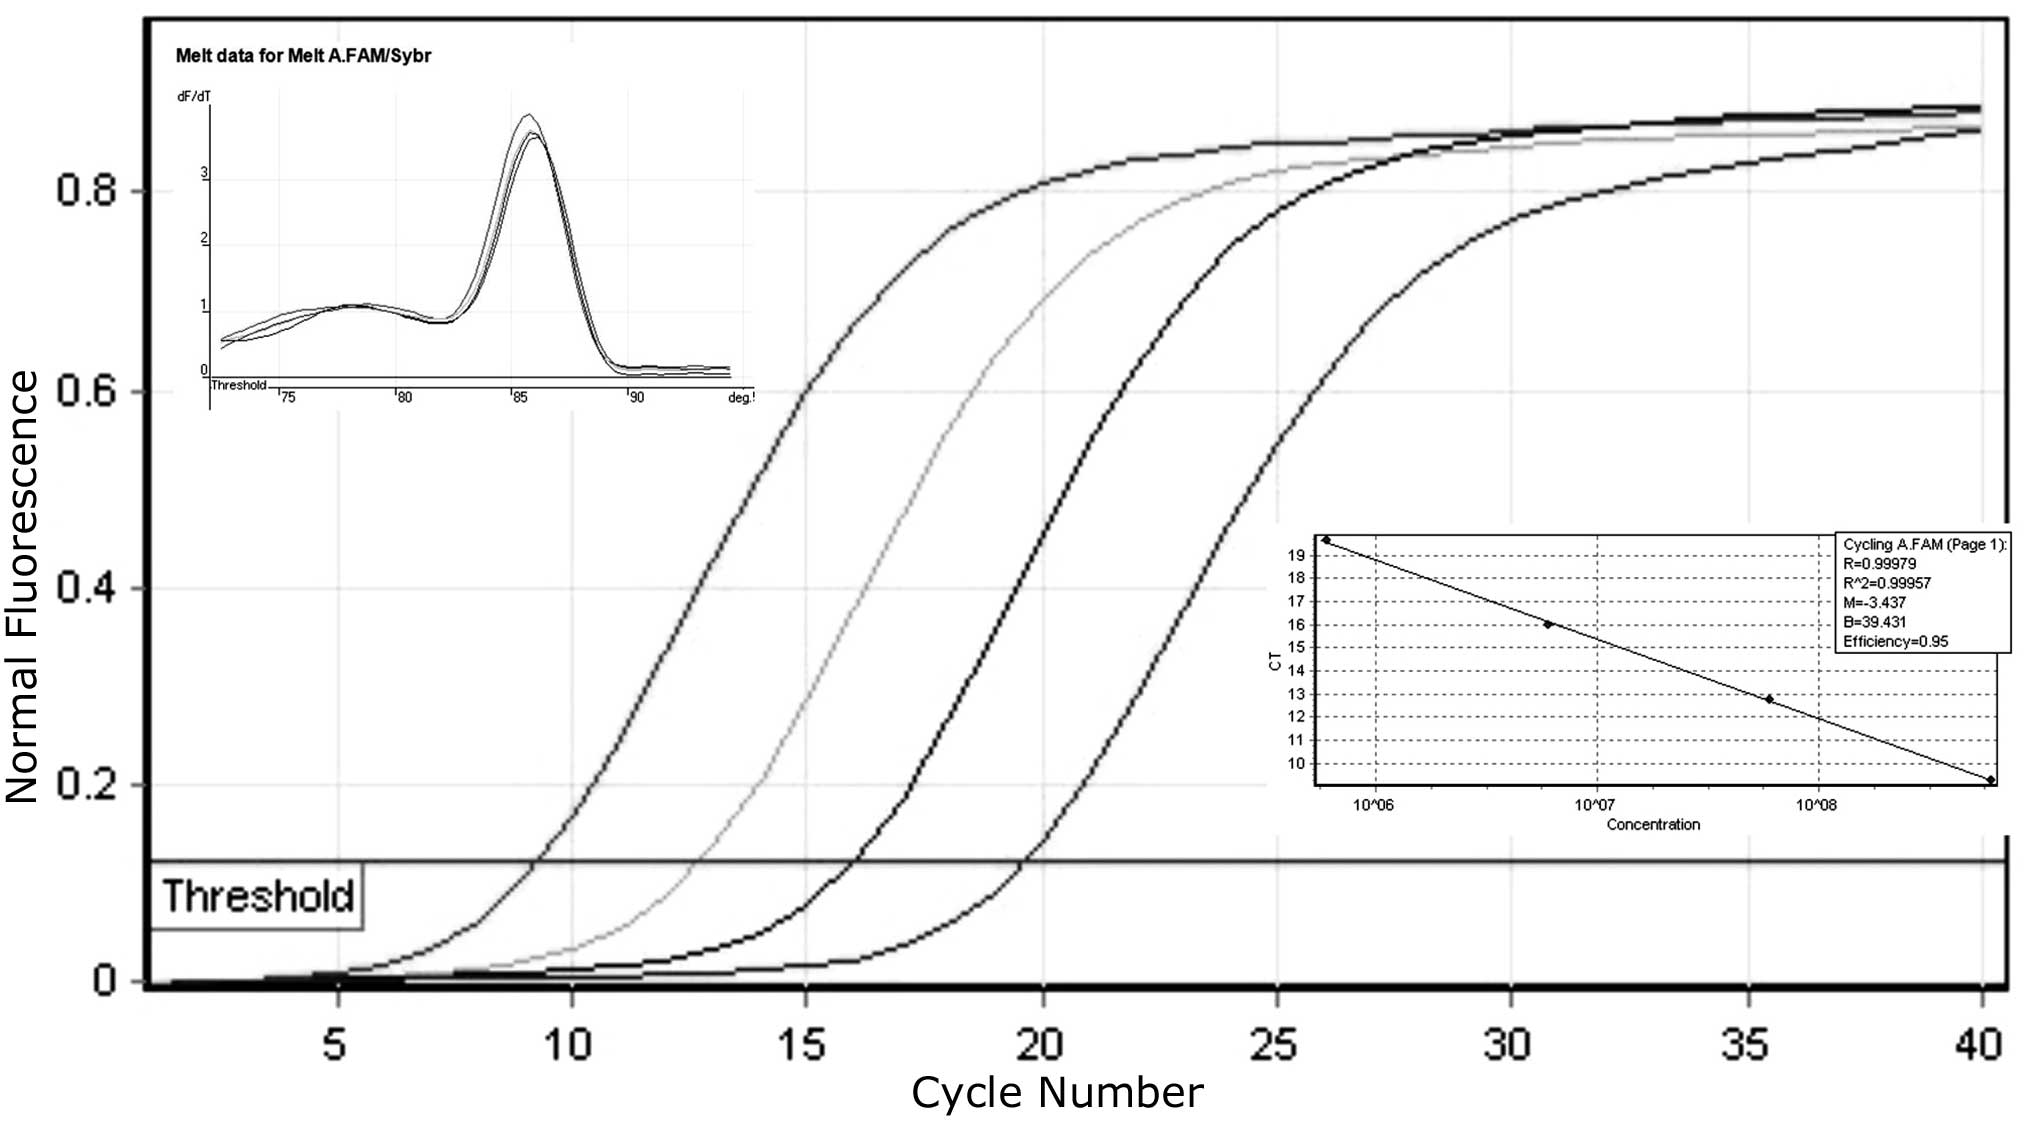
260 nm = 50 μg/ml DNA (5). Serial
dilutions from 1010-105 molecules were
prepared. Dilutions were used as plasmid copy number standards to
generate a control curve and to quantify paraffin extracted
her-2 chromosomal DNA copies (Fig. 1). General formula used: (6.02 ×
1023 copies/mol) x (concentration in g/μl) / (MW in
g/mol) = copies/μl.
qPCR experimental conditions
Primers were obtained from Allele Biotech (San
Diego, CA, USA). For amplification and data collection we used the
Rotor-Gene 2000 real time cycler and software (Corbett Research;
Sydney, Australia). Reactions were carried out in triplicate in a
total volume of 25 μl. Each reaction mixture contained 1X PCR mix
Rotor-Gene SYBR-Green, Qiagen®; 4 ng of each primer and
87 ng of template DNA final concentration. Cycling conditions were
95°C for 5 min, 40 cycles; at 95°C for 20 sec; at 60°C for 20 sec
and at 72°C for 20 sec. Standard curves were prepared using 5 μl of
each plasmid dilution and 20 ng of each primer.
qPCR her-2 gene quantification
her-2 gene quantification in negative and
positive (IHC 2+, IHC 3+) patient samples were obtained by
calculating the ratio between her-2/whn gene
amplification parameters. According to commercial protocols
her2/whn negative control must present a value <2.0.
Patient sample ratios with <2.0 values were also regarded as
negative for her-2 amplification. Patient sample ratios with
>2.0 values were regarded as positive for her-2 gene
amplification.
Results and Discussion
Twenty-six BC biopsies previously evaluated by IHC
were analyzed using a qPCR methodology. Biopsies 49, 50 and 51,
reported as negative in IHC evaluation, also presented negative
results in the qPCR analysis developed in this study (Table I). Fifteen biopsies were evaluated
as IHC 2+ and eight were evaluated as IHC 3+ for Her-2 protein
production (Table I). Biopsies 11
and 29 that were previously evaluated as IHC 3+ presented a <2.0
qPCR ratio in our evaluation. This result is considered as
her-2 negative when using commercial kits (e.g.,
her-2/neu DNA Quantification Assay; Roche Molecular
Biochemicals, Mannheim, Germany). In this sense, samples 11 and 29
possibly demonstrated a polysomic condition because high qPCR
values were obtained by her-2 and whn genes
individually (data not shown). In other words, the whn
reference gene is located on the same chromosome as the
her-2 gene, therefore in a polysomic condition the
her-2/whn ratio will always be around the value of
1.0 (Table I). It has been reported
by FISH that her-2 gene amplification occurs on its own
chromosome or have chromosome 17 polysomy, the latter being always
reported as negative by qPCR (8).
In addition, FISH analysis depends on the number of her-2
positive cells observed with respect to the amount of tissue
analyzed. In this sense, qPCR analysis avoids this possible
misinterpretation during ratio calculation among her-2/whn
genes as independent from tissue amounts.
 | Table IqPCR results from formalin-fixed and
paraffin-embedded breast biopsies tumors. |
Table I
qPCR results from formalin-fixed and
paraffin-embedded breast biopsies tumors.
| ID | Year | Patient age
(years) | IHC | Lowest qPCR
ratio | Highest qPCR
ratio | Average ratio | SD |
|---|
| 1 | 2004 | 72 | 3+ | 10.87 | 11.98 | 11.43 | 0.78 |
| 6 | 2004 | 47 | 3+ | 10.34 | 10.51 | 10.43 | 0.12 |
| 11 | 2004 | 44 | 3+ | 0.90 | 1.19 | 1.05 | 0.21 |
| 14 | 2005 | 55 | 3+ | 3.46 | 4.00 | 3.73 | 0.38 |
| 19 | 2005 | 59 | 3+ | 9.02 | 10.24 | 9.63 | 0.86 |
| 29 | 2005 | 75 | 3+ | 1.91 | 1.86 | 1.89 | 0.04 |
| 31 | 2005 | 35 | 3+ | 7.29 | 8.24 | 7.77 | 0.67 |
| 64 | 2008 | 54 | 3+ | 10.04 | 9.95 | 10.00 | 0.06 |
| 3 | 2004 | 58 | 2+ | 1.01 | 1.49 | 1.25 | 0.34 |
| 5 | 2004 | 53 | 2+ | 3.19 | 3.64 | 3.42 | 0.32 |
| 7 | 2004 | 46 | 2+ | 1.44 | 1.20 | 1.32 | 0.17 |
| 8 | 2004 | 51 | 2+ | 5.24 | 4.96 | 5.10 | 0.20 |
| 25 | 2005 | 47 | 2+ | 4.50 | 3.80 | 4.15 | 0.49 |
| 35 | 2005 | 45 | 2+ | 7.11 | 4.37 | 5.74 | 1.94 |
| 65 | 2008 | 50 | 2+ | 1.54 | 1.70 | 1.62 | 0.11 |
| 68 | 2009 | 35 | 2+ | 3.96 | 3.64 | 3.80 | 0.23 |
| 70 | 2009 | 57 | 2+ | 3.33 | 2.70 | 3.02 | 0.45 |
| 71 | 2007 | 90 | 2+ | 2.42 | 3.41 | 2.92 | 0.70 |
| 73 | 2008 | 38 | 2+ | 3.82 | 2.78 | 3.30 | 0.74 |
| 74 | 2008 | - | 2+ | 9.80 | 9.85 | 9.83 | 0.04 |
| 75 | 2008 | 50 | 2+ | 3.35 | 3.49 | 3.42 | 0.10 |
| 77 | 2008 | 73 | 2+ | 1.59 | 1.58 | 1.59 | 0.01 |
| 78 | 2008 | 52 | 2+ | 50.40 | 52.49 | 51.45 | 1.48 |
| 49 | 2006 | 55 | neg | 1.14 | 1.42 | 1.28 | 0.20 |
| 50 | 2006 | 56 | neg | 0.50 | 0.61 | 0.56 | 0.08 |
| 51 | 2006 | 80 | neg | 1.00 | 0.62 | 0.81 | 0.27 |
| Control | | | | 0.92 | 1.08 | 1.00 | 0.11 |
In the IHC 3+ samples, sample 14 presented a 3.73
average qPCR ratio. Most of IHC 2+ biopsies evaluated in this study
and reported in Table I, presented
a similar 3.5 average qPCR ratio, meaning that biopsy 14 should be
considered as an IHC 2+ and not an IHC 3+ sample. In addition, IHC
3+ samples 1, 6, 19, 31 and 64 presented a 9.5 qPCR average ratio,
making these results most reasonable for an IHC 3+ evaluation
performed by a pathology laboratory (Table I).
Previous studies have shown an equivalence of 80–90%
among FISH and qPCR techniques on samples assessed as 3+ by IHC
(9,10). In this sense, our results confirm
the same percentage of accuracy, as we only had one discrepancy
among the eight samples analyzed (ID 14). The discrepancies in
samples 11 and 29 were caused by polysomy of the her-2 gene
on chromosome 17, not IHC or qPCR misevaluation. However, special
attention must be given to polysomy when qPCR is the only
methodology utilized. Generally, high qPCR values will be found for
her-2 and whn genes individually, contrary to low
qPCR values obtained in negative or IHC 2+ samples.
Conversely, great differences have been reported
between IHC 2+ results with respect to FISH and qPCR evaluations
(9–11). It has been mentioned that IHC 2+
result variability is principally caused by tissue quality,
fixation time, type of antibody used and lack of standardization
among users (3,12). In this sense, our experience
indicates that IHC 2+ misevaluation depends on low Her-2 protein
levels contained in samples analyzed, but principally on resolution
capacity limitations of IHC methodology to quantify low target
protein levels. It is important to consider that IHC 3+ sample
biopsies were also evaluated by the same pathology laboratory and
few discrepancies were obtained.
Discrepancies of 20–40% from samples evaluated as
IHC 2+ with respect to results obtained by using FISH or qPCR
techniques have been reported (11,13–17).
In this study, from fifteen biopsies evaluated as IHC 2+, four (ID
3, 7, 65 and 77) were identified with a <2.0 qPCR ratio, showing
non-amplification differences with respect to the negative control
(Table I). In addition, some
researchers have suggested that qPCR cut-off should be greater than
2.7 to be considered as her-2 amplification (11,16,18).
In this sense, we suggest that qPCR ratios between 2.5 and 5.0 must
be considered as an IHC 2+ result. In this study, almost 50% of IHC
2+ biopsies analyzed presented a 3.5 average qPCR ratio that
adequately matched our proposal. However, samples 8, 35, 74 and 78,
also reported as IHC 2+, presented a >5 qPCR ratio, meaning that
these samples must be classified as IHC 3+ instead of IHC 2+. In
this case, a misevaluation occurred when using IHC methodology with
respect to qPCR, even when these biopsies presented high Her-2
protein levels. Taking into account samples 8, 35, 74 and 78,
presenting a >5 qPCR ratio, and samples 3, 7, 65 and 77,
presenting a <2 qPCR ratio, more than 50% of biopsies identified
as IHC 2+ were wrongly classified, displaying a higher percentage
discrepancy with respect to data reported (3,11,13,16).
The results obtained in this study suggest a new IHC-qPCR
relationship, which could be used to easily differentiate among IHC
negative, IHC 2+ and IHC 3+ results. IHC negative result samples
should demonstrate a qPCR ratio <2, IHC 2+ result samples should
demonstrate ratios between 2.5 and 5.0, and IHC 3+ result samples
should demonstrate a qPCR ratio >5. This proposal is in
concordance with biopsies and qPCR results obtained in this
manuscript.
In this study, qPCR technique has been shown to be
complementary to IHC analysis, similar to FISH; however, qPCR
analysis is faster, less expensive and is an equally useful
alternative methodology for patients.
Acknowledgements
We thank pathologist Dr Mario Knomura
for giving us the opportunity to use archived tissue samples. Also
to CONACyT for supporting the program of incorporation of
scientists and technologists to the productive sector where we
began this study in 2006.
References
|
1
|
Osborne C, Wilson P and Tripathy D:
Oncogenes and tumor suppressor genes in breast cancer: potential
diagnostic and therapeutic applications. Oncol. 9:361–377. 2004.
View Article : Google Scholar : PubMed/NCBI
|
|
2
|
Ross JS, Fletcher JA, Bloom KJ, Linette
GP, Stec J, Symmans WF, Pusztai L and Hortobagyi GN: Targeted
therapy in breast cancer. Mol Cell Prot. 3:379–392. 2004.
View Article : Google Scholar
|
|
3
|
Tsuda H: HER-2 (c-erbB-2) test update:
present status and problems. Breast Cancer. 13:236–248. 2006.
View Article : Google Scholar : PubMed/NCBI
|
|
4
|
Turbett GR, Barnett TC, Dillon ED and
Sellner LN: Single tube protocol for the extraction of DNA or RNA
from paraffin embedded tissues using a starch based adhesive.
Biotech. 20:846–853. 1996.PubMed/NCBI
|
|
5
|
Ausbel FM, Brent R, Kingston RE, Moore DD,
Seidman JG, Smith JA and Struhl K: Short Protocols in Molecular
Biology. 5th edition. John Wiley & Sons; New York: pp.
15122002
|
|
6
|
Königshoff M, Wilhelm J, Bohle RM, Pingoud
A and Hahn M: HER-2/neu gene copy number quantified by real time
PCR: comparison of gene amplification, heterozygosity and
immunohistochemical status in breast cancer tissue. Clin Chem.
49:219–229. 2003.
|
|
7
|
Willmore-Payne C, Holden JA, Zhou H, Gupta
D, Hirschowitz S, Wittwer CT and Layfield LJ: Evaluation of
HER-2/neu gene status in osteosarcoma by fluorescence in situ
hybridization and multiplex and monoplex polymerase chain
reactions. Arch Pathol Lab Med. 130:691–698. 2006.PubMed/NCBI
|
|
8
|
Lal P, Salazar PA, Ladanyi M and Chen B:
Impact of polysomy 17 on HER-2/neu immunohistochemistry in breast
carcinomas without HER-2/neu gene amplification. J Mol Diag.
5:155–159. 2003. View Article : Google Scholar : PubMed/NCBI
|
|
9
|
Benöhr P, Henkel V, Speer R, Vogel U,
Sotlar K, Aydeniz B, Reiser A, Neubauer H, Tabiti K, Wallwiener D
and Kurek R: Her-2/neu expression in breast cancer. A comparison of
different diagnostic methods. Anticancer Res. 25:1895–1900.
2005.PubMed/NCBI
|
|
10
|
Merkelbach-Bruse S, Wardelmann E, Behrens
P, Losen I, Buettner R and Friedrichs N: Current diagnostic methods
of HER-2/neu detection in breast cancer with regard to real-time
PCR. Am J Surg Pathol. 27:1565–1570. 2003. View Article : Google Scholar : PubMed/NCBI
|
|
11
|
Kulka J, Tőkés AM, Kaposi-Novák P,
Udvarhelyi N, Keller A, Lotz G and Schaff Z: Detection of HER-2/neu
gene amplification in breast carcinomas using quantitative real
time PCR: a comparison with immunohistochemical and FISH results.
Pathol Oncol Res. 12:197–204. 2006. View Article : Google Scholar : PubMed/NCBI
|
|
12
|
Dobson L, Conway C, Hanley A, Johnson A,
Costello S, O’Grady A, Connolly Y, Magee H, O’Shea D, Jeffers M and
Kay E: Image analysis as an adjunct to manual HER-2
immunohistochemical review: a diagnostic tool to standardize
interpretation. Histophatol. 57:27–38. 2010. View Article : Google Scholar : PubMed/NCBI
|
|
13
|
Gjerdrum LM, Sorensen BS, Kjeldsen E,
Sorensen FB, Nexo E and Hamilton-Dutoit S: Real time quantitative
PCR of microdissected paraffin-embedded breast carcinoma. J Mol
Diag. 6:42–51. 2004. View Article : Google Scholar : PubMed/NCBI
|
|
14
|
Lehmann U, Glöckner S, Kleeberger W, Feist
H, von Wasielewski R and Kreipe H: Detection of gene amplification
in archival breast cancer specimens by laser assisted
microdissection and quantitative real time polymerase chain
reaction. Am J Pathol. 156:1855–1864. 2000. View Article : Google Scholar : PubMed/NCBI
|
|
15
|
Millson A, Suli A, Hartung L, Kunitake S,
Bennett A, Nordberg MCL, Hanna W, Wittwer CT, Seth A and Lyon E:
Comparison of two quantitative polymerase chain reaction methods
for detecting HER2/neu amplification. J Mol Diag. 5:184–190. 2003.
View Article : Google Scholar : PubMed/NCBI
|
|
16
|
Owens MA, Horten BC and Da Silva MM: HER2
amplification ratios by fluorescence in situ hybridization and
correlation with immunohistochemistry in a cohort of 6556 breast
cancer tissues. Clin Breast Cancer. 5:63–69. 2004. View Article : Google Scholar : PubMed/NCBI
|
|
17
|
Tse C, Brault D, Gligorov J, Antoine M,
Neumann R, Lotz JP and Capeau J: Evaluation of the quantitative
analytical methods real time PCR for HER-2 gene quantification and
ELISA of serum HER-2 protein and comparison with fluorescence in
situ hybridization and immnunohistochemistry for determining HER-2
status in breast cancer patients. Clin Chem. 51:1093–1101.
2005.PubMed/NCBI
|
|
18
|
Murphy SK, Magliocco AM and Demetrick DJ:
Copy number analysis of c-erb-B2 (HER-2/neu) and topoisomerase IIα
genes in breast carcinoma by quantative real time polymerase chain
reaction using hybridization probes and fluorescence in situ
hybridization. Arch Pathol Lab Med. 129:39–46. 2005.PubMed/NCBI
|