Introduction
The E2F family plays a crucial role in the control
of the cell cycle and action of tumor suppressor proteins (1). E2F1 belongs to the E2F family of
transcription factors, coordinating the expression of key genes
involved in cell cycle regulation and progression (2). The E2F1 gene is located on
chromosome 20 q, spanning approximately 10.71 kb, and it contains 7
exons (3). Due to its pivotal and
multifunctional role in cell cycle control, E2F1 is expected to be
a significant player in carcinogenesis (4). Excess of E2F1 may promote
proliferation, but at the same time it may also enhance apoptosis,
and there are examples where overexpression or lack of E2F1 has
both positive and negative effects on tumorigenesis (5). The delicate balance between growth and
death appears to depend on the level of E2F1 deregulation, but also
on the cell context background (2).
It is well known that genetic variants in microRNA
(miRNA) binding regions can result in altered gene functions.
miRNAs are capable of regulating the E2F activity, and miRNA
dysregulation has been implicated in malignancy. For instance, E2F1
directly binds to the promoter of the miR-17∼92 cluster, activating
its transcription, which in turn negatively modulates translation
of E2F1 mRNAs by binding sites in their 3’UTR (6,7). In
addition, certain studies have shown that E2F1 and
E2F2 variants may play important roles in carcinogenesis
(8,9). Considering that E2F1 is crucial for
E2F family-dependent apoptosis (10), and the role of variants in miRNA
binding sites of E2F1 remains unknown, in the present study,
we tested our hypothesis that E2F1 3’UTR variants are
associated with its mRNA expression by performing a bioinformatic
analysis and genotype-phenotype association analysis based on the
HapMap database.
The study was approved by the ethics committee of
Nanjing Jinling Hospital.
Materials and methods
Bioinformatic analysis and selection of
polymorphisms
The single nucleotide polymorphisms (SNPs) were
identified both in the E2F1 gene region and in the coding
region by the online database (http://www.ncbi.nlm.nih.gov/SNP/). The distribution of
all E2F1 genotypes among the different populations was
calculated. We also predicted the potential miRNA binding sites
using the bioinformatic tool SNP Function Prediction (FuncPred;
http://snpinfo.niehs.nih.gov/cgi-bin/snpinfo/snpfunc.cgi).
Additionally, we calculated pairwise linkage disequilibrium (LD)
values of all SNPs in the same gene, then selected the SNPs that
were not in LD (r2<0.8), and plotted LD maps of those
SNPs in E2F1 genes with the online program (http://snpinfo.niehs.nih.gov/cgi-bin/snpinfo/snpfunc.cgi).
Genotype and mRNA expression data of
lymphoblastoid cell lines from HapMap database
We used additional data on E2F1 genotypes and
mRNA levels available online (http://app3.titan.uio.no/biotools/help.php?app=snpexp)
for the genotypephenotype association analysis (11). For the analysis of gene expression
variation, we used genome-wide expression arrays (47,294
transcripts) from Epstein-Barr virus-transformed lymphoblastoid
cell lines from the same 270 HapMap individuals (142 males and 128
females) (12). The genotyping data
were from the HapMap phase II release 23 data set consisting of
3.96 million SNP genotypes from 270 individuals from 4 populations
(13). SNPexp v1.2 was used for
calculating and visualizing correlations between HapMap genotypes
and gene expression levels (Norwegian PSC Research Center, Clinic
for Specialized Surgery and Medicine, Oslo University Hospital
Rikshospitalet, Norway). We searched for probes representing the
gene E2F1 in the file
‘illumina_Human_WG-6_array_content.csv’, and identified one probe,
GI_12669910-S. This was analyzed separately and stored as a
separate output file with the probe name added to the filename.
Running correlation analysis between SNP genotypes and expression
levels for probes: GI_12669910-S (additive model assumed).
Statistical methods
We performed genotype and phenotype correlation
analysis using the Chi-square test. All statistics tests were
two-sided and P<0.05 was considered to indicate a statistically
significance result.
Results
E2F1 3’UTR selected variants and their
putative function
In total, 183 SNPs were identified in the
E2F1 gene region, and 60 in the coding region (http://www.ncbi.nlm.nih.gov/SNP/). Of these, 21
SNPs were reported in the 3’ UTR, of which only five SNPs
(rs3213180, rs3213182, rs3213183, rs3213177, rs117423075) had
available minor allele frequency (MAF) values, as shown in Table I. Computer prediction analysis
revealed the putative miRNA binding sites in the selected 5 SNPs in
E2F1 3’UTR (Table I). The
most extensively studied SNP of these is the C-to-G transition
which includes hsa-miR-1182, hsa-miR-1183, hsa-miR-1231,
hsa-miR-140-3p, hsa-miR-220c, hsa-miR-509-3-5p, hsa-miR-638,
hsa-miR-760 and hsa-miR-769-3p putative binding sites (http://snpinfo.niehs.nih.gov/cgi-bin/snpinfo/snpfunc.cgi).
Combined with other SNPs in the 3’UTR or promoter region, the
variant rs3213180 is jointly involved in cancer susceptibility
(8,9). Secondly, we used the bioinformatic
tool FuncPred (http://snpinfo.niehs.nih.gov/snpfunc.htm) to identify
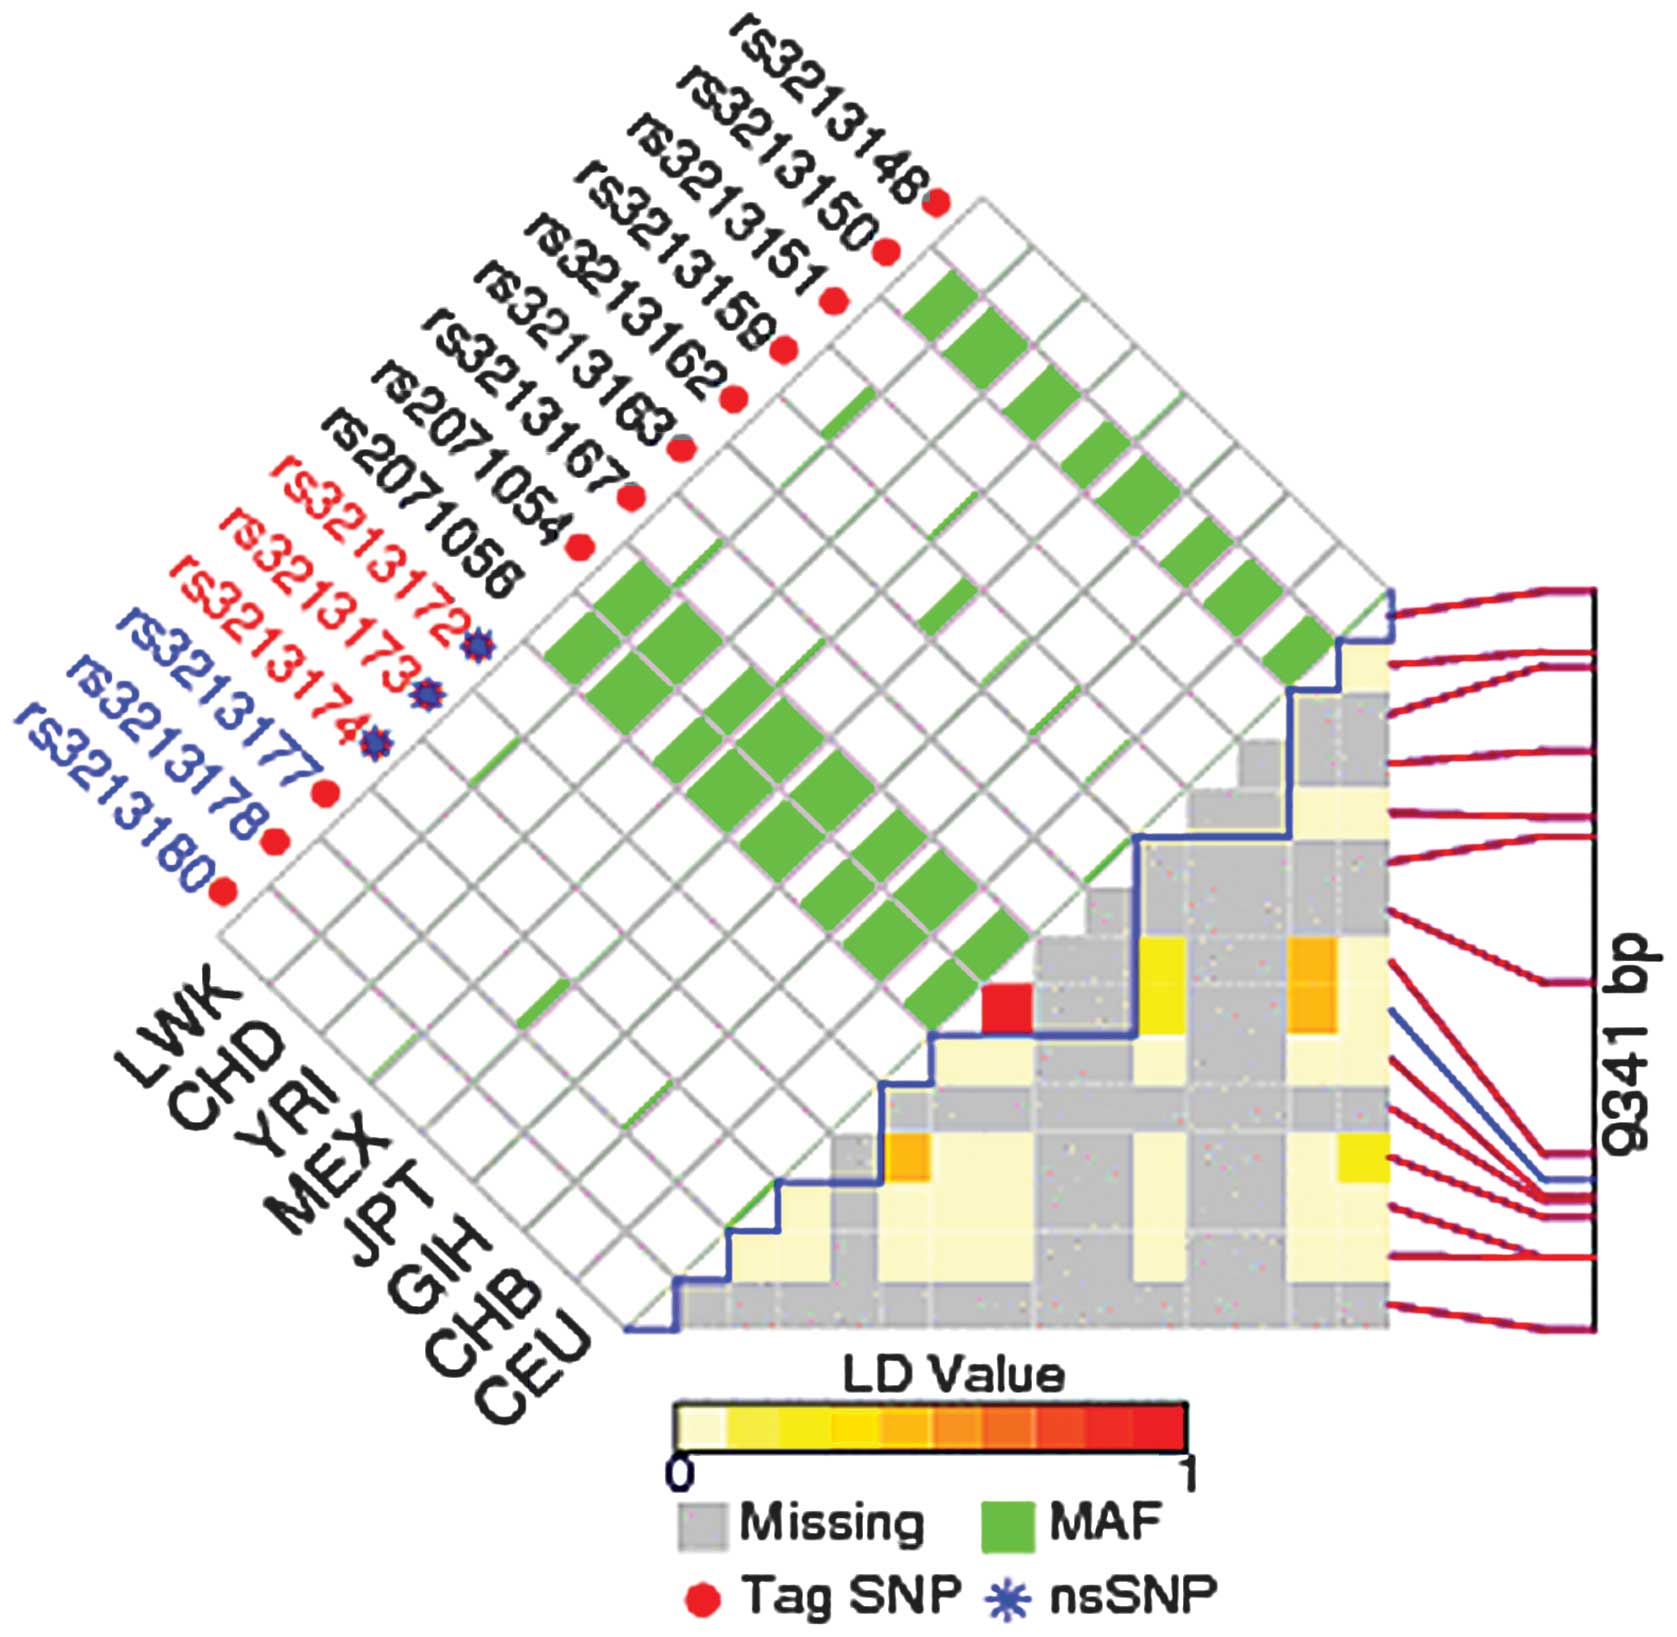
their potential functional relevance. We calculated pairwise LD
values of all SNPs in the same gene, then selected the SNPs that
were not in LD (r2<0.8), and plotted LD maps of those
SNPs in E2F1 genes using FuncPred. Each square number
represents the pairwise r2 correlations between the
relevant two SNPs. The color of each SNP spot reflects its D’
value, which changes from red to white as the D’ value decreases.
The haplotype blocks were estimated with the FuncPred program. The
minor allele frequency of all the above alleles was greater than
0.01. rs3213180 was the predicted tag SNP in our study, and
rs3213182 and rs3213183 in E2F1 were not included in the LD
plot (Fig. 1).
 | Table ISelected SNPs of E2F1 3’UTR and
putative miRNA binding sites. |
Table I
Selected SNPs of E2F1 3’UTR and
putative miRNA binding sites.
| Name | Alleles | MAF | Putative miRNA
binding sites |
|---|
| rs3213180 | C>G | 0.1224 | hsa-miR-1182,
hsa-miR-1183, hsa-miR-1231, hsa-miR-140-3p, hsa-miR-220c,
hsa-miR-509-3-5p, hsa-miR-638, hsa-miR-760, hsa-miR-769-3p |
| rs117423075 | C>T | 0.0053 | NA |
| rs3213182 | T>G | 0.067 | NA |
| rs3213183 | C>T | 0.267 | NA |
| rs3213177 | G>T | 0.0095 | hsa-miR-133a,
hsa-miR-133b, hsa-miR-331-3p |
Frequency distribution of selected E2F1
3’UTR variants among different populations
Due to the lack of frequency distribution data
available for rs117423075 in the HapMap website, only the frequency
distribution data of the other four SNP variants among different
populations are summarized in Table
II. The frequencies of the CC, CG and GG genotypes of rs3213180
among the African population were 95.0, 5.0 and 0%, respectively,
compared with those of the global population of 77.0, 20.7 and
2.3%, respectively. The G alleles of rs3213180 in the European,
African and global population were 5.8, 2.5 and 12.6%,
respectively. Frequencies of rs3213180 genotypes have not been
reported for European and Asian populations (Table II).
| Table IIFrequency distributions of selected
variables in different populations. |
Table II
Frequency distributions of selected
variables in different populations.
| Genotypes | European | Asian | African | Global |
|---|
| rs3213180 | | | | |
| CC | - | - | 0.095 | 0.770 |
| CG | - | - | 0.050 | 0.207 |
| GG | - | - | 0.000 | 0.023 |
| G alleles | 0.058 | - | 0.025 | 0.126 |
| rs3213182 | | | | |
| TT | 0.841 | 1.000 | 0.968 | 0.920 |
| TG | 0.150 | 0.000 | 0.032 | 0.068 |
| GG | 0.009 | 0.000 | 0.000 | 0.011 |
| G alleles | 0.084 | 0.000 | 0.016 | 0.045 |
| rs3213183 | | | | |
| CC | 0.478 | 0.430 | 0.467 | 0.511 |
| CT | 0.460 | 0.384 | 0.417 | 0.433 |
| TT | 0.062 | 0.186 | 0.117 | 0.045 |
| T alleles | 0.292 | 0.378 | 0.325 | 0.267 |
| rs3213177 | | | | |
| GG | 0.929 | 1.000 | 0.984 | 0.841 |
| GT | 0.071 | 0.000 | 0.016 | 0.159 |
| TT | 0.000 | 0.000 | 0.00 | 0.000 |
| T alleles | 0.035 | 0.000 | 0.008 | 0.080 |
E2F1 mRNA expression by genotype in
lymphoblastoid cell lines
For mRNA expression of the prohibitin gene in the
lymphoblastoid cell lines, we took advantage of the available
HapMap-cDNA expression database for the correlation analysis of
prohibitin genotype and mRNA expression in 270 HapMap
lymphoblastoid cell lines. With the exception of the one cell line
with unavailable values for rs3213183, 122 (45.4%) cell lines with
the CC genotype, 116 (43.1%) cell lines with the CT genotype and 31
(11.5%) cell lines with the TT genotype were identified. For
rs3213180, 86 (95.6%) cell lines had the GG genotype and 4 (4.4%)
had the CG genotype. There were 256 (95.5%) cell lines with TT, 11
(4.0%) with TG, and 1 (0.4%) with GG genotype for rs3213182.
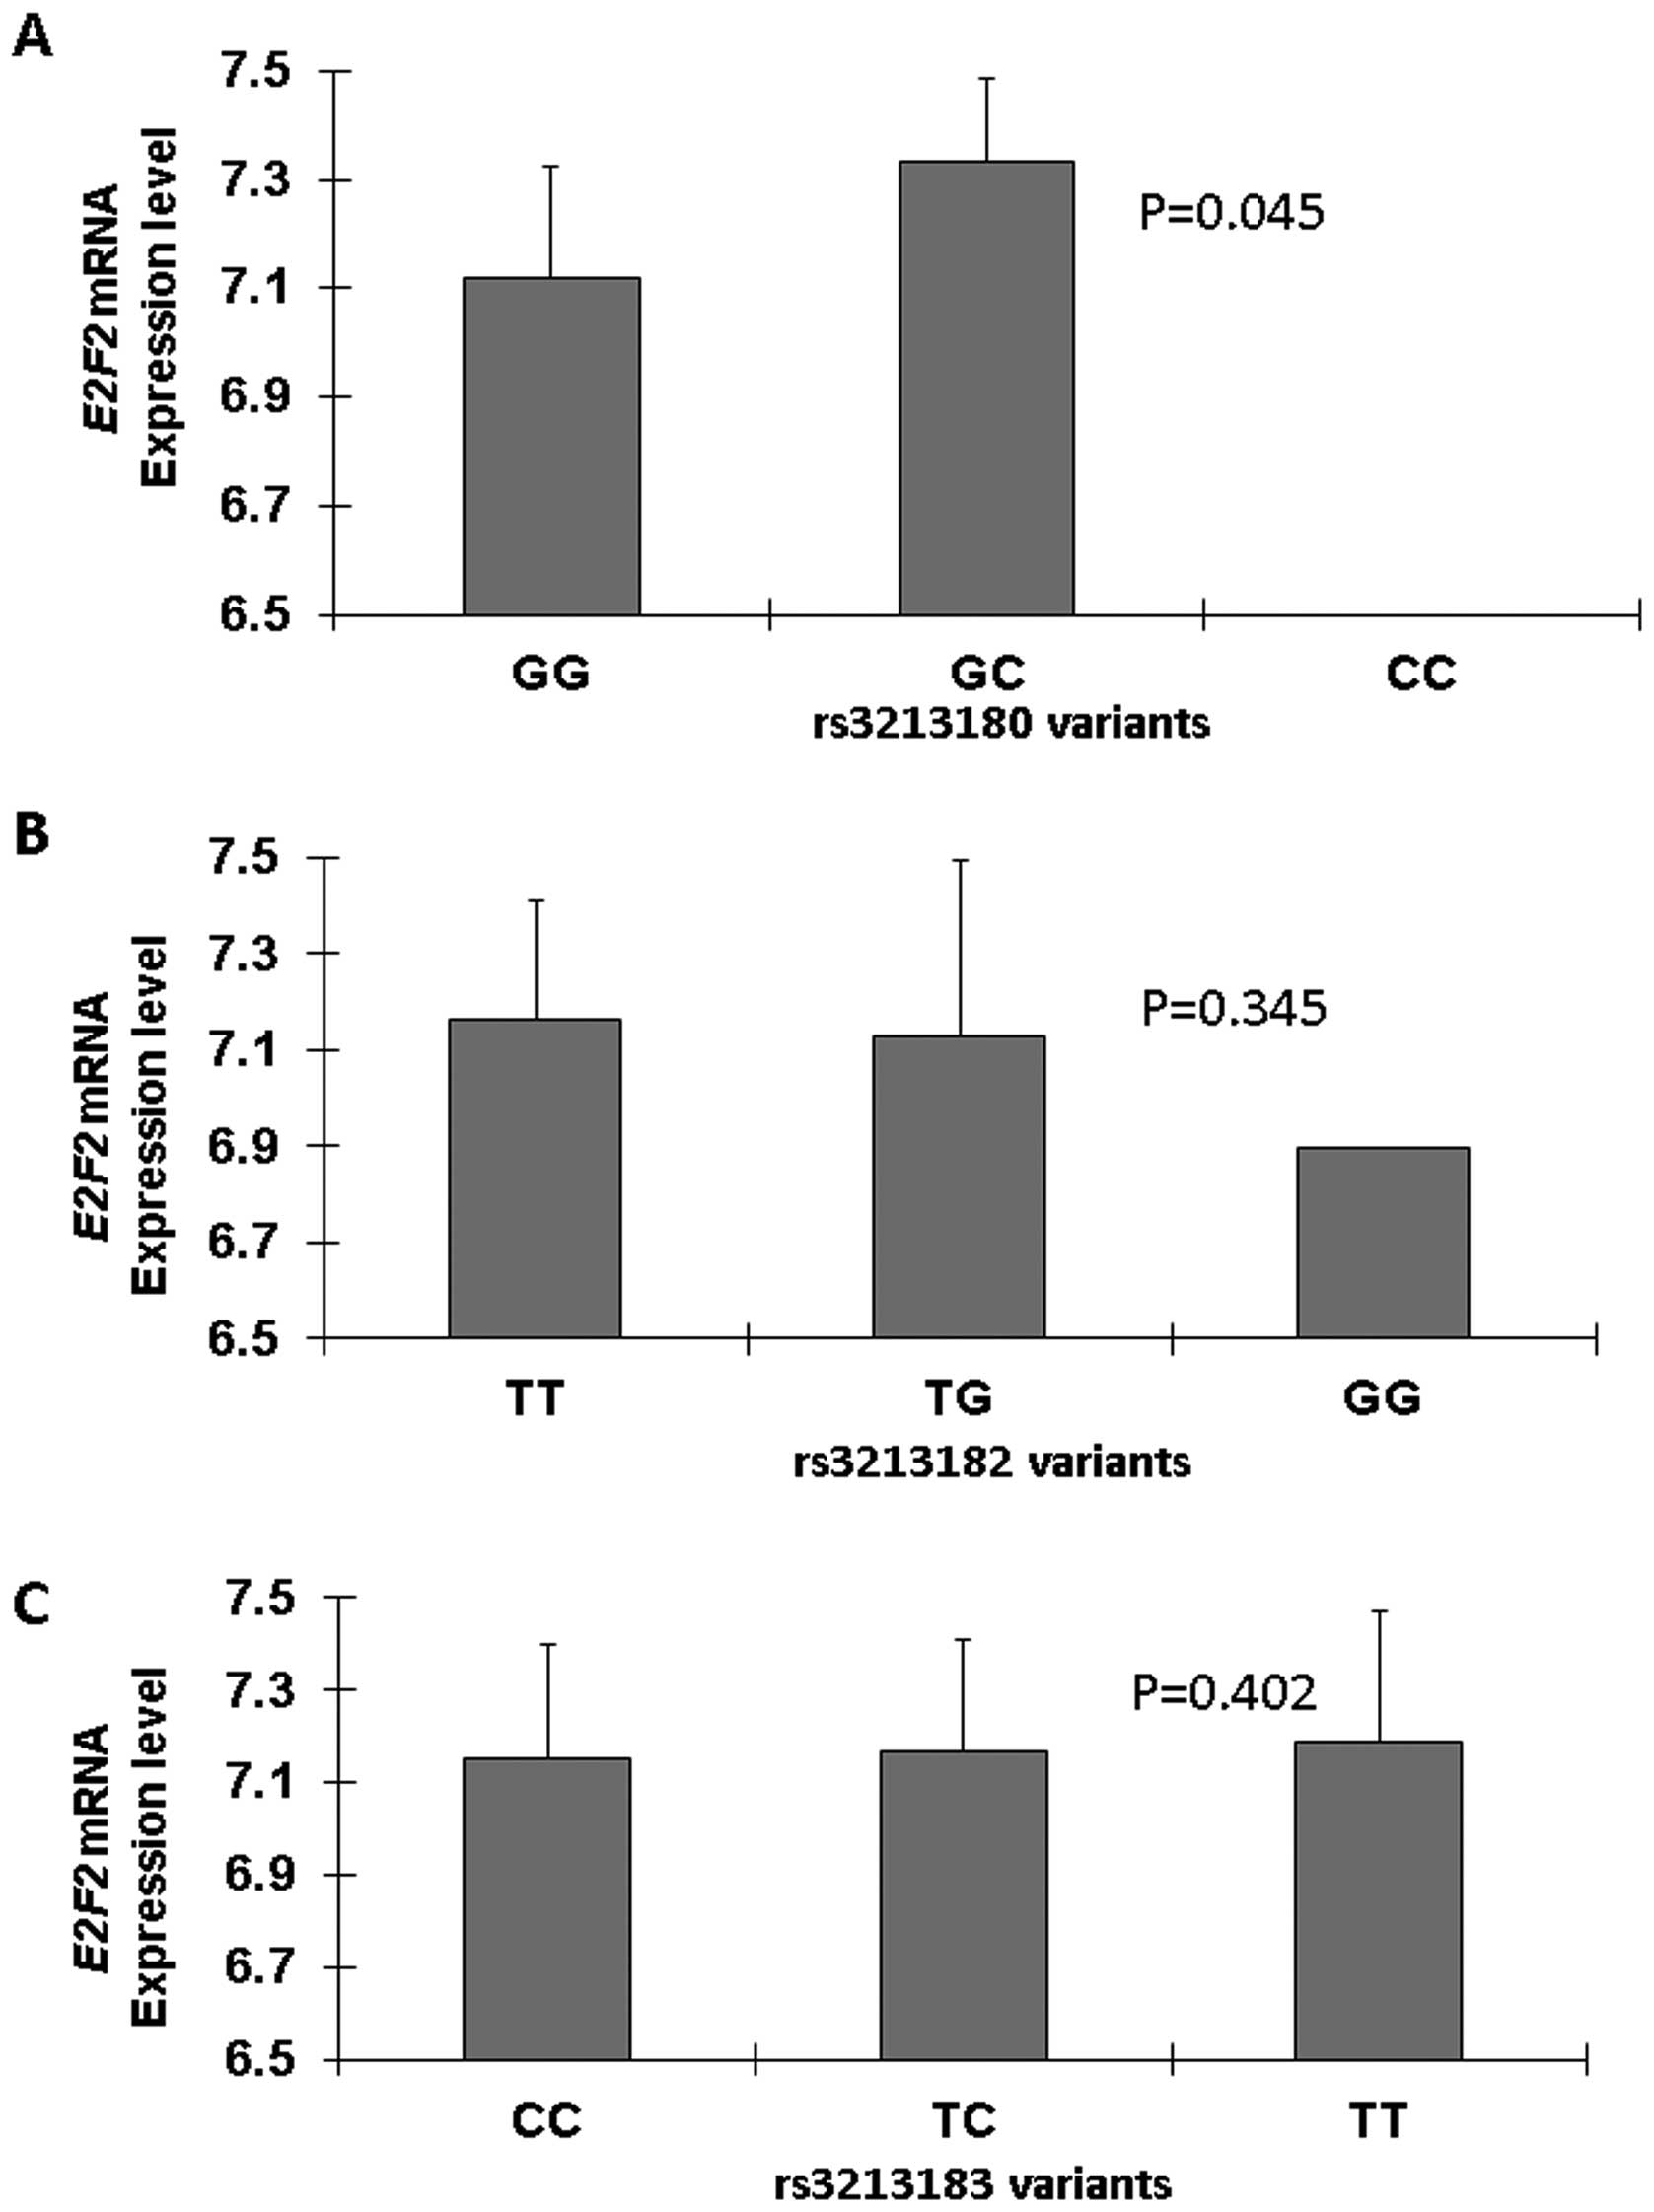
Fig. 2 shows the E2F1 mRNA
expression levels of cell lines by E2F1 genotype. The
rs3213180 GG genotype was found to have significantly lower
expression levels than the CG (P=0.045; Fig. 2A), and there was no significant
difference in E2F1 mRNA expression level among cell lines
carrying rs3213182 (P=0.345) and rs3213183 (P=0.402) genotypes
(Fig. 2B and C).
Discussion
The E2F family consists of transcriptional factors
that play pivotal roles in regulating both cell proliferation and
antiproliferative processes (2),
and these transcription factors regulate the expression of a panel
of cellular genes that control cellular DNA synthesis and
proliferation, largely in a cell cycle-dependent manner. E2F1 is
also considered to be a critical modulator of cellular senescence
in human cancer (14). E2F proteins
and their target genes comprise a genetic pathway that is possibly
the most altered pathway in human cancer (15). Deregulated expression or activity of
most members of the E2F family has been detected in numerous types
of human cancer (16,17). The most common genetic alteration of
the E2F1 gene is amplification, as has been reported in
several types of cancer, including leukemia (e.g., the HEL human
erythroleukemia cell line) (18).
The gene has also been found to be amplified in various cancers,
and the amplification of the E2F1 gene is linked with
greater aggressiveness and poorer prognosis (17) as well as acquisition of
antineoplastic agent resistance (19). Furthermore, E2F1 acting as an
oncogene is also found to be amplified in a number of malignancies.
It was demonstrated that several common SNPs of E2F1 are
significantly associated with cancer susceptibility (8,9). One
study also suggested that the E2F family proteins target miRNAs by
a negative feedback loop (20). It
is well-known that genetic susceptibility in miRNA binding regions
contributes to altered gene function, which is also supported by
some evidence in the present study. We found that rs3213180 was
significantly associated with E2F1 mRNA expression, but not
rs3213182 or rs3213183. Furthermore, using bioinformatic analysis,
the present study indicated that both rs3213180 and rs3213177 are
located in the E2F1 3’UTR and have miRNA binding sites as
predicted, and E2F1 rs3213182 and rs3213183 are located in
the 3’-near gene. We also observed that rs3213180 has a significant
association with expression, implying that this variant could
contribute in part to E2F1 post-transcriptional regulation.
It is also likely that genetic variants in E2F1 3’UTR may
modulate its expression and the variants in E2F1 miRNA
binding site are involved in carcinogenesis. Our research may
provide additional insight into the molecular mechanism of
E2F1 post-transcriptional regulation. It may improve
understanding of the regulatory roles of miRNA variants in
E2F1 3’UTR in its mRNA expression.
In summary, our results indicated the important role
of the E2F1 variant in post-transcriptional regulation.
However, these findings require validation by future studies
investigating their effect on E2F activity. Improved understanding
of how the 3’UTR variants regulate E2F1 activity will pave
the way to targeting the E2F1 pathway in cancer therapy.
Acknowledgements
This study was supported by grants
from the National Natural Science Foundation of China (Nos.
81272252, 81141094, to X. Guan) and the Natural Science Foundation
of Jiangsu Province (BK2011656, to X. Guan).
References
|
1
|
Polager S and Ginsberg D: p53 and E2f:
partners in life and death. Nat Rev Cancer. 9:738–748. 2009.
View Article : Google Scholar : PubMed/NCBI
|
|
2
|
Polager S and Ginsberg D: E2F - at the
crossroads of life and death. Trends Cell Biol. 18:528–535. 2008.
View Article : Google Scholar : PubMed/NCBI
|
|
3
|
Neuman E, Sellers WR, McNeil JA, Lawrence
JB and Kaelin WG Jr: Structure and partial genomic sequence of the
human E2F1 gene. Gene. 173:163–169. 1996. View Article : Google Scholar : PubMed/NCBI
|
|
4
|
Hallstrom TC and Nevins JR: Specificity in
the activation and control of transcription factor E2F-dependent
apoptosis. Proc Natl Acad Sci USA. 100:10848–10853. 2003.
View Article : Google Scholar : PubMed/NCBI
|
|
5
|
Crosby ME and Almasan A: Opposing roles of
E2Fs in cell proliferation and death. Cancer Biol Ther.
3:1208–1211. 2004. View Article : Google Scholar : PubMed/NCBI
|
|
6
|
Woods K, Thomson JM and Hammond SM: Direct
regulation of an oncogenic micro-RNA cluster by E2F transcription
factors. J Biol Chem. 282:2130–2134. 2007. View Article : Google Scholar : PubMed/NCBI
|
|
7
|
Sylvestre Y, De Guire V, Querido E, et al:
An E2F/miR-20a autoregulatory feedback loop. J Biol Chem.
282:2135–2143. 2007. View Article : Google Scholar : PubMed/NCBI
|
|
8
|
Cunningham JM, Vierkant RA, Sellers TA, et
al: Cell cycle genes and ovarian cancer susceptibility: a tagSNP
analysis. Br J Cancer. 101:1461–1468. 2009. View Article : Google Scholar : PubMed/NCBI
|
|
9
|
Lu M, Liu Z, Yu H, et al: Combined effects
of E2F1 and E2F2 polymorphisms on risk and early onset of squamous
cell carcinoma of the head and neck. Mol Carcinog. 51(Suppl 1):
E132–E141. 2012. View
Article : Google Scholar : PubMed/NCBI
|
|
10
|
Lazzerini Denchi E and Helin K: E2F1 is
crucial for E2F-dependent apoptosis. EMBO Rep. 6:661–668.
2005.PubMed/NCBI
|
|
11
|
Holm K, Melum E, Franke A and Karlsen TH:
SNPexp - A web tool for calculating and visualizing correlation
between HapMap genotypes and gene expression levels. BMC
Bioinformatics. 11:6002010. View Article : Google Scholar : PubMed/NCBI
|
|
12
|
Stranger BE, Forrest MS, Dunning M, et al:
Relative impact of nucleotide and copy number variation on gene
expression phenotypes. Science. 315:848–853. 2007. View Article : Google Scholar : PubMed/NCBI
|
|
13
|
Gibbs RA, Belmont JW, Hardenbol P, et al:
The International HapMap Project. Nature. 426:789–796. 2003.
View Article : Google Scholar
|
|
14
|
Park C, Lee I and Kang WK: E2F-1 is a
critical modulator of cellular senescence in human cancer. Int J
Mol Med. 17:715–720. 2006.PubMed/NCBI
|
|
15
|
Sladek TL: E2F transcription factor
action, regulation and possible role in human cancer. Cell Prolif.
30:97–105. 1997. View Article : Google Scholar : PubMed/NCBI
|
|
16
|
Molina-Privado I, Rodriguez-Martinez M,
Rebollo P, et al: E2F1 expression is deregulated and plays an
oncogenic role in sporadic Burkitt’s lymphoma. Cancer Res.
69:4052–4058. 2009.PubMed/NCBI
|
|
17
|
Gorgoulis VG, Zacharatos P, Mariatos G, et
al: Transcription factor E2F-1 acts as a growth-promoting factor
and is associated with adverse prognosis in non-small cell lung
carcinomas. J Pathol. 198:142–156. 2002. View Article : Google Scholar : PubMed/NCBI
|
|
18
|
Saito M, Helin K, Valentine MB, et al:
Amplification of the E2F1 transcription factor gene in the HEL
erythroleukemia cell line. Genomics. 25:130–138. 1995. View Article : Google Scholar : PubMed/NCBI
|
|
19
|
Obama K, Kanai M, Kawai Y, Fukushima M and
Takabayashi A: Role of retinoblastoma protein and E2F-1
transcription factor in the acquisition of 5-fluorouracil
resistance by colon cancer cells. Int J Oncol. 21:309–314.
2002.PubMed/NCBI
|
|
20
|
Emmrich S and Pützer BM: Checks and
balances: E2F-microRNA crosstalk in cancer control. Cell Cycle.
9:2555–2567. 2010. View Article : Google Scholar : PubMed/NCBI
|