Introduction
One of the challenges facing prospective research
designs is the recruitment of large and representative samples of
participants in order to enhance the external validity of the
results. The majority of the larger famous cohorts assessing risk
factors have widely been criticized as suffering from a
non-representative studied subpopulation leading to marked sampling
bias. For instance, the Framingham Heart Study, a cohort
cardiovascular study on residents of the town of Framingham
Massachusetts, has received extensive criticism concerning the
representativeness of the study population. Researchers in
particular wondered how closely the participants in the Framingham
study resemble the ordinary patients who healthcare professionals
meet in every-day practice (1).
Another large cohort study, the Nurses’ Health Study, has followed
121,700 female registered nurses since the mid-1970s. The aim was
to assess risk factors for cancer and cardiovascular disease. Due
to the selected subpopulation (nurses), this study has been
considered not representative of the general population with
respect to socio-demographic factors and health care access
(2). The Seven Countries Study
(SCS) revealed that the population of Crete had the lowest rates of
cardiovascular disease and cancer among 16 populations from seven
countries (Greece, Finland, Japan, former Yugoslavia, Italy, the
Netherlands and the United States) (3) and this was attributed to certain
lifestyle and dietary factors. The findings of the above study
contribute largely to the globally accepted statement that the
Cretan diet, as a rigorous branch of the Mediterranean diet, is a
remarkable determinant of the observed lower cardiovascular and
cancer mortality. However, others have criticized the SCS as
suffering from sampling bias (4).
In particular, the major comment concerning the Cretan cohort is
that its population was recruited from a specific rural area of
Crete and could not be representative of the whole of Crete. Thus
it is important to investigate those doubts.
An indirect method of investigating a representation
of a subpopulation is to compare the temporal trends of cancer
mortality rates of such a subgroup of a population with the figures
of the general population from which it originated (5). Temporal trends in major cancer
mortality causes predominantly reflect historical patterns of
similar risk factors within a population (6). We hypothesized that this may be
particularly true in a closed population such as that in Crete.
Thus the time-trends of mortality from major cancer causes in the
general Cretan population should present a similar pattern to the
figures of a specified geographical region. Taking the above into
account, the primary aim of this study was to examine whether the
Cretan cohort is reliable and representative of the rest of the
population in the island by comparing secular trends of major
cancer mortality figures. A second aim was to compare the variance
of cancer mortality rates of the SCS Cretan cohort during 51 years
of follow-up with those of the general population of Crete during
the same period.
Materials and methods
Sampling
The Cretan cohort of the SCS was identified in 1960
among 97.6% of all males aged between 40 and 59 years in 11
villages in the central region of Crete, Greece (3). The total sample included 686
participants. Follow-up examinations of the cohort took place 5,
10, 31, 37, 40 and 50 years after the baseline examinations. During
the 50 years of follow-up, information about all causes of
mortality was obtained from official death certificates. For the
purpose of this study we extended the period for obtaining the
information until 07/04/2011. The final adjudication of the
underlying cause of mortality and the contributory causes was made
according to the criteria of the World Health Organization (WHO)
International Classification of Diseases, 9th Revision (ICD-9), by
an expert medical epidemiologist. This study was approved by the
ethical committee of the University of Crete.
Statistical analysis
First, the number of mortalities from all types of
cancer in Crete per year, as classified by the ICD-9 mortality
classification system, was selected from the database of the
Hellenic Statistical Authority (EL.STAT) between 1960 and 2011. The
same was carried out for the mortalities from the Cretan cohort.
These two sets of data were transformed into number of mortalities
per 1,000 people. Secondly, the two sets of data were used
throughout the whole analysis process. Time-series models were
applied using Matlab. The two time-series were studied separately
to estimate if they present the same behavior through time;
behavior refers to their increases or decreases, variance,
intensity and pattern of occurrence (1–4,7–20).
Time-series analysis
Rescaled range analysis (Hurst-Mandelbrot) using a
time-series filter of the first differences method was applied in
order to examine whether there was long-term memory in our data
(1–4,7,8). This
method measures the H exponent. If H=0.5 then the time series
follows the model of random walk (random memory). If 0<H≤0.5
then the time series would have an anti-persistence (with zero
spectral density at the origin). Finally, if 0.5<H≤1 it means
that there is a long-term memory. The V statistic was also measured
by the same process to examine whether the time-series is
deterministic or not.
Continuously, state-space reconstruction was
applied. This refers to the method used to export conclusions
regarding the simplest system that is able to re-create the present
time-series (respectively), based on an observed quantity. We
determined this to be the simplest system of the minimum possible
number of variables that is able to reproduce this time-series.
Space reconstruction is fulfilled by creating points,
xiɛRm from single dimensional observations
{xi} for i=1,…,N. The parameters of reconstruction are:
embedding dimension ‘m’ that determines the number of observations
which become components of the reconstructed vector; and delay ‘r’
which determines the time difference between selections of the
parameters ‘m’ (8–14). The method of false nearest neighbors
was applied in order to estimate the embedding dimension, and the
Mutual Average Information method was used in order to carry out
the time delay estimation (8–20). As
a proposed time delay, we selected the one that was the first local
minimum. The optimum time delay is one that will enable the data to
be independent of one another when they are set as vectors with
independent factors in an ‘m’-dimensional system of coordinates.
This refers to independent data which are free of any kind of
dependence. The time delay is presented for each I(r) in bits. This
is the first local minimum of ‘r’ which presents the mutual average
information (8–14).
Results
The numbers and percentages of mortalities in the
Cretan cohort and in Crete per type of cancer between 1960 and 2011
are indicated in Table I. In the
cohort the total number of mortalities was 661, of which 125 were
cancer deaths (18.9%). In Crete the number of cancer deaths was
3881 (∼24% of all causes of mortality) between 1960 and 2011. The
first cause of cancer mortality was the gastrointestinal system
accounting for one-third of cancer mortalities in the two
populations. In the cohort, this was followed by cancer of the
urinary system (26.4%), respiratory system (25.6%) and
hematopoietic system (7.2%), whereas in the general population the
cancer causes differ: cancer of the hematopoietic system (22.8%),
respiratory system (18.3%) and urinary system (17.8%).
 | Table INumber of cancer mortalities in the
cohort and in Crete per type of cancer among males, between 1960
and 2011. |
Table I
Number of cancer mortalities in the
cohort and in Crete per type of cancer among males, between 1960
and 2011.
| Cause of mortality
(type of cancer) | No. of mortalities in
the cohort (%) | No. of mortalities in
Crete (%) |
|---|
| Respiratory
system | 32 (25.6) | 712 (18.3) |
| Urinary system | 33 (26.4) | 694 (17.9) |
| Gastrointestinal
system | 38 (30.4) | 1183 (30.5) |
| Hematopoietic
system | 9 (7.2) | 886 (22.8) |
| Brain | 5 (4.0) | 44 (1.1) |
| Other | 8 (6.4) | 362 (9.3) |
| Total | 125 (100) | 3881 (100) |
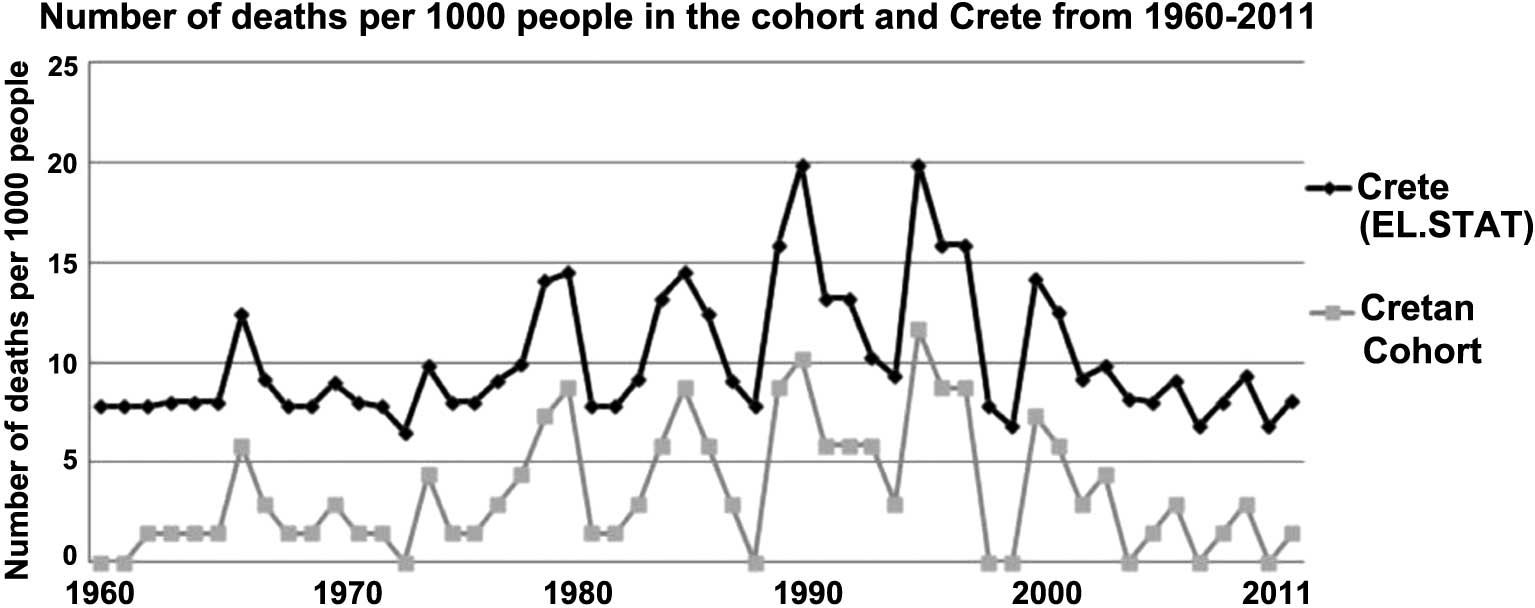
Cancer deaths per 1,000 individuals between 1960 and
2011 are shown in Fig. 1, for the
two sets of data. A greater number of cancer mortalities occurred
in Crete but the root in time is equal to that in the Cretan
cohort. In both cases, there are peaks in 1989 (8.75 deaths per
1,000 people in the Cretan cohort and 15.9 in Crete as a whole) and
1995 (11.66 deaths per 1,000 people in the Cretan cohort and 19.9
in Crete) since they increase or decrease through time in the exact
same way. Finally, both populations present lower mortality rates
in 1972 (1.46 deaths per 1,000 people in the Cretan cohort and 7.8
in Crete) and 1988 (0.02 deaths per 1,000 people in the Cretan
cohort and 7.8 in Crete).
In Table II, the
results of the rescaled range analysis are presented. The mean V
statistic of the EL.STAT time-series was equal to 0.69815, at a
confidence level of 95% (0.398–0.999) and that of the Cretan
cohort’s database was equal to 0.677143, at a confidence level of
95% (0.301–0.897). Long-term memory existence was identified by
calculation of the Exponent H (0.5<H≤1; Table II). Cancer mortality in the Cretan
cohort and the whole island of Crete was found to follow the same
non-random certain pattern through time since the exponent H values
for the two time-series were almost equal (Table II).
| Table IIRescaled range analysis and embedding
dimension applied to the time-series of the Cretan cohort and
Crete. |
Table II
Rescaled range analysis and embedding
dimension applied to the time-series of the Cretan cohort and
Crete.
| Cretan cohort
time-series | Crete (EL.STAT)
time-series |
|---|
| Mean V statistic | 0.677143 | 0.69815 |
| Exponent H (min;
max) | 0.286138;
0.514697 | 0.322975;
0.534748 |
| Embedding
dimension | 1 | 1 |
| Time delay | 1 | |
The embedding dimension is presented through the
method of false nearest neighbors in Table II. The embedding dimension for
EL.STAT’s data was equal to 1, as was that for the Cretan cohort’s
data (m=1). The time delay for this estimation (m=1) was equal to
1, a strong indication of a certain similarity between the nature
of the two data sets.
Since only one parameter (variable) is needed for
the cancer mortality system, it is important to identify the time
period at which cancer mortalities occur at a significant level.
The proposed time delay for cancer mortalities in the whole island
of Crete was 2 and this was equal to the final time delay of cancer
mortalities of the Cretan cohort (Tables III and IV). Therefore, the reconstruction system
for the two time series was demonstrated to be exactly equal.
Specifically, only one parameter and a two-year period should be
used in order to recreate these two systems of cancer deaths in the
future, in order to have correct, significant and reliable
results.
| Table IIIEstimation of the proposed time delay
applied on the number of cancer mortalities between 1961 and 2011
in Crete, using data from the EL.STAT database. |
Table III
Estimation of the proposed time delay
applied on the number of cancer mortalities between 1961 and 2011
in Crete, using data from the EL.STAT database.
| Final time delay | I(r) | Final time delay | I(r) |
|---|
| 0 | 1 | 14 | −0.1439 |
| 1 | 0.3814 | 15 | −0.06178 |
| 2 | 0.02021 | 16 | 0.05236 |
| 3 | −0.02785 | 17 | −0.05082 |
| 4 | 0.1095 | 18 | −0.1592 |
| 5 | 0.5218 | 19 | −0.2324 |
| 6 | 0.3641 | 20 | −0.1837 |
| 7 | 0.02206 | 21 | −0.07677 |
| 8 | −0.1162 | 22 | −0.1271 |
| 9 | −0.1503 | 23 | −0.07435 |
| 10 | 0.2171 | 24 | −0.1503 |
| 11 | 0.2393 | 25 | −0.1827 |
| 12 | −0.00186 | 26 | −0.11 |
| 13 | −0.1439 | | |
| Table IVEstimation of the proposed time delay
applied on the number of cancer mortalities between 1961 and 2011
in Crete, using data from the Cretan cohort database. |
Table IV
Estimation of the proposed time delay
applied on the number of cancer mortalities between 1961 and 2011
in Crete, using data from the Cretan cohort database.
| Final time delay | I(r) | Final time delay | I(r) |
|---|
| 0 | 1 | 14 | −0.2642 |
| 1 | 0.4178 | 15 | −0.14 |
| 2 | 0.06165 | 16 | 0.002099 |
| 3 | 0.04649 | 17 | −0.04582 |
| 4 | 0.1928 | 18 | −0.2015 |
| 5 | 0.4276 | 19 | −0.2615 |
| 6 | 0.4036 | 20 | −0.2318 |
| 7 | 0.0521 | 21 | −0.1406 |
| 8 | −0.07681 | 22 | −0.1558 |
| 9 | −0.1375 | 23 | −0.0567 |
| 10 | 0.1524 | 24 | −0.2072 |
| 11 | 0.2367 | 25 | −0.2215 |
| 12 | 0.04178 | 26 | −0.1127 |
| 13 | −0.1232 | | |
Discussion
Our study examined for the first time the
representativeness of the SCS Cretan cohort by investigating cancer
mortality rates over a 50-year period. The main findings of our
results showed a strong tendency for the Cretan cohort and the
entire island population to be moving toward similar cancer
mortality patterns.
Specifically, the Cretan cohort included a sample of
686 males aged between 40 and 59 years old, which has been often
criticized about its reliability (4). Although the SCS cohort exhibited a
lower cancer incidence than the general Cretan population, our data
indicate that the cancer mortalities of the two populations showed
a similar pattern concerning cancer mortality over time.
Additionally, a significantly larger number (than the mean number
of mortalities of the previous years) of cancer deaths in the
Cretan cohort occurred every 2 years as in the Cretan general
population. Thus, the rate of cancer mortality occurrence is
expected to be exactly the same for the Cretan cohort and Crete as
a whole, having similar increases or decreases (behavior). The two
time-series were constructed from the same number of factors.
Consequently, the cohort could be generalized to the total
population of Crete with regard to cancers, with no fear of
mis-estimations (12,13,20–24).
Similar to our observation, a USA study that examined cancer
mortality trends between 1950 and 1969 in New Jersey, New York and
Philadelphia in comparison with the remainder of the country also
revealed a strong tendency for the region and the remainder of the
nation to be moving towards similar mortality patterns (6). Another study conducted by Meslé et
al was the first step in an exploration of the Soviet cause of
death statistics which became accessible after 1986. Its aim was
the reconstruction of consistent annual series for the period
1970–1987. Similar to our study, cancer mortalities presented
increasing trends for the whole nation, particularly among females
(25). In addition, the study by
Anderson used interrupted time-series models and revealed that
cancer mortality among males in eastern New England was increasing
at a rate consistently higher than and almost parallel to national
male cancer mortality, while female cancer mortality was declining,
but less rapidly than nationally (26). Other studies have been carried out
using similar methods of analysis on various causes of mortality,
testing different parameters than those in our study. Stroup et
al applied multiple time-series analysis to estimate the impact
of influenza on mortality in various age groups, using a procedure
for updating estimates as current data become available from
national mortality data collected between 1962 and 1983. The study
found differences among genders and time points (27). It is clear that in epidemiology,
data often arise in the form of time-series, for example,
notifications of diseases, entries to a hospital and mortality
rates. Time-series models (especially, non-linear ones) are usually
applied to such data, as in several studies, including the present
one (6,14,23,24).
Cancer is a leading cause of mortality worldwide and
accounted for around 13% of all deaths in 2008 (28). The present study revealed that
nearly one-fifth of males from the Cretan cohort succumbed to
cancer during a 51-year period and one-quarter of males from Crete
as a whole during the same period. Similar observations were made
in a 40-year follow-up study in the US Railroad cohort of the SCS,
which indicated that cancer accounted for 25.1% of all causes of
mortality (29). Cancer of the
gastrointestinal system was the main cause of cancer deaths in both
Cretan populations, followed by cancer of the urinary and
respiratory system. Cancer studies of certain years (2004, 2006 and
2008) in Greece and Europe revealed that lung cancer was the main
cause of mortality from cancer among males (30–32).
The same trend was observed worldwide according to data for the
year 2008 (33). However,
conclusions on cancer mortality should not only be influenced by
our present knowledge but also from its own ‘nature’. Time-series
models aim at this goal: a complete description of the nature of
cancer mortality (14,21).
In conclusion, the present study revealed that the
two time-series for deaths from cancer (Cretan cohort and EL.STAT)
were of the same behavior, pattern, nature and reconstruction over
time, with the Cretan cohort having a slightly lower number of
mortalities per year. The two time-series present similar results.
These observations support the statement that the Seven Countries’
Study Cretan cohort is representative of the island’s entire
population.
Acknowledgements
The authors would like to thank the
ex-registrars of the Municipalities of Kastelli, Thrapsano and N.
Kazantzakis, Mrs. Despoina Manolaraki, Maria Vassilaki and
Konstantina Zidianaki, respectively.
References
|
1
|
Hadden D: Holidays in Framingham? BMJ.
325:5442002. View Article : Google Scholar
|
|
2
|
Barr RG, Wentowski CC, Curhan GC, et al:
Prospective study of acetaminophen use and newly diagnosed asthma
among women. Am J Respir Crit Care Med. 169:836–841. 2004.
View Article : Google Scholar : PubMed/NCBI
|
|
3
|
Keys A: Coronary heart disease in seven
countries. Circulation. 41(Suppl): 1–211. 1970.
|
|
4
|
Shaper AG: Reflections on the Seven
Countries Study. Lancet. 347:2081996. View Article : Google Scholar : PubMed/NCBI
|
|
5
|
Howell DC: Statistical Methods for
Psychology. 5th edition. Duxbury; Belmont, CA: 2002
|
|
6
|
Greenberg M, McKay F and White P: A
time-series comparison of cancer mortality rates in New Jersey-New
York-Philadelphia Metropolitan region and the remainder of the
United States, 1950–1969. Am J Epidemiol. 111:166–174.
1980.PubMed/NCBI
|
|
7
|
Petrelli NJ, Winer EP, Brahmer J, et al:
Clinical cancer advances 2009: major research advances in cancer
treatment, prevention, and screening-a report from the American
Society of Clinical Oncology. J Clin Oncol. 27:6052–6069. 2009.
View Article : Google Scholar : PubMed/NCBI
|
|
8
|
Hellenic Statistical Authority: Number of
deaths; 2008. http://www.statistics.gr/portal/page/portal/ESYE.
Accessed November 10, 2010.
|
|
9
|
Mandelbrot BB and Taqqu M: Robust R/S
analysis of long run serial correlation. B Int Stat Inst.
48:50–104. 1979.
|
|
10
|
Moody J and Wu L: Improved estimates for
the rescaled range and Hurst exponents. In: Neural Networks in
Financial Engineering. Proceedings of the 3rd International
Conference on Neural Networks in the Capital Markets. Refenes A-P,
Abu-Mostafa Y, Moody J and Weigend A: World Scientific; London: pp.
537–553. 1996
|
|
11
|
Abarbanel HDI, Brown R, Sidorowitch JJ and
Tsimring LS: The analysis of observed chaotic data in physical
systems. Rev Mod Phys. 65:1331–1392. 1993. View Article : Google Scholar
|
|
12
|
Huang NE, Shen Z, Long SR, Wu MC, Shih HH
and Zheng Q: The empirical mode decomposition and the Hilbert
spectrum for nonlinear and non-stationary time series analysis.
Proc R Soc Lond. 454:903–995. 1998. View Article : Google Scholar
|
|
13
|
Tong H: Nonlinear Time Series Analysis.
Encyclopedia of Biostatistics. Armitage P and Colton T: Wiley; New
York, NY: 2005, View Article : Google Scholar
|
|
14
|
Makridakis S, Wheelright SC and McGee VE:
Forecasting: Methods and Applications. 2nd edition. Wiley; New
York, NY: 1983
|
|
15
|
Brandstater A and Swinney HL: Strange
attractors in weakly turbulent Couette-Taylor flow. Phys Rev A.
35:2207–2220. 1987. View Article : Google Scholar : PubMed/NCBI
|
|
16
|
Havstad JW and Ehlers CL: Attractor
dimension of nonstationary dynamical systems from small data sets.
Phys Rev A. 39:845–853. 1989. View Article : Google Scholar : PubMed/NCBI
|
|
17
|
Liebovitch LS and Toth T: A fast algorithm
to determine fractal dimensions by box counting. Phys Lett A.
141:386–390. 1989. View Article : Google Scholar
|
|
18
|
Briggs K: An improved method for
estimating Liapunov exponents of chaotic time series. Phys Lett A.
151:27–32. 1990. View Article : Google Scholar
|
|
19
|
Brown R: Calculating Lyapunov exponents
for short and/or noisy data sets. Phys Rev E. 47:3962–3969. 1993.
View Article : Google Scholar : PubMed/NCBI
|
|
20
|
Kantz H: A robust method to estimate the
maximal Lyapunov exponent of a time series. Phys Lett A. 185:77–87.
1994. View Article : Google Scholar
|
|
21
|
Hauser M: Semiparametric and nonparametric
testing for long memory: A Monte Carlo study. Empirical Econ.
22:247–271. 1997. View Article : Google Scholar
|
|
22
|
Lo AW: Long term memory in stock market
prices. Econometrica. 59:1279–1313. 1991. View Article : Google Scholar
|
|
23
|
Mandelbrot BB: Statistical methodology for
nonperiodic cycles: from the covariance to R/S analysis. Annals of
Economic and Social Measurement. Berg SV: NBER; Cambridge, MA: pp.
259–290. 1972
|
|
24
|
Helfenstein U: The use of transfer
function models, intervention analysis and related time series
methods in epidemiology. Int J Epidemiol. 20:808–815. 1991.
View Article : Google Scholar : PubMed/NCBI
|
|
25
|
Meslé F, Shkolnikov V and Vallin J:
Mortality by cause in the USSR in 1970–1987: the reconstruction of
time series. Eur J Popul. 8:281–308. 1992.
|
|
26
|
Anderson RF: Temporal trends of cancer
mortality in eastern New England compared to the nation, 1950–1975.
Soc Sci Med. 19:749–757. 1984.PubMed/NCBI
|
|
27
|
Stroup DF, Thacker SB and Herndon JL:
Application of multiple time series analysis to the estimation of
pneumonia and influenza mortality by age 1962–1983. Stat Med.
7:1045–1059. 1988.PubMed/NCBI
|
|
28
|
GLOBOCAN 2008-IARC: Section of cancer
information. http://globocan.iarc.fr/factsheets/populations/factsheet.asp?uno=900.
Accessed November 20, 2011.
|
|
29
|
Menotti A, Kromhout D, Blackburn H, Jacobs
D and Lanti M: Forty-year mortality from cardiovascular diseases
and all causes of death in the US Railroad cohort of the Seven
Countries Study. Eur J Epidemiol. 19:417–424. 2004.PubMed/NCBI
|
|
30
|
Boyle P and Ferlay J: Cancer incidence and
mortality in Europe, 2004. Ann Oncol. 16:481–488. 2005. View Article : Google Scholar : PubMed/NCBI
|
|
31
|
Ferlay J, Autier P, Boniol M, Heanue M,
Colombet M and Boyle P: Estimates of the cancer incidence and
mortality in Europe in 2006. Ann Oncol. 18:581–592. 2007.
View Article : Google Scholar : PubMed/NCBI
|
|
32
|
Ferlay J, Parkin DM and Steliarova-Foucher
E: Estimates of cancer incidence and mortality in Europe in 2008.
Eur J Cancer. 46:765–781. 2010. View Article : Google Scholar : PubMed/NCBI
|
|
33
|
Ferlay J, Shin HR, Bray F, Forman D,
Mathers C and Parkin DM: Estimates of worldwide burden of cancer in
2008: GLOBOCAN 2008. Int J Cancer. 127:2893–2917. 2010. View Article : Google Scholar : PubMed/NCBI
|