Introduction
The oncogenic mechanisms associated with colorectal
cancer still remain largely unknown, however, the hypothesis of an
‘adenoma-cancer sequence’ is now widely accepted (1,2). In
total, >80% of all colorectal cancers are derived from adenomas,
and the endoscopic resection of colorectal adenomas may lower the
incidence of colorectal cancer by 76–90% (3). Therefore, the incidence of colorectal
cancer may be decreased markedly by improving diagnostic and
treatment methods (4). The majority
of colorectal adenomas exhibit no symptoms and are commonly
identified by chance during colonoscopy. At present, colonoscopy
represents the most effective method for the diagnosis of
colorectal adenoma (5). However,
colonoscopy often causes a feeling of pressure, bloating or
cramping at various times during the procedure. In addition, the
diagnosis of colorectal cancer is often missed using this method.
Therefore, the identification of an easy to perform screening
method, associated with reduced patient suffering and a high rate
of accuracy, is extremely important. Surface-enhanced laser
desorption/ionization time-of-flight mass spectrometry
(SELDI-TOF-MS) is a newly developed comparative proteomic
technology (6,7) and a number of studies have identified
a promising role for the technology in screening cancer markers
(8–10). In the present study, SELDI-TOF-MS
was used to analyze the serum protein fingerprint of colorectal
adenoma patients and compare it with that of healthy control
individuals, in order to identify specific serum protein biomarkers
associated with colorectal adenoma.
Materials and methods
Participants
The present study was performed between September
2011 and May 2012 at the Department of Gastroenterology, Renmin
Hospital of Wuhan University (Hubei, China). A total of 100
non-related individuals were analyzed. Of these, 54 (54%) were male
and 46 (46%) were female. The individuals were separated into the
colorectal adenoma group, consisting of 50 patients (average age,
51.3±4.5 years) who were diagnosed with colorectal adenoma using
colonoscopy (all confirmed with pathology), and the control group,
consisting of 50 healthy individuals (average age, 53.8±5.6 years).
The groups were matched by age and gender. Patients with a history
of colon surgery and malignant colon tumors were rejected. All
participants were of Chinese ethnicity. The study was approved by
the ethics committee of Renmin Hospital. Written informed consent
was obtained from all patients.
Patient samples and protein
profiling
The 3-cyclohexylamine-1-propane sulfonic acid
(CHAPS), 1,4-dithiothreitol (DDT), sodium acetate (NaAC), sinapic
acid (SPA), acetonitrile (CAN) and trifluoroacetate (TFA) were
purchased from Sigma-Aldrich (St. Louis, MO, USA). U9 buffer [9 M
urea, 2% CHAPS and 1% DDT, (pH 9.0)], WCX buffer [50 mM NaAC (pH
4.5)], SPA saturated solution (100% saturated solution and 1% TFA),
magnetic beads, Au/steel chips and SELDI-TOF-MS were all purchased
from Ciphergen Biosystems, Inc. (Fremont, CA, USA).
Venous blood (5 ml) was obtained from each patient
under fasting conditions in the morning, placed into a dry tube and
left to stand for 4 h. Following this, the samples were centrifuged
at 2,504 × g at 4°C for 10 min, then the supernatant was removed
and centrifuged again at 626 × g for 10 min. Next, 10 μl was
removed from each sample and placed into a 1.5-ml centrifuge tube.
U9 buffer (20 μl) was added and the sample was centrifuged
at 4°C for 30 min to degenerate the protein.
To determine the most appropriate chip for this
study, various chemical chips, WCX2 (weak cation), SAX2 (strong
anion) and IMAC (chelated with metallic ions), were utilized to
test the samples. Following a comparison, the WCX2 chip was found
to combine with the largest number of different proteins and
revealed the most protein peaks with a stable fingerprint,
therefore, WCX2 (weak cation) was selected for this analysis.
Magnetic beads (100 μl) were added to a
200-μl PCR tube and incubated on a magnetic platform for 1
min. Following this, the supernatant was eliminated. Next, 100
μl WCX buffer was added to pre-activate the magnetic beads
for 5 min. The procedures were then repeated once more. Following
this, 10 μl treated serum sample was added to the activated
magnetic beads, mixed well and incubated at room temperature for 30
min and on a magnetic platform for 1 min. The supernatant was
eliminated and 100 μl WCX buffer was added to elude the WCX2
magnetic beads. The procedures were then repeated again once more.
Next, 10 μl eluent (1% TFA) was added and 1 μl
protein-rich eluent and 1 μl SPA saturated solution were
applied to the Au/steel chip. The chips were air-dried and analyzed
by a chip reader.
The PBS II ProteinChip reader (Ciphergen Biosystems,
Inc.) was used to analyze the Au/steel chip. The reader was
calibrated daily using a standard polypeptide to ensure a system
quality error value under 0.1%. The acquired raw data was converted
by the computer to a protein fingerprint. Ciphergen protein chip
3.0 software (Ciphergen Biosystems, Inc.) was used to calibrate the
data to ensure consistency between the ionic intensity and
molecular mass. The parameter settings of the protein reader during
chip analysis were as follows: laser intensity, 230; detection
sensitivity, 8; range of optimized molecular weight, 3–50 kDa; and
highest molecular weight, 200 kDa. In total, fifty spots were
collected for each sample. The x-coordinate of the mass spectrum
represented the mass-to-charge ratio and the y-coordinate
represented the relative content of the protein.
Statistical analysis
The statistical analysis was performed using the
Biomarker Wizard software (Ciphergen Biosystems, Inc.). The
difference in protein content with the same mass-to-charge ratio
between the two groups was described with the peaks and presented
as a P-value. In addition, data were processed using SPSS for
Windows version 17.0 (SPSS Inc., Chicago, IL, USA). Data were
compared between the two groups by t-test, and the Chi square test
was used to count the data. P<0.05 was considered to indicate a
statistically significant difference.
Results
Comparison of age and gender
No significant difference was observed in age and
gender between the adenoma and normal control groups.
Screening of protein peaks in colorectal
adenoma serum
The protein molecular weight was set between 1,500
and 20,000 Da and a protein peak lower than 1,500 Da was
automatically eliminated to avoid the effects of SPA and other
substances. Data were processed using the Biomarker Wizard, which
identified 20 protein peaks with differences in intensity between
the adenoma and control samples, including peaks at 8,565.84,
5,910.50, 8,694.51, 8,473.00, 4,355.27, 14,036.25, 4,480.67,
6,843.43, 3,324.01, 11,710.32, 4,099.27, 6,636.65, 12,866.68,
16,541.76, 13,754.56, 8,150.09, 14,976.34, 6,438.44, 2,489.73 and
7,976.21 Da. Colorectal adenoma samples were found to exhibit six
low protein peaks compared with the control samples, where these
peaks were detected at high intensity levels (Table I).
 | Table IProtein fingerprint of serum protein
in colorectal adenoma and control samples. |
Table I
Protein fingerprint of serum protein
in colorectal adenoma and control samples.
| | Average intensity of
protein peak (mean±SD) |
|---|
|
|---|
| Protein peak
(Da) | P-value | Colorectal
adenoma | Control |
|---|
| 5,910.50* | 0.0002 | 2.53±0.34 | 14.55±1.65 |
| 8,565.84 | 0.0003 | 12.63±1.47 | 5.09±0.53 |
| 8,694.51 | 0.0003 | 17.02±1.99 | 7.11±0.78 |
| 8,473.00 | 0.0157 | 1.37±0.12 | 0.96±0.10 |
| 4,355.27 | 0.0157 | 4.66±0.49 | 2.96±0.33 |
| 14,036.25 | 0.0178 | 1.97±0.21 | 1.16±0.14 |
| 4,480.67* | 0.0120 | 12.50±1.32 | 15.12±1.49 |
| 6,843.43 | 0.0129 | 3.76±0.38 | 2.39±0.27 |
| 3,324.01 | 0.0132 | 7.22±0.81 | 5.42±0.66 |
| 11,710.32 | 0.0132 | 6.05±0.71 | 4.03±0.52 |
| 4,099.27* | 0.0174 | 5.48±0.49 | 8.09±0.77 |
| 6,636.65 | 0.0188 | 34.17±3.63 | 29.90±3.15 |
| 12,866.68 | 0.0223 | 0.87±0.07 | 0.54±0.04 |
| 16,541.76* | 0.0223 | 0.87±0.06 | 1.25±0.09 |
| 13,754.56 | 0.0285 | 4.03±0.33 | 2.66±0.32 |
| 8,150.09* | 0.0301 | 3.97±0.42 | 5.52±0.64 |
| 14,976.34 | 0.0301 | 0.33±0.05 | 0.03±0.04 |
| 6,438.44 | 0.0358 | 16.26±1.55 | 10.12±1.12 |
| 2,489.73 | 0.0317 | 6.18±0.78 | 4.97±0.52 |
| 7,976.21* | 0.0317 | 11.43±1.36 | 16.96±1.75 |
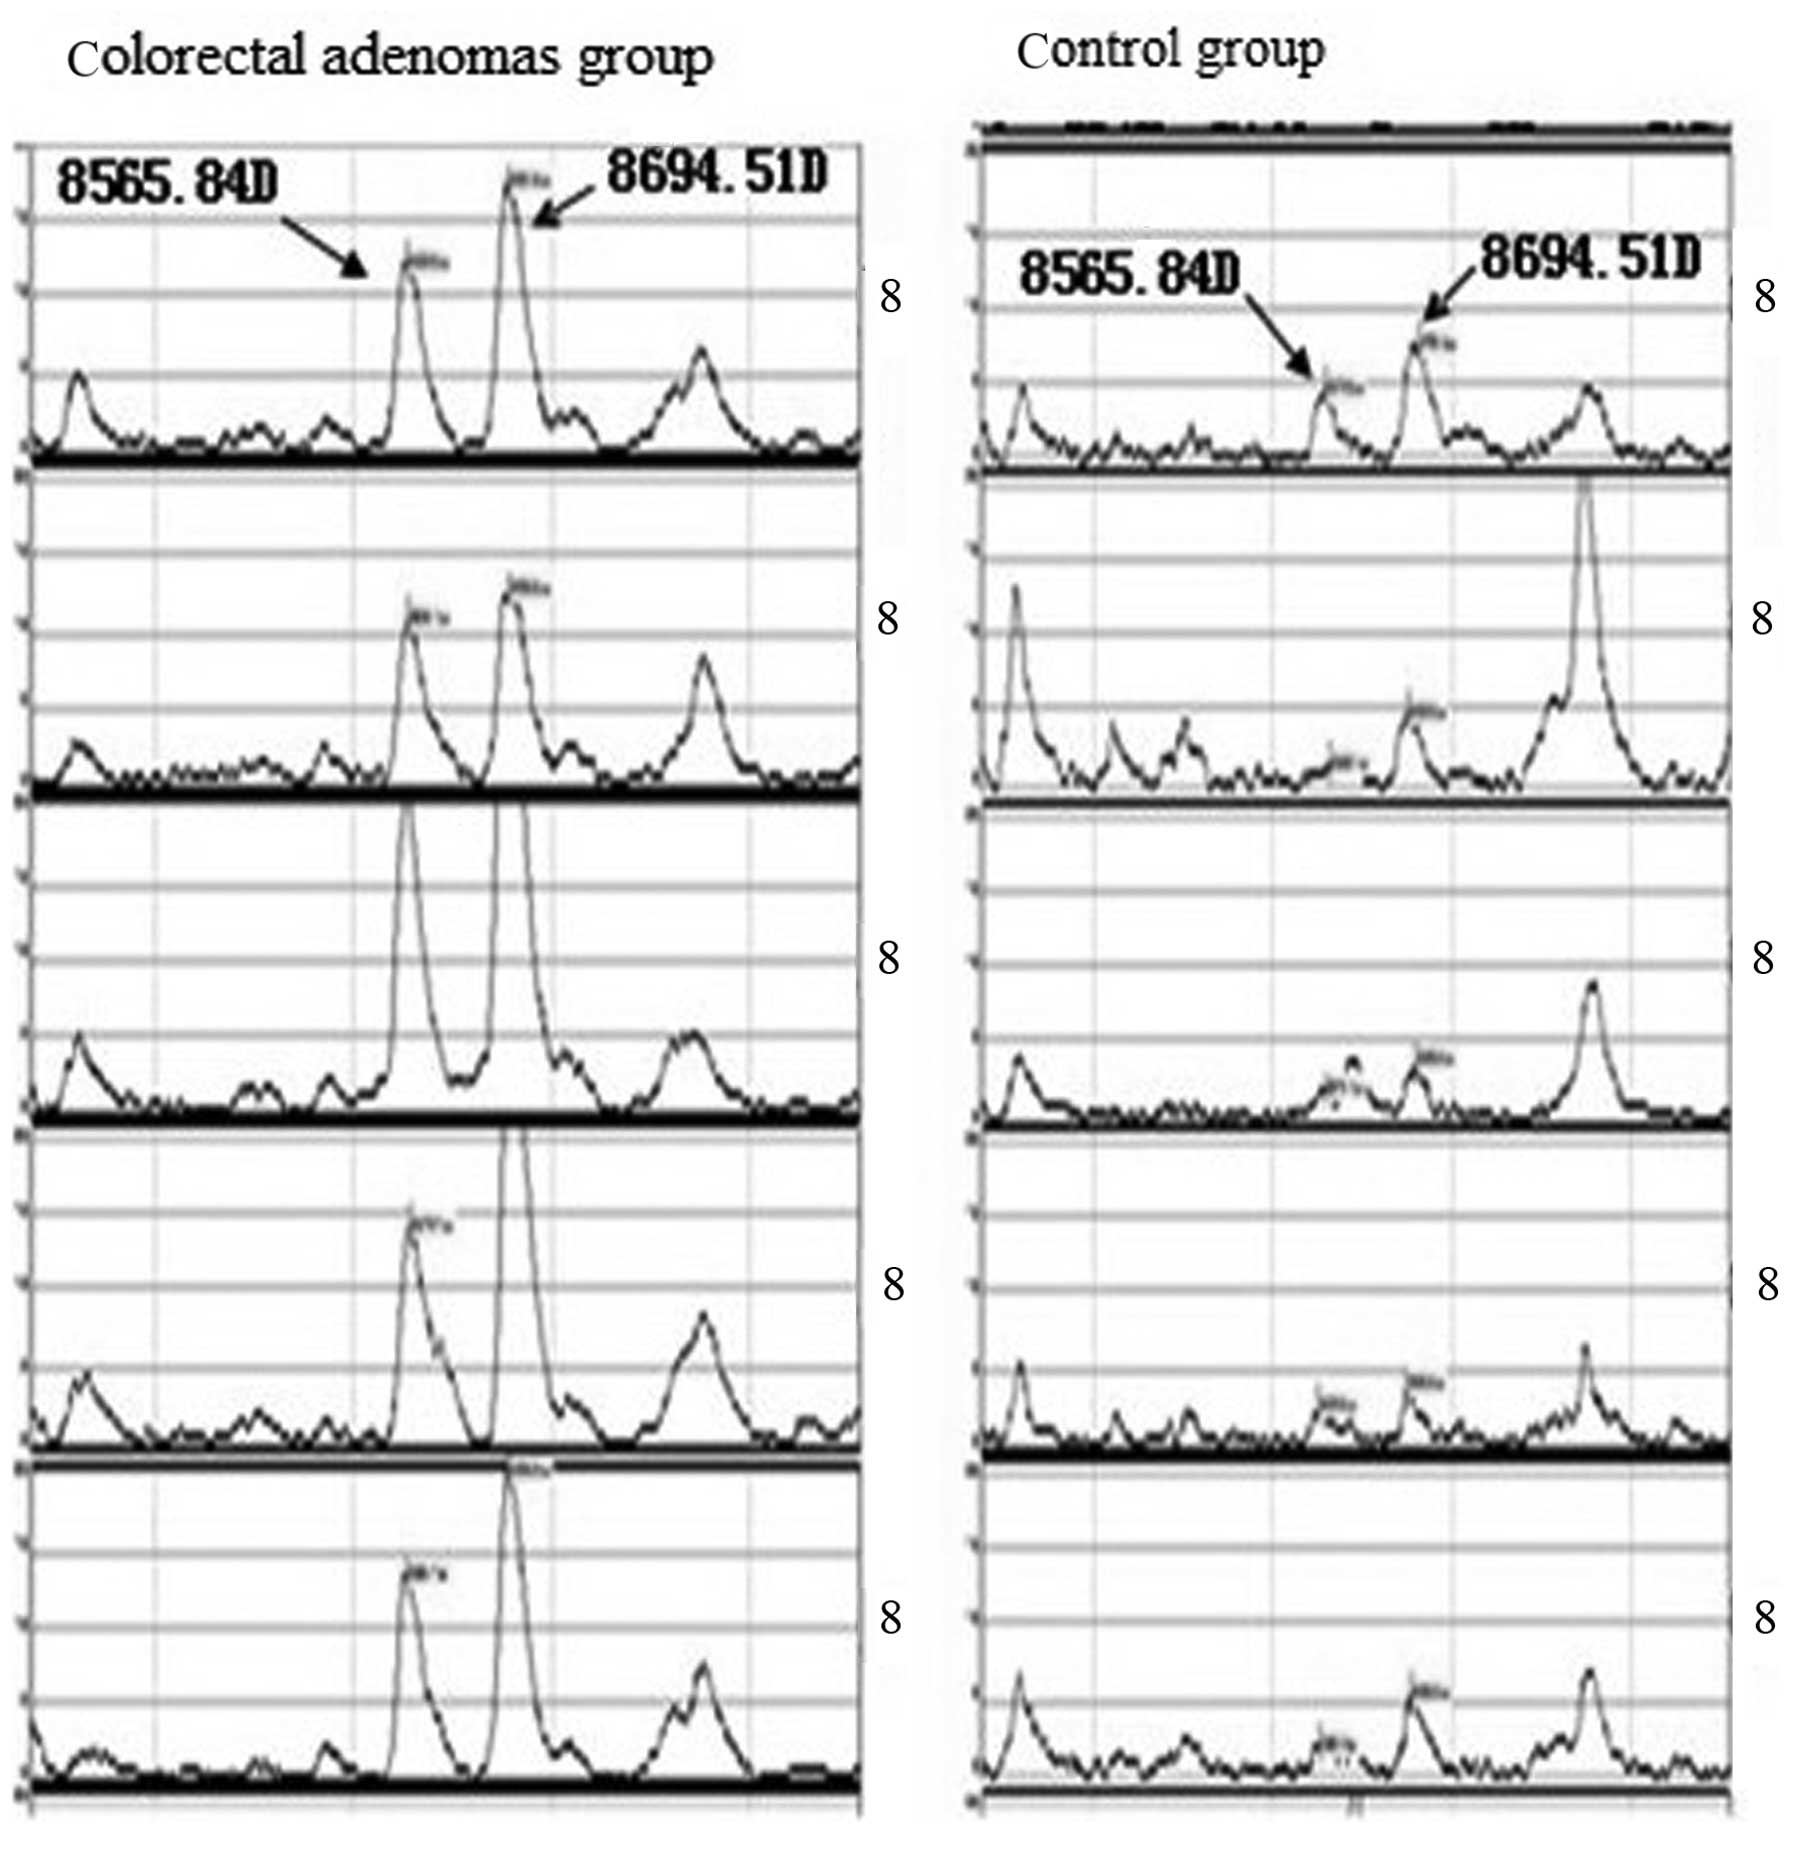
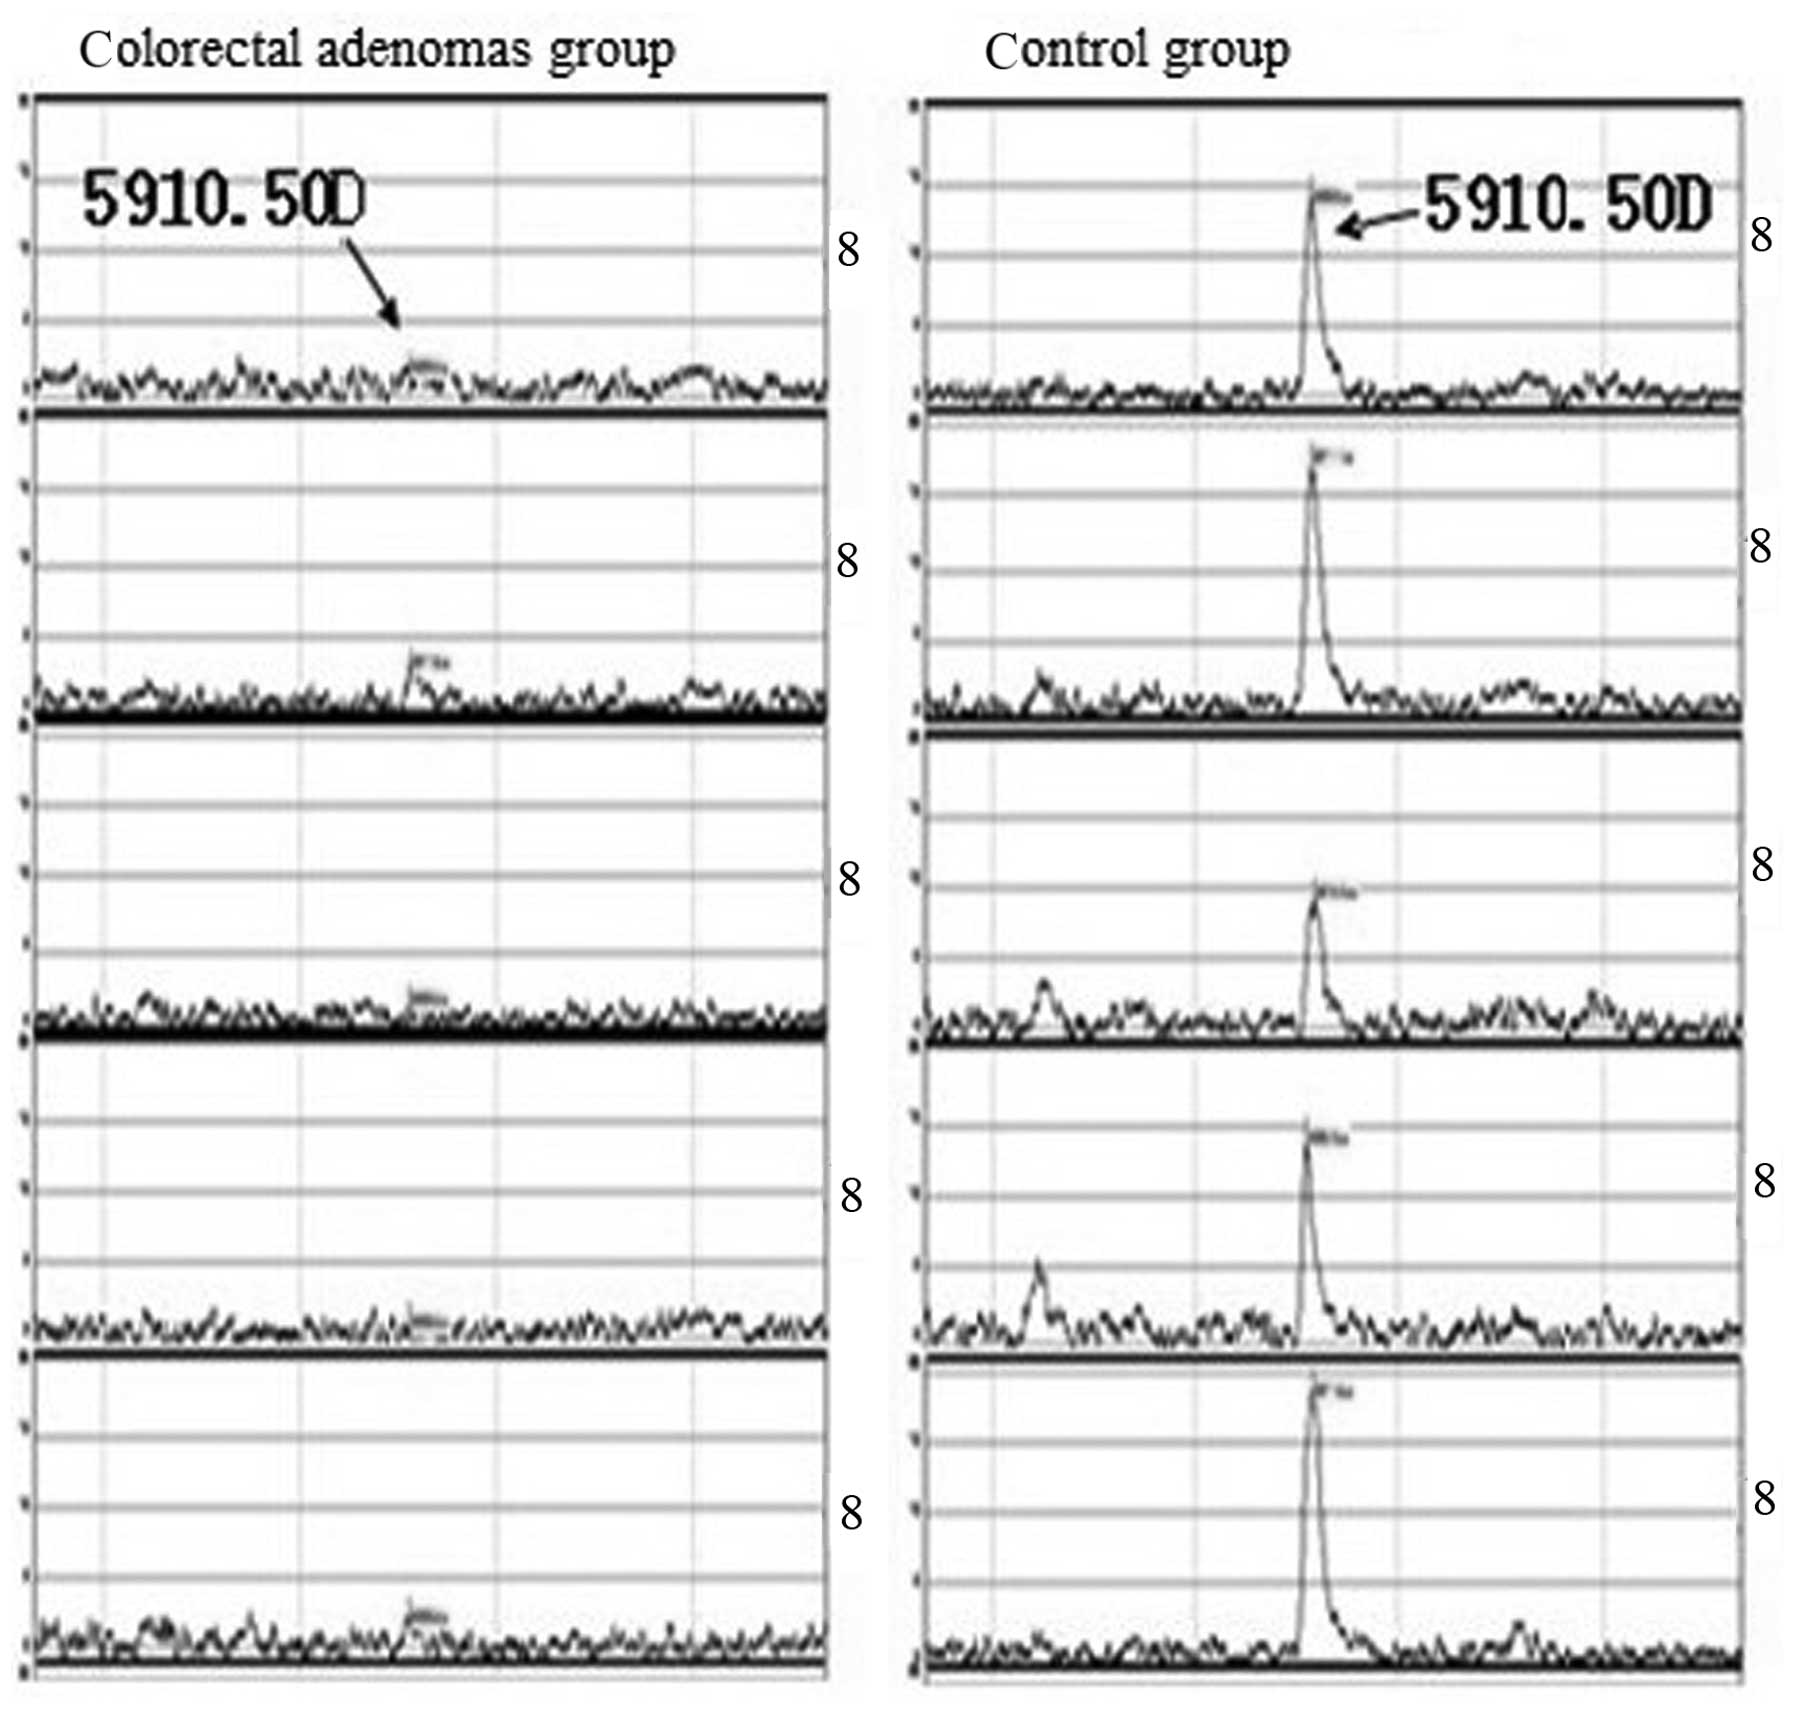
A statistically significant difference in peak
intensity between the two groups was identified for three peaks,
8,565.84, 5,910.50 and 8,694.51 Da, in which 8,565.84 and 5,910.50
Da were expressed at high levels in colorectal adenoma patients and
low levels in healthy subjects. By contrast, expression of the
5,910.50 Da peak was low in adenoma patients and high in normal
control individuals (Table I and
Figs. 1 and 2).
Discussion
In recent years, the field of proteomics has
developed rapidly. Clinical proteomics primarily focuses on the
identification of protein disease biomarkers in body fluids, cells
and tissues (11,12). SELDI-TOF-MS is a newly developed
comparative proteomic technology and its clinical application is
extensive (13–15). SELDI-TOF-MS has been used to detect
small-molecule proteins that correlate closely with oncogenesis
(16). A previous study by Grizzle
et al(17) demonstrated that
performing SELDI-TOF-MS using standardized instruments and
controlled serum quality represents a promising approach for the
detection of cancer during its early-stages.
Despite a number of studies on the use of
SELDI-TOF-MS for the detection of colorectal cancer, the incidence
of this cancer type has not been decreased significantly. The
‘adenoma-cancer sequence’ is a well-known hypothesis, which states
that the detection of an adenoma followed by a resection may
markedly reduce the incidence of colorectal cancer (18,19).
In the present study, SELDI-TOF-MS was performed in
combination with the use of the WCX2 protein chip to analyze and
compare the serum protein fingerprint of 50 colorectal adenoma
patients with 50 healthy control individuals. Using the Biomarker
Wizard, twenty protein peaks were identified to vary between the
two groups, including seven peaks with a lower protein content in
the adenoma group, of which, the 3 protein peaks, 8,565.84,
5,910.50 and 8,694.51 Da, were found show the greatest significant
difference. Specifically, the 8,565.84 and 5,910.50 Da peaks were
found to be expressed at high levels in the colorectal adenoma
patients and at low levels in healthy subjects. By contrast, the
expression of the 5,910.50 Da peak was low in the adenoma patients
and high in the control participants. Based on these observations,
we hypothesize that the expression of the 8,565.84 and 8,694.51 Da
peaks may correlate with an oncogene, while the 5,910.50 Da peak
may be associated with a tumor suppressor gene. However, further
confirmation of these results must be acquired. The identification
of the three protein peaks, 8,565.84, 5,910.50 and 8,694.51 Da, is
of great significance and provides insight into the identification
of novel markers specific to colorectal adenoma.
In comparison to a colonoscopy, SELDI-TOF-MS
represents a minimally-invasive approach, requiring a venous blood
sample only. SELDI-TOF-MS represents a promising technology for the
early-stage diagnosis of colorectal adenoma and is associated with
a number of advantages, including a high flux, no sample processing
and the ability to identify small-molecule proteins. Future
utilization of this technology to screen for colorectal adenoma in
healthy populations is likely to significantly decrease the
incidence of colorectal cancer.
Acknowledgements
The present study was supported, in
part, by grants from the Natural Science Foundation of Hubei
Province (nos. 302-132139 and 302-131891).
References
|
1
|
Hasan N, Pollack A and Cho I: Infectious
causes of colorectal cancer. Infect Dis Clin North Am.
24:1019–1039. 2010. View Article : Google Scholar
|
|
2
|
Thirlwell C, Will OC, Domingo E, et al:
Clonality assessment and clonal ordering of individual neoplastic
crypts shows polyclonality of colorectal adenomas.
Gastroenterology. 138:1441–1454. 2010. View Article : Google Scholar : PubMed/NCBI
|
|
3
|
Winawer SJ, Zauber AG, Ho MN, et al:
Prevention of colorectal cancer by colonoscopic polypectomy. The
National Polyp Study Workgroup. N Engl J Med. 329:1977–1981. 1993.
View Article : Google Scholar : PubMed/NCBI
|
|
4
|
Arber N, Spicak J, Rácz I, et al:
Five-year analysis of the prevention of colorectal sporadic
adenomatous polyps trial. Am J Gastroenterol. 106:1135–1146.
2011.PubMed/NCBI
|
|
5
|
Leung WK, Tang V and Lui PC: Detection
rates of proximal or large serrated polyps in Chinese patients
undergoing screening colonoscopy. J Dig Dis. 13:466–471. 2012.
View Article : Google Scholar : PubMed/NCBI
|
|
6
|
Hortin GL: The MALDI-TOF mass
spectrometric view of the plasma proteome and peptidome. Clin Chem.
52:1223–1237. 2006. View Article : Google Scholar : PubMed/NCBI
|
|
7
|
Terracciano R, Pasqua L, Casadonte F, et
al: Derivatized mesoporous silica beads for MALDI-TOF MS profiling
of human plasma and urine. Bioconjug Chem. 20:913–923. 2009.
View Article : Google Scholar : PubMed/NCBI
|
|
8
|
Zheng SZ and Zou SQ: The application of
comparative proteomics in study of tumor marker. Zhong Guo Pu Wai
Ji Chu Yu Lin Chuang Za Zhi. 12:147–149. 2008.
|
|
9
|
Gast MC, Schellens JH and Beijnen JH:
Clinical proteomics in breast cancer: a review. Breast Cancer Res
Treat. 116:17–29. 2009. View Article : Google Scholar : PubMed/NCBI
|
|
10
|
Ahram M: An introduction into proteomics
and its clinical applications. Saudi Med J. 28:499–507.
2007.PubMed/NCBI
|
|
11
|
Xu SY, Liu Z, Ma WJ, Sheyhidin I, Zheng ST
and Lu XM: New potential biomarkers in the diagnosis of esophageal
squamous cell carcinoma. Biomarkers. 14:340–346. 2009. View Article : Google Scholar : PubMed/NCBI
|
|
12
|
Issaq HJ, Fox SD, Chan KC and Veenstra TD:
Global proteomics and metabolomics in cancer biomarker discovery. J
Sep Sci. 34:3484–3492. 2011. View Article : Google Scholar : PubMed/NCBI
|
|
13
|
Schipper R, Loof A, de Groot J, Harthoorn
L, Dransfield E and van Heerde W: SELDI-TOF-MS of saliva:
methodology and pre-treatment effects. J Chromatogr B Analyt
Technol Biomed Life Sci. 847:45–53. 2007. View Article : Google Scholar : PubMed/NCBI
|
|
14
|
Fuchs B, Schiller J, Süss R, et al:
Analysis of stem cell lipids by offline HPTLC-MALDI-TOF MS. Anal
Bioanal Chem. 392:849–860. 2008. View Article : Google Scholar : PubMed/NCBI
|
|
15
|
Sun CY, Zang YC, San YX, Sun W and Zhang
L: Proteomic analysis of clear cell renal cell carcinoma.
Identification of potential tumor markers. Saudi Med J. 31:525–532.
2010.PubMed/NCBI
|
|
16
|
Schipper R, Loof A, de Groot J, Harthoorn
L, van Heerde W and Dransfield E: Salivary protein/peptide
profiling with SELDI-TOF-MS. Ann NY Acad Sci. 1098:498–503. 2007.
View Article : Google Scholar : PubMed/NCBI
|
|
17
|
Grizzle WE, Semmes OJ, Basler J, et al:
The early detection research network surface-enhanced laser
desorption and ionization prostate cancer detection study: A study
in biomarker validation in genitourinary oncology. Urol Oncol.
22:337–343. 2004. View Article : Google Scholar
|
|
18
|
Brenner H, Chang-Claude J, Rickert A,
Seiler CM and Hoffmeister M: Risk of colorectal cancer after
detection and removal of adenomas at colonoscopy: population-based
case-control study. J Clin Oncol. 30:2969–2976. 2012. View Article : Google Scholar : PubMed/NCBI
|
|
19
|
Rüth S, Spatz J and Anthuber M: Colorectal
adenoma: pro conventional/laparoscopic resection. Chirurg.
82:520–525. 2011.(In German).
|