Introduction
Gastric cancer mortality rates remain high despite
advances in treatment. The theory that cancer stem cells play a
role in the pathogenesis of gastric cancer (1) has opened up new avenues of diagnosis
and treatment. The homeobox protein Nanog is a significant
transcription factor in the maintenance of self-renewal and the
pluripotency of embryonic stem cells (2–4). High
expression levels of Nanog have been observed in embryonic germ
cell tumors and certain somatic tumors (5). There are numerous studies
demonstrating that Nanog is significant in the formation of solid
tumors, as well as clinical data showing that the expression of
Nanog protein in tumors is higher compared with corresponding
adjacent tissues. The expression of Nanog is also closely
correlated with the clinical classification of gastric carcinoma
and the status and degree of lymph node saturation by the invasion
of gastric cancer cells. Patients with an overexpression of Nanog
have a poor prognosis (6). Chen
et al reported that there may be gastric cancer stem cells
in the gastric cancer tissues that express Nanog (7). These results demonstrated that the
expression level of Nanog in gastric cancer tissues was higher
compared with paracancerous tissues, and furthermore, that the
expression of Nanog was correlated with tumor differentiation and
malignancy. These findings also indicate the potential role of
Nanog in the diagnosis and prognosis of gastric carcinoma. Cancer
stem cells are responsible for the tumorigenicity of tumor cells
and lead to tumor recurrence and metastasis (8). Gastric cancer stem cells have the
ability to promote the formation of gastric cancer and maintain the
self-renewal and constant proliferation of gastric cancer stem
cells (9), suggesting that Nanog
may be a new molecular marker for the diagnosis of gastric
carcinoma. Previous studies have used qPCR to reveal that the
expression levels of Nanog, Sox2, Lin28 and Oct-4 in tumor stem
cells were different from other tumor cells and that the
performance of miRNA inhibition technology in the two cell types
also varied, suggesting that the two cell types had differing
molecular mechanisms (10).
Designing a specific miRNA method for cancer stem cells may be more
specific and effective than current approaches (10). In the present study, RNA
interference (RNAi) technology was used to inhibit the expression
of the Nanog gene to study the effect on the tumor biological
behavior of the gastric cancer cell line SGC-7901; the aim was to
provide an experimental basis for the application of the RNAi
technique as a gene therapy method for gastric cancer.
Materials and methods
Materials
The gastric cancer cell line, SGC-7901,
Escherichia coli strain DH5α and plasmid pGenesil-1 were
gifts from Dr Xiang Tingxiu (The First Affiliated Hospital of
Chongqing Medical University, Chongqing, China). The annealing
buffer contained 10 mM Tris (pH 8.0), 50 Mm NaCl and 1 Mm EDTA
dissolved in 50 ml ddH2O, which was then filtered to
remove bacteria and stored at 4°C. The RNAiso Plus,
PrimeScript® RT Reagent kit, Premix Taq® Version 2,
restriction endonucleases BamHI and HindIII and T4
DNA ligase were acquired from Takara (Otsu, Japan). The
E.Z.N.A.® Gel Extraction kit, E.Z.N.A Plasmid Mini kit I
and E.Z.N.A. Endo-free Plasmid Mini kit I were purchased from Omega
Bio-Tek (Norcross, GA, USA). Tryptone and yeast powder were
acquired from Oxoid (Basingstoke, UK), while the RPMI 1640 was
purchased from Hyclone (Logan, UT, USA) and the fetal bovine serum
was from Hangzhou Sijiqing Biological Engineering Materials Co.,
Ltd. (Hangzhou, China). Trypsin, EDTA and the One-Step Competent
Cell Preparation (SSCS) kit were purchased from Sangon Biotech Co.,
Ltd. (Shanghai, China) and lipofectamine 2000 was obtained from
Invitrogen (Shanghai, China). The Nanog rabbit monoclonal antibody
was supplied by Epitomics (Burlingame, CA, USA). The RIPA lysis
buffer (strong), PMSF, SDS-PAGE Gel Preparation kit, BCA Protein
Assay kit, BeyoECL Plus, HRP-labeled goat anti-rabbit IgG (H+L) and
western primary antibody dilution solution were obtained from the
Beyotime Institute of Biotechnology (Shanghai, China). Anti-β-actin
was purchased from Beijing Biosynthesis Biotechnology Co., Ltd.
(Beijing, China), while Cell Counting kit-8 was bought from
Shanghai R&S Biotechnology Co., Ltd. (Shanghai, China), the
Matrigel Basement Membrane Matrix was from BD Biosciences (San
Jose, CA, USA) and the 24-well Millicell culture plates were from
Milipore (Billerica, MA, USA).
Design and synthesis of shRNA and PCR
primers
First, the mRNA sequence of the human Nanog gene was
identified in the NCBI gene bank. Next, according to the design
principles of shRNA, three small interfering RNA (siRNA) targeting
sequences with 21 bases were designed using online design software
(http://zh.invitrogen.com/site/cn/zh/home/brands/ambion.html),
as well as a 21-base unrelated sequence as a negative control. TTCG
was used as a stem-loop to connect the siRNA target sequences and
their reverse complementary sequences to form a hairpin structure,
termed the shRNA. In addition, the transcriptional termination
signal TTTTTA was added at the 3′-end. Finally the enzyme
restriction sites were joined with BamHI at the 5′-end and
HindIII at the 3′-end. A BLAST search was performed with the
sequences in the NCBI database to ensure the specificity of the
three shRNA sequences (Table I).
The three shRNA sequences and the negative control were sent to
Invitrogen. According to the mRNA sequence of human Nanog in the
NCBI GenBank (http://www.ncbi.nlm.nih.gov/nuccore/NM_024865.2), a
pair of short fragment PCR primers were designed with the primer
design software Primer Premier 5 and Oligo 6 and then synthesized
by Takara (Table II).
 | Table I.Design of shRNA. |
Table I.
Design of shRNA.
| Target sequences | Nucleotide
sequences |
|---|
| 1.
GCTTTGAAGCATCCGACTGTA |
5′-GATCCCGCTTTGAAGCATCCGACTGTATTCGTACAGTCGGATGCTTCAAAGCTTTTTA-3′ |
|
5′-AGCTTAAAAAGCTTTGAAGCATCCGACTGTACGAATACAGTCGGATGCTTCAAAGCGG-3′ |
| 2.
CTGTAAAGAATCTTCACCTAT |
5′-GATCCCGCTGTAAAGAATCTTCACCTATTTCGATAGGTGAAGATTCTTTACAGTTTTTA-3′ |
|
5′-AGCTTAAAAACTGTAAAGAATCTTCACCTATCGAAATAGGTGAAGATTCTTTACAGCGG-3′ |
| 3.
CCTAAACTACTCCATGAACAT |
5′-GATCCCGCCTAAACTACTCCATGAACATTTCGATGTTCATGGAGTAGTTTAGGTTTTTA-3′ |
|
5′-AGCTTAAAAACCTAAACTACTCCATGAACATCGAAATGTTCATGGAGTAGTTTAGGCGG-3′ |
| 4.
GAATCCGCACTACTCCTTACA (The negative control) |
5′-GATCCGAATCCGCACTACTCCTTACATTCGTGTAAGGAGTAGTGCGGATTCTTTTTTA-3′ |
|
5′-AGCTTAAAAAAGAATCCGCACTACTCCTTACACGAATGTAAGG
AGTAGTGCGGATTCG-3′ |
| Table II.PCR primers. |
Table II.
PCR primers.
| Gene | Primer sequence | Product size
(bp) |
|---|
| Nanog | P1:
5′-ACTGTCTCTCCTCTTCCTTCCTC-3′ | |
| P2:
5′-GGTCTTCACCTGTTTGTAGCTG-3′ | 276 |
| β-actin | P3:
5′-ACTGTGCCCATCTACGAGG-3′ | |
| P4:
5′-GAAAGGGTGTAACGCAACTA-3 | 678 |
Construction of shRNA plasmid
The four pairs of oligonucleotide chains were
separately dissolved in annealing solution, making the final
concentration 0.5 g/l. A volume of 20 μl of the up- and
downstream primers for each pair was mixed, then incubated in a
95°C water bath for 5 min, followed by slow cooling to room
temperature until annealing was completed. E.Z.N.A. Plasmid Mini
kit I was used to extract the plasmid pGenesil-1 according to the
manufacturer’s instructions. The pGenesil plasmids were cut by
incubating them with BamHI and HindIII in a 37°C
water bath for 6 h, and then the samples were run on 1% agarose gel
in 1X TAE. Subsequently, the E.Z.N.A. Gel Extraction kit was used
to recycle restriction fragments according to the manufacturer’s
instructions. Protein concentrations were measured with a protein
nucleic acid analyzer (Thermo Fisher Scientific, Waltham, MA, USA),
and T4 DNA ligase was used to connect the shRNA with the plasmid
pGenesil-1 at 16°C overnight. The connected products were
transformed into competent Escherichia coli DH5α, then
bacteria solution was used to coat LB solid medium containing
kanamycin (25 μg/ml), which was incubated at 37°C for 16–20
h. Several monoclonal positive colonies were selected the next day
and transferred into 4 ml LB liquid medium containing kanamycin (25
μg/ml), which was placed in a 37°C, 200 rpm shaker to
cultivate the bacteria for 12–16 h. E.Z.N.A. Plasmid Mini kit I was
used to extract the recombinant plasmid, and enzyme identification
and sequencing results demonstrated that the plasmids were correct,
indicating that the four recombinant plasmids were successfully
constructed. The four recombinant plasmids were named
pshRNA-NanogA, pshRNA-NanogB, pshRNA-NanogC and pshRNA-negative
control.
Culture of SGC-7901 cells and
transfection
A small bottle of SGC-7901 cell suspension was
removed from a −80°C refrigerator, placed in a 37°C water bath and
constantly agitated gently to ensure rapid thawing. The cell
suspension was then transferred to a centrifuge tube, mixed with 2
ml RPMI 1640 medium containing 10% fetal bovine serum and
centrifuged for 5 min at 800 × g. The supernatant was discarded.
The cells were resuspended in 5 ml fresh culture medium containing
10% fetal bovine serum. The cells were transferred into a cell
culture flask and cultured in an incubator at 37°C, with 5% CO2.
The medium was changed once a day and when the SGC-7901 cells were
at 80–90% confluence, the cells were digested with 0.25% trypsin
solution containing 0.01% EDTA. Next, the cells were transferred
into a centrifuge tube, centrifuged at 800 × g for 5 min and
subcultured by 1:2 or 1:3, with approximately one passage every 2–3
days. The third or fourth generation were used for transfection.
One day prior to transfection, the cells were transferred to a
six-well plate, with ∼5×10⁵ cells per well, then stored
in a 37°C, 5% CO2 incubator for one night. The
endotoxin-free recombinant plasmids pshRNA-NanogA, pshRNA-NanogB,
pshRNA-NanogC and pshRNA-negative control were extracted using the
E.Z.N.A. Endo-Free Plasmid Mini Kit I according to the
manufacturer’s instructions. When the SGC-7901 cells were at 80–90%
confluence, the four groups of endotoxin-free recombinant plasmid
were transfected into the cells in a liposome-mediated manner as
follows: i) 4 g plasmid DNA was diluted in 250 μl serum-free
medium and gently mixed; ii) 10 μl Lipofectamine 2000 was
diluted in 250 μl serum-free medium and incubated for 5 min
at room temperature; iii) the diluted DNA was combined with diluted
Lipofectamine 2000 (total volume, 500 μl), then gently mixed
and incubated for 20 min at room temperature; iv) 500 μl
complexes was added to each well containing cells and medium and
mixed gently; and v) the cells were incubated at 37°C in a CO2
incubator. The medium was changed to be medium containing 10% fetal
bovine serum after 4–6 h. The pGenesil-1-transfected and untreated
SGC-7901 cells were used as control groups.
Selection of the recombinant plasmid
group with the highest inhibition rate
The green fluorescence (from plasmid penesil-1 with
the enhanced green fluorescent protein (EGFP) label) of each of the
groups was observed via inverted fluorescence microscopy at 48 h
post-transfection. At 48 h post-transfection, RNAiso Plus was used
to extract total RNA from each of the six groups of SGC-7901 cells,
according to the manufacturer’s instructions. A protein nucleic
acid analyzer was used to detect the purity and concentration of
the RNA in each group, with an A260/A280 nm
ratio of 1.80–2.0 meeting the purity requirements. mRNA to was
converted to cDNA using the PrimeScript RT reagent kit; the
reaction conditions were 37°C for 15 min, followed by 85°C for 5
sec. PCR was performed using Premix Taq Version 2.0, with Nanog
gene primers P1 and P2 and β-actin primers P3 and P4. The reaction
system used a 94°C initial denaturation for 5 min, a 94°C
denaturation for 30 sec, a 53°C primer annealing for 30 sec, a 72°C
extension for 35 sec for 25 cycles and a 72°C extension for 5 min.
The products were run on a 2% agarose gel in 1X TAE, then images
were captured with a Bio-Rad gel imaging instrument and the band
intensity values were analyzed with Quantity One software.
Total protein was extracted from the cells of each
group using RIPA lysis buffer and PMSF at a ratio of 100:1.
Subsequent to protein denaturation, the protein samples were loaded
and run using sodium dodecyl sulfonate-polyacrylamide gel
electrophoresis (SDS-PAGE), followed by electrotransfer at 250 mA
and membrane blocking with blocking buffer for 2 h. The first
antibody, Nanog rabbit monoclonal antibody, was carefully added to
the appropriate western primary antibody dilution solution
(1:7,500), then incubated for one night at 4°C. The first antibody
solution was poured off the membrane, which was then washed four
times for 10 min with TBST buffer. The TBST buffer was then poured
off and the secondary antibody, HRP-labeled goat anti-rabbit IgG
(H+L), was added at the appropriate dilution in TBST buffer
(1:1500), followed by incubation at 37°C for 1 h. The secondary
antibody solution was then poured off the membrane, which was
washed four times for 10 min with TBST buffer. In a dark room,
BeyoECL Plus reagent was added to the PVDF membrane, which was
rocked gently, while band development was observed. When the bands
could be observed clearly, development was stopped by washing with
distilled water for 30 min. Images of the bands on the membrane
were captured with a Bio-Rad gel imaging instrument and the band
intensity values were analyzed with Quantity One software.
Effect of shRNA-NanogA on biological
behavior of SGC-7901 cells
The recombinant plasmid with the highest inhibition
rate was transfected into the SGC-7901 cells in a
liposome-mediated, manner. There were four groups: The
pshRNA-NanogA-transfected group, the pshRNA-negative
control-transfected group, the pGenesil-1-transfected group and the
normal SGC-7901 cell group. The effect on proliferation was
determined by CCK-8, the cell cycle and apoptosis were analyzed via
flow cytometry and the migration and invasion of the SGC-7901 cells
was observed via Transwell tests.
Detection of cell proliferation using
CCK-8
Third or fourth generation cells were digested with
0.25% trypsin containing 0.01% EDTA, and the cells were transferred
into a 96-well plate, with ∼6,000 cells per well. When the cells
reached 70–80% confluence the next day, the four groups of
endotoxin-free recombinant plasmid were transfected into the
SGC-7901 cells in a liposome-mediated manner. The cells were then
stored in a 37°C, 5% CO2 incubator. At 24, 48 and 72 h,
10 μl CCK-8 solution was added to each well (starting volume
of culture media, 100 μl) so that the wells contained the
same volume of culture medium and CCK-8 solution. Wells without
cells were used as blank controls. The 96-well plate was then
incubated for a further 2 h. A microplate reader was used to
determine the absorbance of each group at 450 nm; three wells were
used for each group to calculate the average absorbance value.
Finally, cell proliferation curves were drawn to compare the cell
proliferation of the groups.
Detection of cell migration by Transwell
assay
Four millicell inserts with 8-μm diameter
pores were placed into a 24-well plate. BD Matrigel and serum-free
medium were mixed at a ratio of 1:9 and 100 μl mixture was
coated onto the upper surface of the millicells. Following
incubation at 37°C for 4–5 h, the mixture solidified. The cells
that had been transfected 24 h previously were digested, then
5×10⁵ cells were added into the upper compartment and
RPMI 1640 medium containing 1% fetal bovine serum was used to
supplement the cell suspension to 200 μl. A total of 700
μl RPMI 1640 medium containing 10% fetal bovine serum was
added into the lower compartment and the 24-well plate was placed
in a 37°C, 5% CO2 incubator for 20–24 h. The millicells
were removed and gently washed twice with PBS, using cotton wool
balls to wipe the cells on the upper surface. The cells were fixed
with 4% paraformaldehyde for 20 min, then 0.1% crystal violet
staining solution was added to stain the cells for 5–10 min,
followed by two washes with PBS. When the cells were dry, the
numbers of cells under the microporous membrane were counted using
a microscope.
Detection of cell invasion by Transwell
assay
Four millicell inserts with 8-μm diameter
pores were placed into a 24-well plate. The cells that had been
transfected 24 h previously were digested and 5×10⁵
cells were added into the upper compartment. RPMI 640 medium
containing 1% fetal bovine serum was used to supplement the cell
suspension to 200 μl. A total of 700 μl RPMI 1640
medium containing 10% fetal bovine serum was added into the lower
compartment and the 24-well plate was placed in a 37°C, 5%
CO2 incubator for 20–24 h. The millicells were removed
and gently washed twice with PBS, using cotton wool balls to wipe
the cells on the upper surface. The cells were fixed with 4%
paraformaldehyde for 20 min, then 0.1% crystal violet staining
solution was added to stain the cells for 5–10 min, followed by two
more washes with PBS. When the cells were dry, the numbers of cells
under the micro-porous membrane were counted using a
microscope.
Cell cycle analysis by flow
cytometry
Third or fourth generation cells were inoculated
into a six-well plate and incubated at 37°C, with 5% CO2
overnight. When the cells were at 70–80% confluence, they were
transfected with the four groups of endotoxin-free recombinant
plasmids in a liposome-mediated manner. Subsequent to 48 h, the
cells were washed twice with pre-cooled PBS, digested with 0.25%
trypsin containing 0.01% EDTA and transferred into EP tubes. The
cells were then centrifuged for 5 min at 4°C using 8,000 × g and
the supernatant was discarded. The cells were resuspended in 1 ml
pre-cooled PBS, then centrifuged at 4°C using 8,000 × g for 5 min
and the supernatant was discarded. The cells were fixed with 70%
ice-cold ethanol and then incubated at 4°C for 24 h. The cell cycle
of these cells was analyzed by flow cytometry the next day. Each
experiment was repeated three times for each group and the results
underwent statistical analysis.
Detection of cell apoptosis by flow
cytometry
Third or fourth generation cells were inoculated
into a six-well plate and incubated at 37°C, with 5% CO2
overnight. When the cells were at 70–80% confluence, they were
transfected with the four groups of endotoxin-free recombinant
plasmids in a liposome-mediated manner. Subsequent to 48 h, the
cells were washed twice with pre-cooled PBS, digested with 0.25%
trypsin (without EDTA) and transferred into EP tubes. The cells
were then centrifuged for 5 min at 4°C using 8,000 × g and the
supernatant was discarded. The cells were resuspended in 1 ml
pre-cooled PBS and apoptosis was detected by flow cytometry
immediately. Each experiment was repeated three times for each
group and the results underwent statistical analysis.
Statistical analysis
Measurement data are expressed as the mean ± SD and
were analyzed with a one-way ANOVA using SPSS 17.0 software (SPSS,
Chicago, IL, USA). P<0.05 was considered to indicate a
statistically significant difference.
Results
Identification of recombinant
plasmid
The plasmids pshRNA-NanogA, pshRNA-NanogB,
pshRNA-NanogC, pshRNA-negative control and pGenesil-1 were cut with
BamHI and HindIII in a 37°C water bath for 6 h. DNA
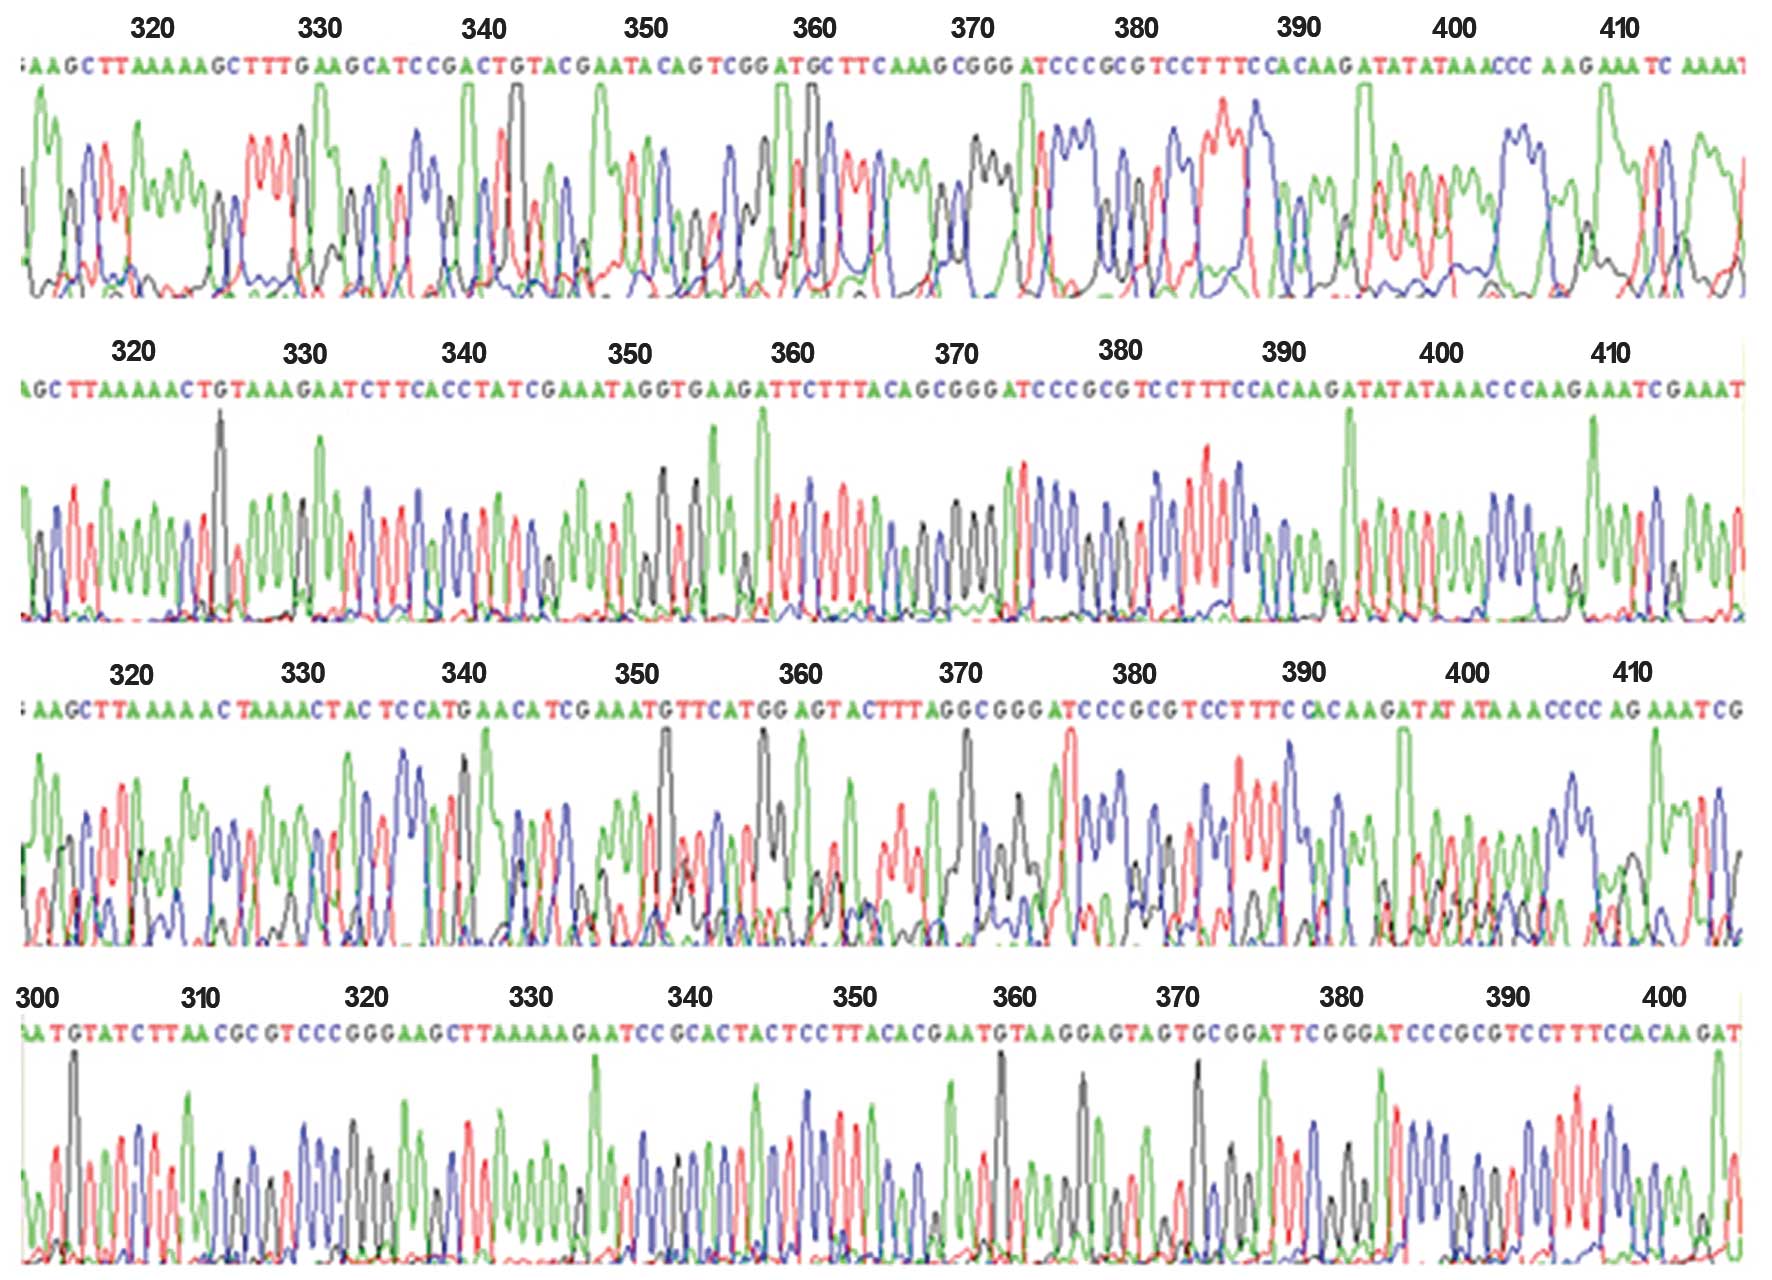
fragments of 392 and 364 bp were cut in all groups (Fig. 1). Simultaneously, the sequencing
results demonstrated the correct insertion of the shRNA
oligonucleotide sequence (Fig. 2).
This showed that the four recombinant plasmids were successfully
constructed.
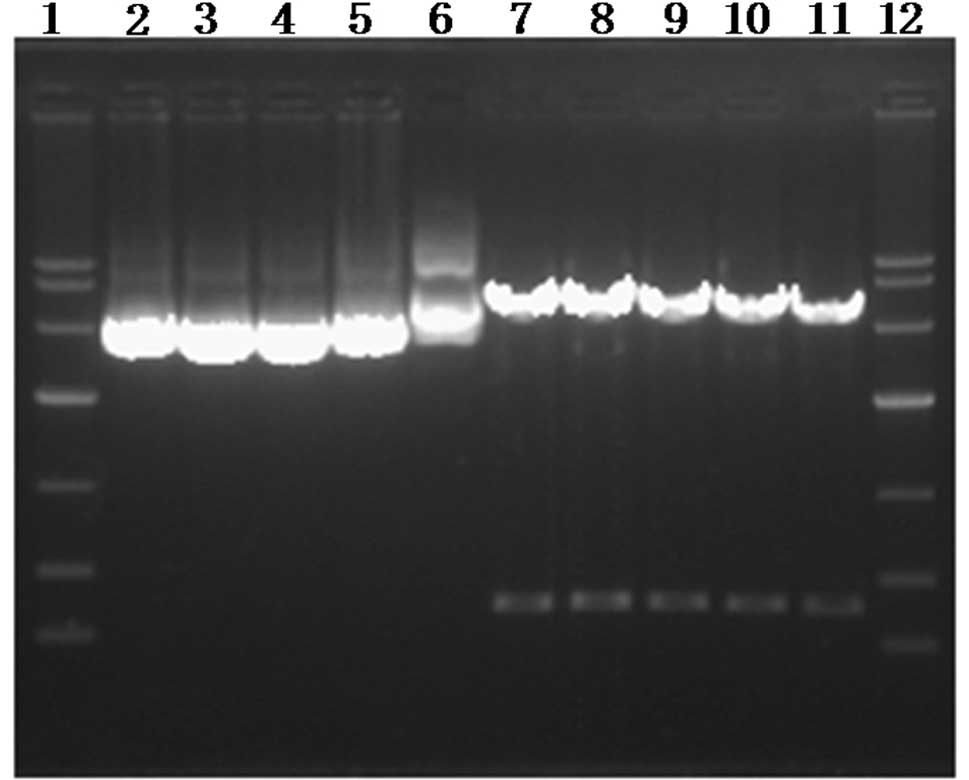 | Figure 1.Identification of recombinant plasmid.
A total of 12 lanes from left to right: 1,12, DNAMarker (DL 10000);
2, pshRNA-NanogA; 3, pshRNA-NanogB; 4, pshRNA-NanogC; 5,
pshRNA-negative control; 6, pGenesil-1; 7, pshRNA-NanogA; 8,
pshRNA-NanogB; 9, pshRNA-NanogC; 10, pshRNA-negative control; 11,
pGenesil-1 digested by EcoRI and HindIII. |
Expression of green fluorescent
protein
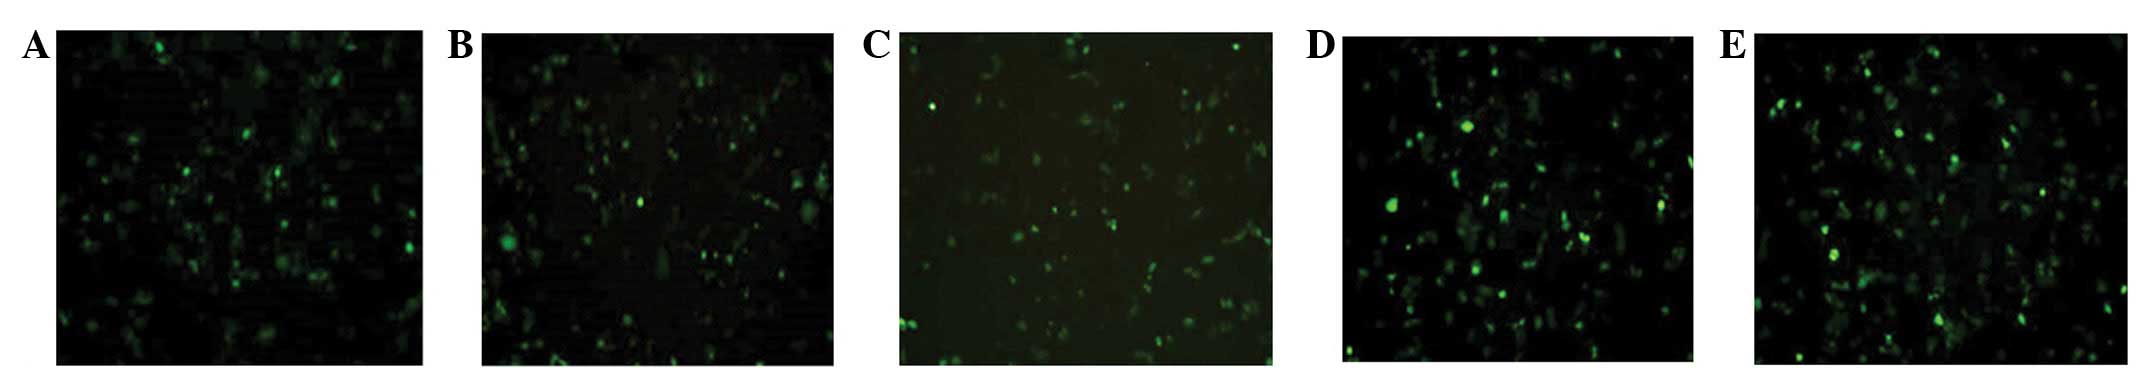
At 48 h post-transfection, the green fluorescence of
each group was observed with an inverted fluorescence microscope.
Green fluorescence was visible in the pshRNA-NanogA, pshRNA-NanogB,
pshRNA-NanogC, negative control and pGenesil-1 plasmid groups. The
green fluorescence intensities of the recombinant plasmid
transfection groups were slightly weaker compared with the
pGenesil-1 plasmid group and the transfection efficiency was ∼50%.
There was no green fluorescence in the SGC-7901 cell group
(Fig. 3).
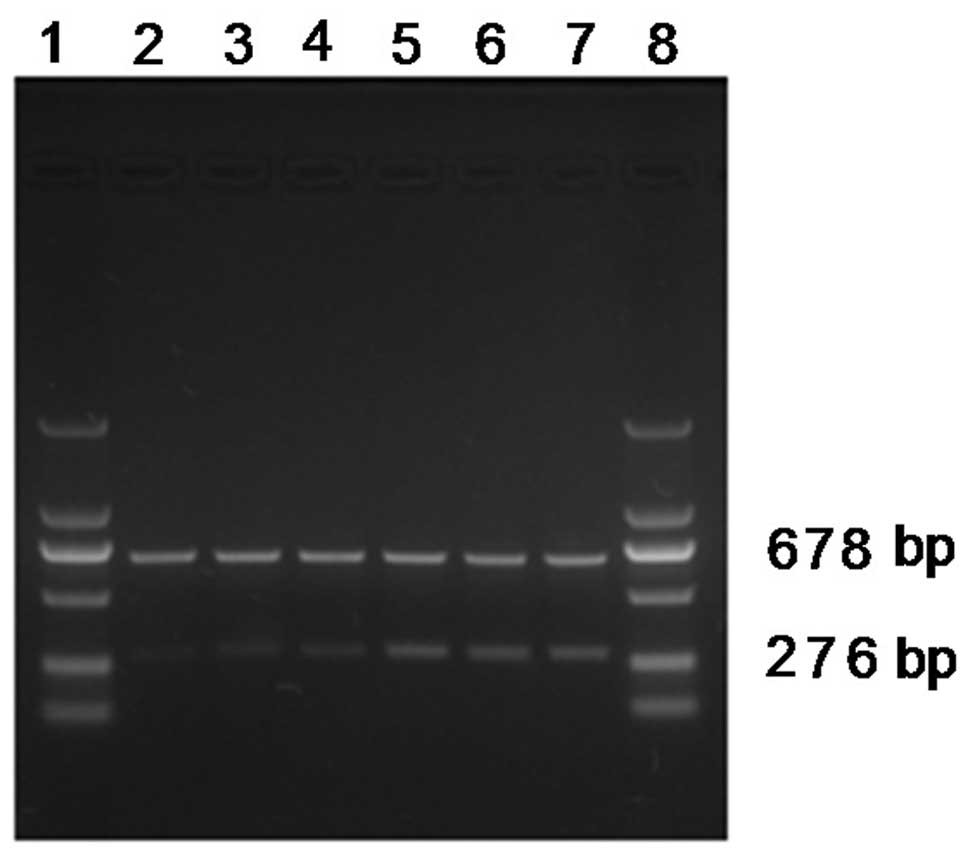
Nanog mRNA expression
At 48 h post-transfection, total RNA was extracted
from each of the six groups of SGC-7901 cells. qPCR was performed
according to the previously described system and conditions and
β-actin was used as an internal reference. All the β-actin (678 bp)
groups were of consistent brightness. The Nanog staining in the
pshRNA-NanogA-transfection group (276 bp) was the faintest and the
pshRNA-NanogB and pshRNA-NanogC groups were the second faintest,
while the phRNA-negative control, pGenesil-1 and SGC-7901 cell
groups were of the same brightness (Fig. 4). The analysis of the band
intensities using Quantity One software showed that the Nanog mRNA
expression of the pshRNA-NanogA group was 14.03±0.37%, while that
of the pshRNA-NanogB group was 21.29±1.66%, the pshRNA-NanogC group
was 21.26±0.94%, the pshRNA-negative control was 43.92±6.29%, the
pGenesil-1 group was 42.88±2.83% and the SGC-7901 cell group was
46.77±6.72%. There were significant differences between the
recombinant plasmid groups (the pshRNA-NanogA, pshRNA-NanogB and
pshRNA-NanogC groups) and the other groups (the pshRNA-negative
control, pGenesil-1 and SGC-7901 cell groups; P<0.05). The
pshRNA-NanogA group was significantly different from the
pshRNA-NanogB and pshRNA-NanogC groups (P<0.05), while no
significant differences were observed between the pshRNA-NanogB and
pshRNA-NanogC groups (P>0.05), as well as among the
pshRNA-negative control, pGenesil-1 and SGC-7901 cell groups
(P>0.05). The results showed that the pshRNA-NanogA,
pshRNA-NanogB and pshRNA-NanogC groups all had inhibitory effects
on the expression of Nanog mRNA, and that the inhibitory effect of
pshRNA-NanogA was more evident.
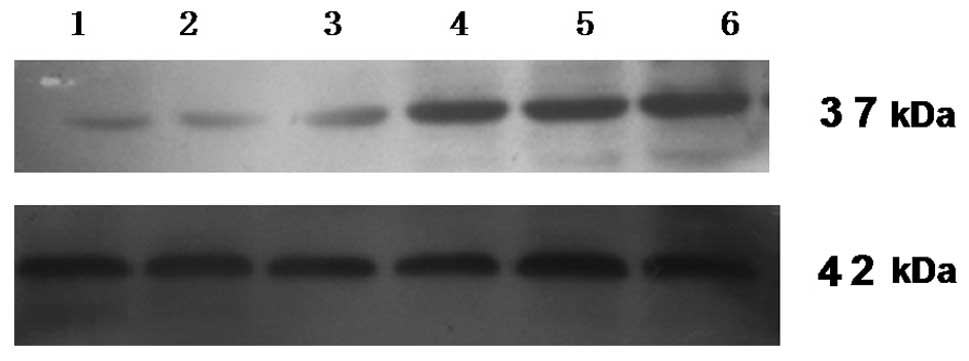
Effect on Nanog protein expression
Human Nanog has 305 amino acids encoding a 37 kDa
protein, while the β-actin protein is 42 kDa. At 48 h
post-transfection, total protein was extracted from each of the six
groups of SGC-7901 cells. A western blot analysis was performed to
detect Nanog and β-actin protein expression. The results showed
that the β-actin of all the groups had the same brightness. The
Nanog expression of the pshRNA-NanogA transfection group was the
faintest and the pshRNA-NanogB and pshRNA-NanogC groups were the
second faintest, while the phRNA-negative control, pGenesil-1 and
SGC-7901 groups were of the same brightness (Fig. 5). The analysis of the band
intensities using Quantity One Quantity One software showed that
the Nanog protein expression of the pshRNA-NanogA group was
61.57±0.81%, the pshRNA-NanogB group was 77.32±0.61%, the
pshRNA-NanogC group was 83.62±8.32%, the pshRNA-negative control
group was 94.60±1.47%, the pGenesil-1 group was 90.40±3.16% and the
SGC-7901 cell group was 93.32±1.88%. There were significant
differences between the recombinant plasmids groups (pshRNA-NanogA,
pshRNA-NanogB and pshRNA-NanogC groups) and the other groups
(pshRNA-negative control, pGenesil-1 and SGC-7901 groups;
P<0.05). The pshRNA-NanogA group was significantly different
from the pshRNA-NanogB and pshRNA-NanogC groups (P<0.05), while
no significant differences were observed between the pshRNA-NanogB
and pshRNA-NanogC groups (P>0.05), as well as among the
pshRNA-negative control, pGenesil-1 and SGC-7901 cell groups
(P>0.05). The results showed that the pshRNA-NanogA,
pshRNA-NanogB and pshRNA-NanogC groups all had inhibitory effects
on the expression of Nanog protein. The inhibitory effect of
pshRNA-NanogA was the greatest. This result was consistent with the
RT-PCR results, so recombinant plasmid pshRNA-NanogA was the most
suitable choice for the following experiments.
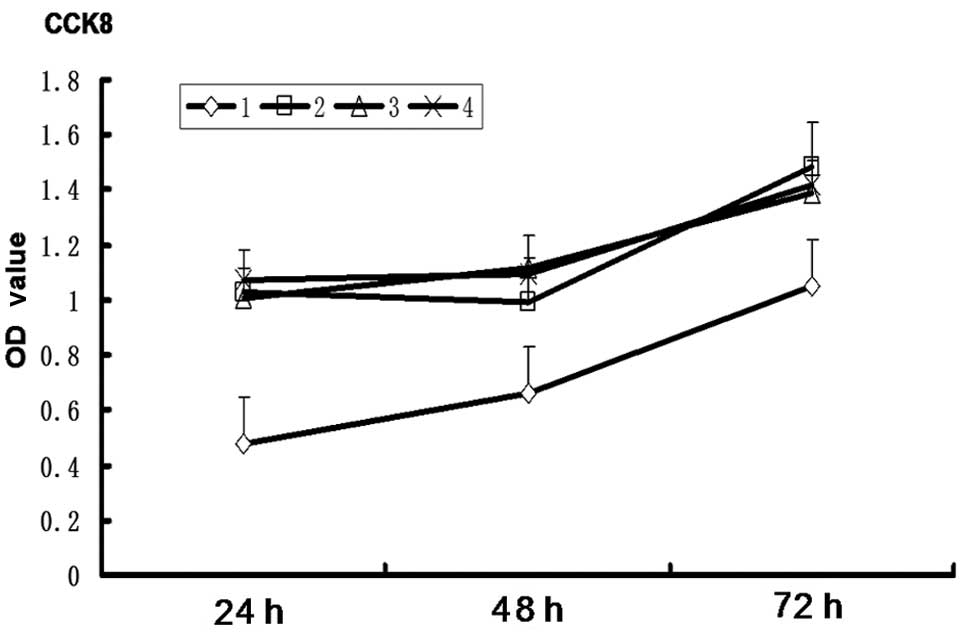
Nanog shRNA-transduced cells exhibit
decreased proliferation
The cell proliferation curve (Fig. 6) showed that, compared with the
pshRNA-negative control, pGenesil-1 and SGC-7901 cell groups, the
proliferative ability of the pshRNA-NanogA group was significantly
restricted (P<0.05). No significant differences were observed
among the pshRNA-negative control, pGenesil-1 and SGC-7901 cell
groups (P>0.05).
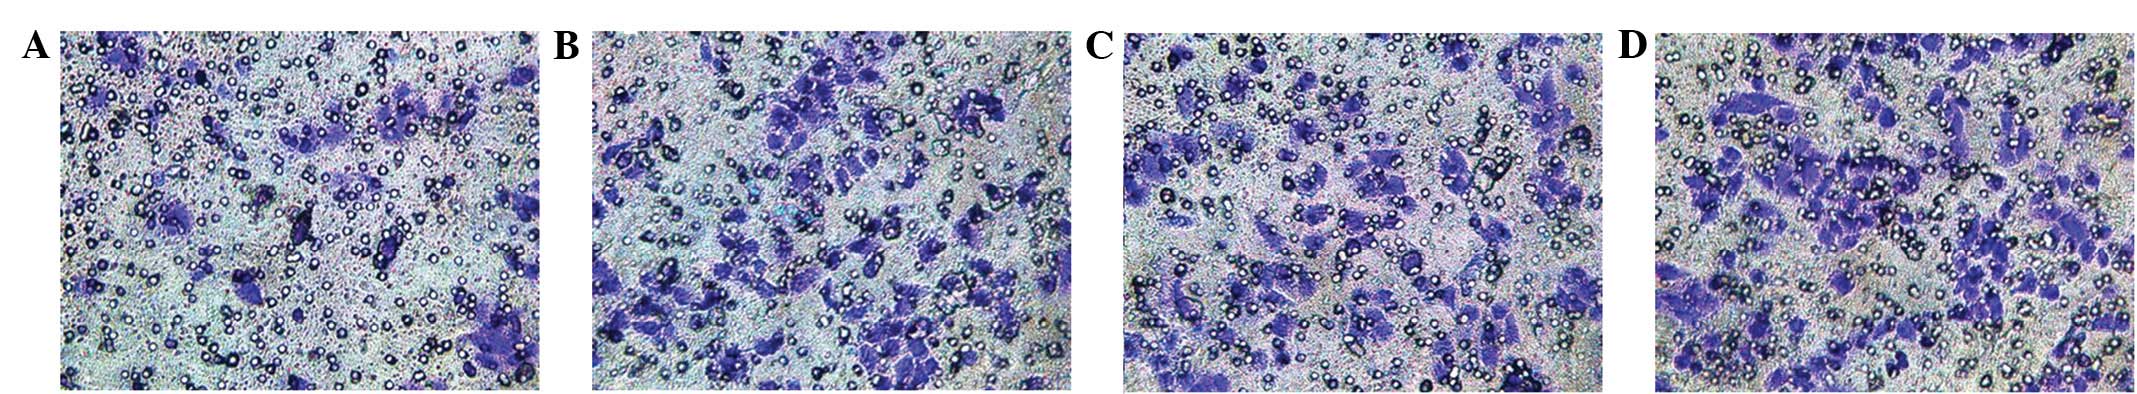
shRNA-Nanog inhibits the tumor cell
migration capacity
At 24 h after the transfection of the cells in the
upper compartments of the millicells (Fig. 7), all the groups displayed cells
that had crossed the Matrigel-coated membranes. The number of cells
that crossed the membrane in the pshRNA-NanogA group (37.55±1.83)
was less than that of the pshRNA-negative control (84.21±1.71),
pGenesil-1 (86.23±2.31) and SGC-7901 cell (89.40±3.98) groups, and
the differences were significant (P<0.05). No significant
differences were observed among the pshRNA-negative control,
pGenesil-1 and SGC-7901 cell groups (P>0.05).
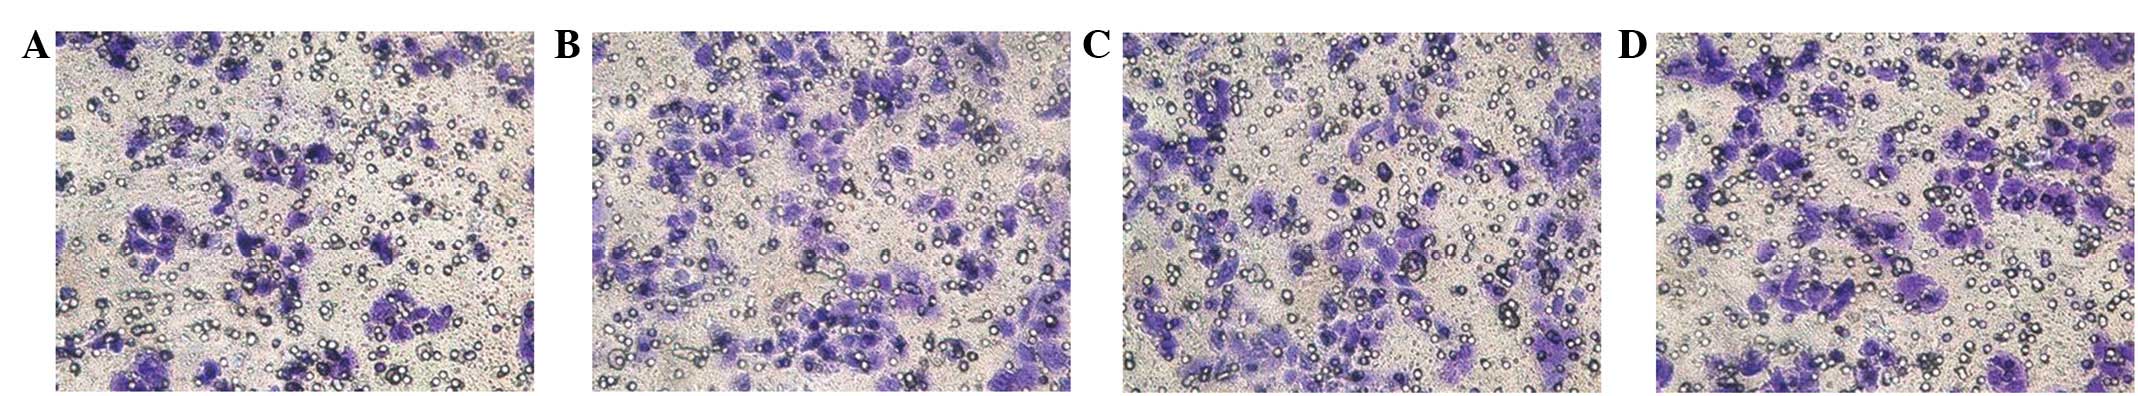
shRNA-Nanog inhibits the tumor cell
invasion capacity
At 24 h after the transfection of the cells in the
upper compartments of the millicells (Fig. 8), all the groups exhibited cells
that had crossed the membranes. The number of cells that crossed
the membrane in the pshRNA-NanogA group (41.23±2.76) was less than
that of the pshRNA-negative control (84.11±2.37), pGenesil-1
(90.71±2.78) and SGC-7901 cell (86.00±3.24) groups, and the
differences were significant (P<0.05). No significant
differences were observed among the pshRNA-negative control,
pGenesil-1 and SGC-7901 cell groups (P>0.05).
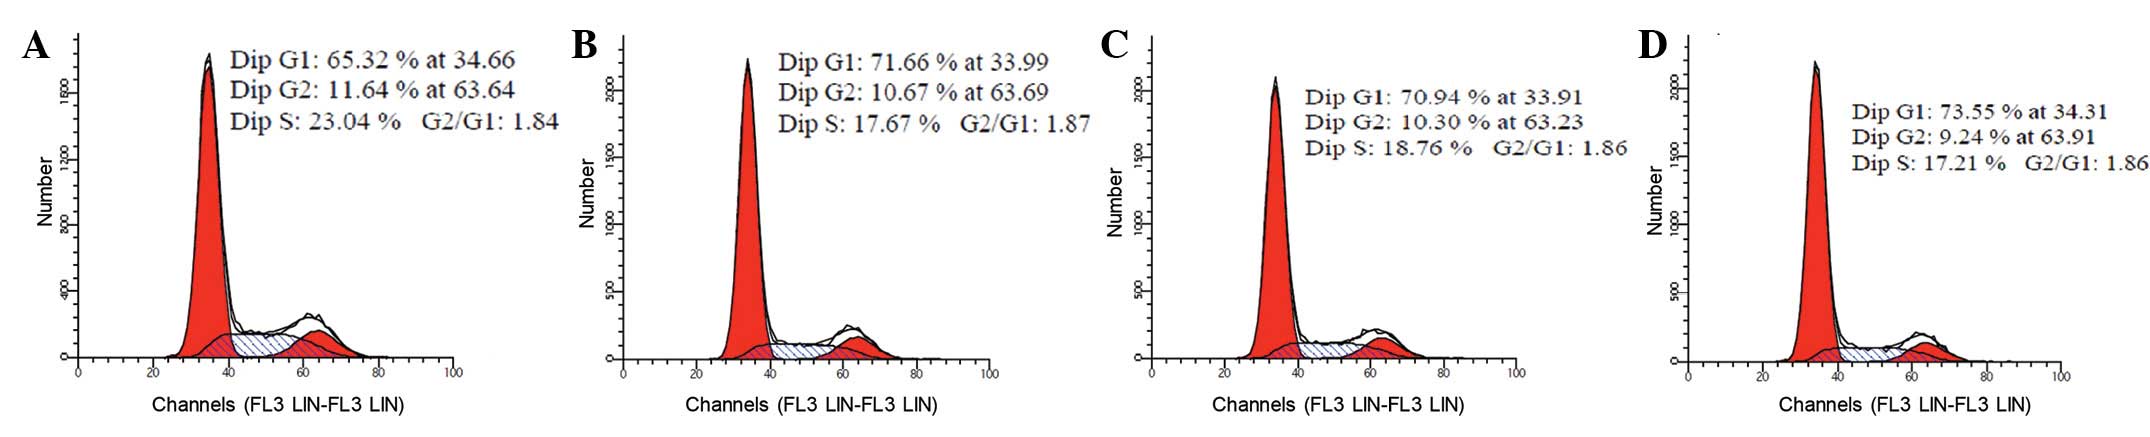
Cell cycle progression is blocked in
Nanog shRNA-transduced cells
At 48 h post-transfection, the cell cycle
distributions of these cells were detected by flow cytometry
(Fig. 9). Compared with the
pshRNA-negative control, pGenesil-1 and SGC-7901 cell groups, there
were more S-phase cells in the pshRNA-NanogA group (P<0.05). No
significant differences were observed among the pshRNA-negative
control, pGenesil-1 and SGC-7901 cell groups (P>0.05).
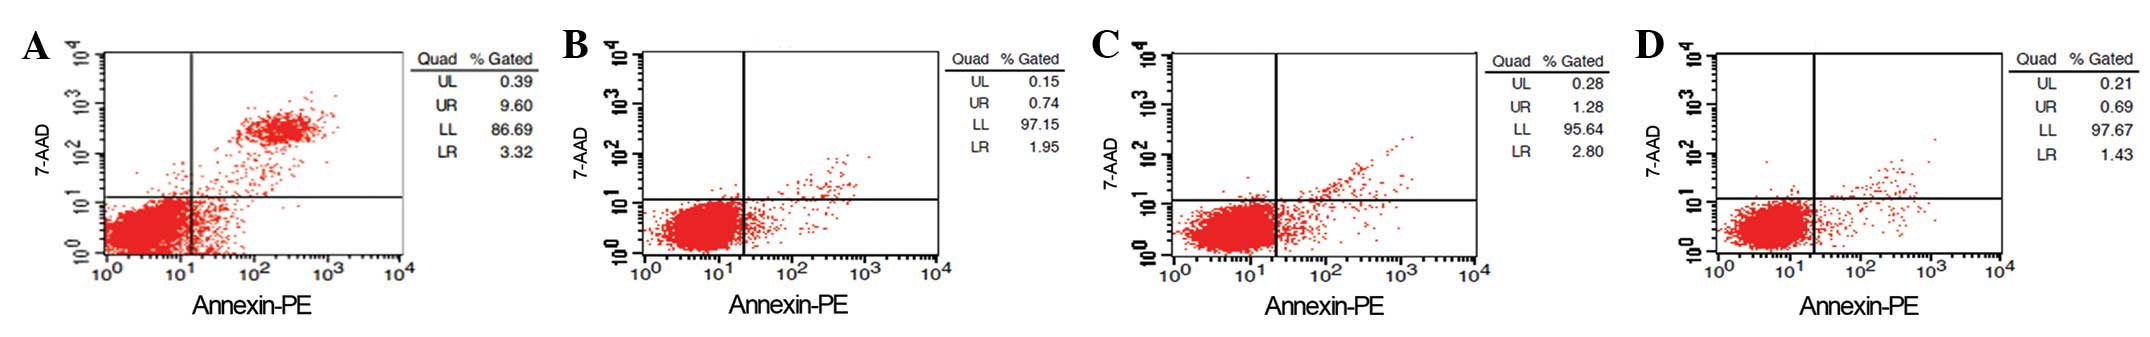
RNAi-mediated Nanog knockdown leads to
cell apoptosis
At 48 h post-transfection, the cell apoptosis of
these cells was detected by flow cytometry (Fig. 10). Compared with the
pshRNA-negative control, pGenesil-1 and SGC-7901 cell groups, the
number of apoptotic cells in the pshRNA-NanogA group was
significantly increased (P<0.05). No significant differences
were observed among the pshRNA-negative control, pGenesil-1 and
SGC-7901 cell groups (P>0.05).
Discussion
Research has shown that Nanog, a transcription
factor expressed in primordial germ cells and embryonic stem cells,
is an important regulatory factor for maintaining the self-renewal
and pluripotency of gastric cancer stem cells (9). Since Nanog is involved and important
in the occurrence and development of gastric cancer, gene-targeted
therapy for Nanog may become an important method for treating
gastric cancer.
RNAi technology is a popular bio-technology that is
highly specific, works quickly and has a high efficiency and low
cost. The mechanism behind RNAi is post-transcriptional
double-stranded RNA (dsRNA)-mediated gene silencing to induce
specific target gene mRNA degradation (11,12),
thus inhibiting protein synthesis to affect target gene function.
In the present study, a human Nanog gene interference plasmid,
pshRNA-Nanog was successfully constructed and transfected into the
gastric cancer cell line, SGC-7901. Green fluorescent protein was
then observed by fluorescence microscopy and recombinant plasmids
were successfully transfected into the cells with a transfection
efficiency of ∼50%. Nanog expression at the mRNA level was detected
through RT-PCR, while Nanog protein expression was detected with
western blotting. Nanog gene expression was observed to have
dropped significantly in these experiments. The group of
recombinant plasmids with the highest inhibition rate was selected
and transfected into the SGC-7901 cells with the result being that
the proliferative ability of the pshRNA-NanogA group was
significantly restricted. The cell cycle of the Nanog
shRNA-transduced cells was blocked in the S-phase, showing that DNA
synthesis was blocked, while the ability for cell proliferation was
inhibited. Apoptotic cells counts in the pshRNA-NanogA group
significantly increased, indicating that the recombinant plasmid of
pshRNA-NanogA inhibited Nanog gene expression and was involved in
inducing cell apoptosis. However, malignant tumor treatment is not
only for the control of the primary lesion; invasion and metastasis
form the malignant phenotype of tumors, and blocking tumor
metastasis is likely to be more effective. Transwell and Matrigel
are used to simulate the body environment and have been widely used
in the study of tumor migration and invasion (13). In the present Transwell invasion and
migration assays, the number of cells that crossed the membrane in
the shRNA-Nanog-inhibited group was significantly reduced. This
indicated that inhibiting Nanog gene expression in gastric cancer
cells may inhibit the invasion and migration of human gastric
cancer cells.
RNAi technology was able to inhibit the expression
of Nanog, thereby inhibiting tumor cell proliferation, migration
and invasion. This method may provide an experimental basis for a
gene therapy approach for treating gastric cancer.
References
|
1.
|
Singh SK, Clarke ID, Terasaki M, et al:
Identification of a cancer stem cell in human brain tumors. Cancer
Res. 63:5821–5828. 2003.PubMed/NCBI
|
|
2.
|
Ezeh UI, Turek PJ, Reijo RA and Clark AK:
Human embryonic stem cell genes cell gene OCT4, NANOG, STELLAR, and
GDF3 are expressed in both seminoma and breast carcinoma. Cancer.
104:2255–2265. 2005. View Article : Google Scholar : PubMed/NCBI
|
|
3.
|
Hoei-Hansen CE, Almstrup K, Nielsen JE, et
al: Stem cell pluripotency factor NANOG is expressed in human fetal
gonocytes, testicular carcinoma in situ and germ cell tumours.
Histopathology. 47:48–56. 2005. View Article : Google Scholar : PubMed/NCBI
|
|
4.
|
Pan G and Thomson JA: Nanog and
transcriptional networks in embryonic stem cell pluripotency. Cell
Res. 17:42–49. 2007. View Article : Google Scholar : PubMed/NCBI
|
|
5.
|
Ye F, Zhou C, Cheng Q, et al:
Stem-cell-abundant proteins Nanog, Nucleostemin and Musashil are
highly expressed in malignant cervical epithelial cells. BMC
Cancer. 8:1082008. View Article : Google Scholar : PubMed/NCBI
|
|
6.
|
Lin T, Ding YQ and Li JM: Overexpression
of Nanog protein is associated with poor prognosis in gastric
adenocarcinoma. Med Oncol. 29:878–885. 2012. View Article : Google Scholar : PubMed/NCBI
|
|
7.
|
Chen Z, Xu WR, Qian H, et al: Stem cell
markers Nanog test in the diagnosis of gastric cancer science. J
Clin Laboratory. 27:6–9. 2009.
|
|
8.
|
Matsuoka J, Yashiro M, Sakurai K, Kubo N,
Tanaka H, Muguruma K, Sawada T, Ohira M and Hirakawa K: Role of the
stemness factors sox2, oct3/4, and nanog in gastric carcinoma. J
Surg Res. 174:130–135. 2012. View Article : Google Scholar : PubMed/NCBI
|
|
9.
|
Takaishi S, Okumura T and Wang TC: Gastric
cancer stem cells. J Clin Oncol. 26:2876–2882. 2008. View Article : Google Scholar : PubMed/NCBI
|
|
10.
|
Golestaneh AF, Atashi A, Langroudi L,
Shafiee A, Ghaemi N and Soleimani M: miRNAs expressed differently
in cancer stem cells and cancer cells of human gastric cancer cell
line MKN-45. Cell Biochem Funct. 30:411–418. 2012. View Article : Google Scholar : PubMed/NCBI
|
|
11.
|
Li X, Fan R, Zou X, et al: Reversal of
multidrug resistance of gastric cancer cells by down-regulation of
CIAPIN1 with CIAPIN1 siRNA. Mol Biol (Mosk). 42:102–109. 2008.(In
Russian).
|
|
12.
|
Stege A, Priebsch A, Nieth C and Lage H:
Stable and complete overcoming of MDR1/P-glycoprotein-mediated
multidrug resistance in human gastric carcinoma cells by RNA
interference. Cancer Gene Ther. 11:699–706. 2004. View Article : Google Scholar
|
|
13.
|
Kim DS, Jeon OH, Lee HD, et al: Integrin
alphavbeta3-mediated transcriptional regulation of TIMP-1 in a
human ovarian cancer cell line. Biochem Biophys Res Commun.
377:479–483. 2008. View Article : Google Scholar : PubMed/NCBI
|