Introduction
Colon cancer is a significant cause of
cancer-related morbidity and mortality, and is the third most fatal
malignancy worldwide (1). In China
and other economically developing countries, colon cancer incidence
rates have increased over the past 20 years; most likely due to
changes in the environment, individual lifestyle and nutritional
habits (2). In certain
high-prevalence regions, colon cancer has become the second leading
cause of cancer-related mortality (3). It has been suggested that there are
two distinct categories of colon cancer (CRC), i.e., CRC that is
proximal or distal to the splenic flexure (4). A number of studies have demonstrated
that right-sided (proximal) and left-sided (distal) colon tumors
differ in their genetic susceptibilities to neoplastic
transformation (5–9). Significant differences have been
observed to exist between left-sided colon carcinoma (LSCC) and
right-sided colon carcinoma (RSCC), with regard to epidemiological,
biological and clinical data concerned with carcinogenesis and
survival (10–13). Christodoulidis et al reported
that the size of colonic tumors was significantly greater in RSCC
compared with LSCC and that LSCC patients had a significantly
improved overall 5-year survival rate compared with RSCC patients
(10). Wray et al reported
that LSCC presented at an earlier stage, had a lower tumor grade
and independently decreased colorectal cancer-specific mortality
compared with RSCC (11).
Papagiorgis et al reported that RSCC had higher severity in
terms of stage and grade compared with LSCC (13). However, the molecular genetic basis
for the different biological behaviors between LSCC and RSCC
remains unclear. Using cDNA microarray analysis, the present study
explored the differentially expressed genes of LSCC and RSCC.
Materials and methods
Patients
From June 2007 to December 2008, 100 Han Chinese
patients diagnosed with sporadic colon adenocarcinoma (LSCC, n=50;
RSCC, n=50) were recruited from the Department of General Surgery
of Xiangya Hospital, Central South University (Changsha, China).
All patients received complete resection of the tumor, without
pre-operative chemotherapy or radiotherapy. The baseline
characteristics of the patients are listed in Table I. The study was approved by the
Ethical Committee of Xiangya Hospital, Central South University.
Informed consent was obtained from all participants.
 | Table I.Baseline characteristics of
patients. |
Table I.
Baseline characteristics of
patients.
| Characteristic | LSCC (n=50), n
(%) | RSCC (n=50), n
(%) | P-value |
|---|
| Age (years) | | | |
| ≤50 | 15 (30) | 21 (42) | 0.21 |
| >50 | 35 (70) | 29 (58) | |
| Gender | | | |
| Male | 31 (62) | 27 (54) | 0.54 |
| Female | 19 (38) | 23 (46) | |
| Tumor cell
differentiation | | | |
| High | 17 (34) | 18 (36) | 0.57 |
| Intermediate | 22 (44) | 25 (50) | |
| Low | 11 (22) | 7 (14) | |
| Lymph node
metastasis | | | |
| Yes | 26 (52) | 21(42) | 0.42 |
| No | 24 (48) | 29 (58) | |
| Liver metastasis | | | |
| Yes | 11 (22) | 7 (14) | 0.30 |
| No | 39 (78) | 43 (86) | |
| Tumor diameter
(cm) | | | |
| ≤5 | 22 (44) | 17 (34) | 0.31 |
| >5 | 28 (56) | 33 (66) | |
| Tumor invasion | | | |
| Within muscle | 14 (28) | 21 (42) | 0.14 |
| Serosa and
further | 36 (72) | 29 (58) | |
| TNM stage | | | |
| I and II | 11 (22) | 16 (32) | 0.26 |
| III and IV | 39 (78) | 34 (68) | |
Reagents
The Nanjing University 22K Human Genome Array gene
chip was purchased from CapitalBio Corp. (Beijing, China). The gene
chip contained 21,522 70-mer oligo-nucleotide DNAs, each
representing a human gene transcript. Among the 21,522
oligonucleotide DNAs, 21,329 were from the Human Genome Oligo Set,
Version 2.1 (Eurofins MWG Operon, Huntsville, AL, USA) and the
remaining 193 were synthesized by CapitalBio Corp. The
anti-cyclin-dependent kinase 4 inhibitor D (CDKN2D) monoclonal
(sc-71810) and goat anti-human ubiquitin D (UBD; sc-51082)
antibodies were purchased from Santa Cruz Biotechnology, Inc.
(Santa Cruz, CA, USA).
RNA isolation and microarray
procedures
The total RNA was extracted from samples using
TRIzol reagent (Invitrogen Life Technologies, Carlsbad, CA, USA),
and purified using the NucleoSpin RNA Clean-up kit (Macherey-Nagel
GmbH and Co., KG, Düren, Germany). The total RNA was then
transcribed into double stranded cDNA with a cDNA Synthesis kit
obtained from Promega Corporation (Madison, WI, USA), and purified
with a polymerase chain reaction (PCR) NucleoSpin Extract II kit
(Promega Corporation). The double stranded cDNA was transcribed
in vitro, compounded into cRNA, purified and then labeled
with Cy5-dCTP (Amersham Pharmacia Biotech, Inc., Piscataway, NJ,
USA) by the Klenow enzyme (Takara Bio, Inc., Otsu, Japan).
Hybridization was performed at 42°C with the Nanjing University 22K
Human Genome Array gene chip (CapitalBio Corp.).
Chip scan and data analysis
The chip images were scanned using a LuxScan 10K-A
double-channel laser scanner (CapitalBio Corp.). The signals
referred to the unified data of the light intensity that were
detected by the scanner and analyzed with the CapitalBio SpotData
Pro 3.0 Microarray Image Analysis software (CapitalBio Corp.). The
image signals were transmitted as digital signals, and then the
data contained on the chips were normalized by the Lowess method
(14).
Quantitative (q)PCR
The total RNA were prepared using TRIzol reagent
(Invitrogen Life Technologies) followed by purification with the
Turbo DNA-free system (Ambion, Inc., Austin, TX, USA). The
cDNA was synthesized using SuperScript II Reverse Transcriptase
(Invitrogen Life Technologies). qPCR was performed using the
LightCycler thermal cycler system (Roche Diagnostics GmbH,
Mannheim, Germany) with the SYBR Green I kit (Roche Diagnostics
GmbH), according to the manufacturer’s instructions. The results
were normalized against those of the housekeeping gene,
glyceraldehyde-3-phosphate dehydrogenase (GAPDH), in the
same sample. The following primer sequences were used:
CDKN2D forward, 5′-CTCGCCGTCCTCCGGCTGAC-3′ and reverse,
5′-AGCATGTCGACACTGGCGGC-3′; casein kinase-1 binding protein
(C20orf35) forward, 5′-CCCTTTCCTCCTCTTCATCC-3′ and reverse,
5′-CCCTTT CCTCCTCTTCATCC-3′; L-lactate dehydrogenase B chain
(LDHB) forward, 5′-TCCCGTGTCAACAATGGTAA-3′ and reverse,
5′-CCCACAGGGTATCTGCACTT-3′; UBD forward,
5′-GGCACCTCCTCCAGGTGCGAA-3′ and reverse,
5′-CAACACCCCATGCCCAGGGTG-3′; GAPDH forward,
5′-GTCAGTGGTGGACCTGACCT-3′ and reverse, 5′-TGCTGTAGCCAAATTCGTTG-3′.
Each sample was repeated in triplicate. The results are expressed
as the mean ± standard deviation.
Western blot analysis
Immunoblotting was performed with the respective
antibodies. Briefly, extracted tumor tissues were homogenized and
lysed in 0.1% Nonidet P-40 lysis buffer (0.1% Nonidet P-40; 50 mM
Tris-HCl, pH 7.4; 150 mM NaCl; and 1 mM EDTA). Equal quantities of
protein for each sample were separated by 10% sodium dodecyl
sulfate (SDS)-polyacrylamide gels and blotted onto a polyvinylidene
difluoride microporous membrane (Millipore, Billerica, MA, USA).
The membranes were incubated for 1 h with a 1:1,000 dilution of
anti-CDKN2D monoclonal antibody (sc-71810) or goat anti-UBD
antibody (sc-51082) (Santa Cruz Biotechnology, Inc.), and then
washed and revealed using secondary antibodies with horseradish
peroxidase conjugate (1:5,000; 1 h). The peroxidase was revealed
with an enhanced chemiluminescence (ECL) kit obtained from GE
Healthcare Lifesciences (San Francisco, CA, USA). The proteins were
quantified prior to being loaded onto the gel, and the equal
loading of extracts was verified by an analysis of Ponceau
coloration.
Immunohistochemistry
Paraffin-embedded tumor tissues were examined for
CDKN2D or UBD expression. The immunostaining for CDKN2D and UBD was
performed by utilizing the streptavidin-biotin-peroxidase method,
according to the manufacturer’s instructions (Beijing Zhongshan
Golden Bridge Biotechnology Co., Ltd., Beijing, China). Briefly,
4-μm sections of paraffin-embedded specimens were
de-paraffinized in xylene, hydrated in a degraded series of ethanol
and heated in 0.01 M citrate buffer for 10 min in a microwave oven.
Subsequent to cooling for 20 min and washing in PBS, endogenous
peroxidase was blocked with methanol containing 0.3% hydrogen
peroxide for 30 min, followed by incubation with phosphate buffered
saline (PBS) for 30 min. Next, the sections were incubated with the
anti-CDKN2D or -UBD antibody at a dilution of 1:150, and stained
using the avidin-biotin complex method. Coloration was developed by
3,3′-diaminobenzidine (DAB) containing H2O2,
and the sections were counterstained with hematoxylin. Two
pathologists, blinded to the clinical and pathological data,
independently examined the slides by randomly selecting 10
high-power (x400) view fields in each sample and scoring the gene
expression in the tumor cells, as previously described (15). Briefly, each tumor sample was
administered a score according to the intensity of the nucleic or
cytoplasmic staining (0, no staining; 1, weak staining; 2, moderate
staining; and 3, strong staining) and the extent of stained cells
(0%, 0; 1–10%, 1; 11–50%, 2; 51–80%, 3; and 81–100%, 4). The extent
of stained cells was classed as either negative, focally positive
or diffusely positive, corresponding to the 0, 1–80 and 81–100%
stained areas, respectively. The final immunoreactive score was
determined by multiplying the staining intensity scores by the
extent of staining scores, with a minimum score of 0 and a maximum
score of 12. Scores of 0–3 constituted negative staining, while
scores of 4–12 indicated positive staining (15).
Statistical analysis
Statistical analyses were performed with SPSS for
Windows 10.0 (SPSS, Inc., Chicago, IL, USA). Numerical data are
presented as the mean ± standard deviation. Comparisons were
performed with the Student’s t-test, following the assessment of
normality and equality of variances. Categorical variables were
compared using the χ2 test. P<0.05 was used to
indicate a statistically significant difference.
Results
As demonstrated in Table
I, no significant differences were observed between the LSCC
and RSCC patients in terms of the baseline characteristics,
including age, gender, TNM staging, tumor cell differentiation,
tumor size, tumor invasion and rate of lymph node or liver
metastasis. The results indicated that the LSCC and RSCC groups
were comparable at baseline.
Gene expression profiling of LSCC and RSCC was
established using the Nanjing University 22K Human Genome Array
gene chip (CapitalBio Corp.), which has been employed in previous
studies for microarray analysis (16–7). The screening criteria for
differentially expressed genes were as follows: score difference,
≥2; LSCC/RSCC fold change, 0.5–2; and number of biological
replicates, ≥3. As demonstrated in Table II, 11 genes were identified to be
differentially expressed between LSCC and RSCC. Compared with RSCC,
genes for LDHB, CDKN2D,
phosphatidylinositol-4-phosphate-3-kinase-C2 domain-containing
subunit alpha (PI3KC2α), protocadherin fat 1 (FAT) and dual
specificity protein phosphatase 2 (DUSP2) were upregulated in LSCC.
By contrast, genes for UBD, C20orf35, synaptotagmin-13 (SYT1), zinc
finger protein 560 (ZNF560), pleckstrin homology domain-containing
family B member 2 (PLEKHB2) and IgGFc-binding protein (FCGBP) were
downregulated in LSCC, compared with RSCC.
| Table II.Differentially expressed genes in LSCC
and RSCC identified by microarray analysis. |
Table II.
Differentially expressed genes in LSCC
and RSCC identified by microarray analysis.
| A, Upregulated genes
in LSCC and RSCC |
|
| GB accession | Name | Score | Fold change | Chromosome | GO biological
process |
|
| U40343 | CDKN2D | −2.456 | 0.347 | 19 | Cytoplasm |
| BG110199 | LDHB | 4.747 | 3.562 | 12 | Energy
pathways |
| BX537504 |
PI3KC2α | 2.432 | 3.643 | 6 | Humoral defense
mechanism |
| X87241 | FAT | 2.343 | 3.090 | 4 | Development |
| L11329 | DUSP2 | 2.076 | 2.567 | 2 | Macromolecule
metabolism |
|
| B, Downregulated
genes in LSCC and RSCC |
|
| GB accession | Name | Score | Fold change | Chromosome | GO biological
process |
|
| Y12653 | UBD | 2.785 | 4.926 | 6 | Organismal
movement |
| AJ276469 |
C20orf35 | −2.456 | 0.444 | 20 | Cell growth and/or
maintenance |
| AB037848 | SYT13 | −2.322 | 0.200 | 11 | Coated vesicle |
| AK056548 | ZNF560 | −2.275 | 0.488 | 19 | Transcription,
DNA-dependent |
| AK093730 | PLEKHB2 | −2.045 | 0.490 | 2 | - |
| D84239 | FCGBP | −2.026 | 0.187 | 19 | - |
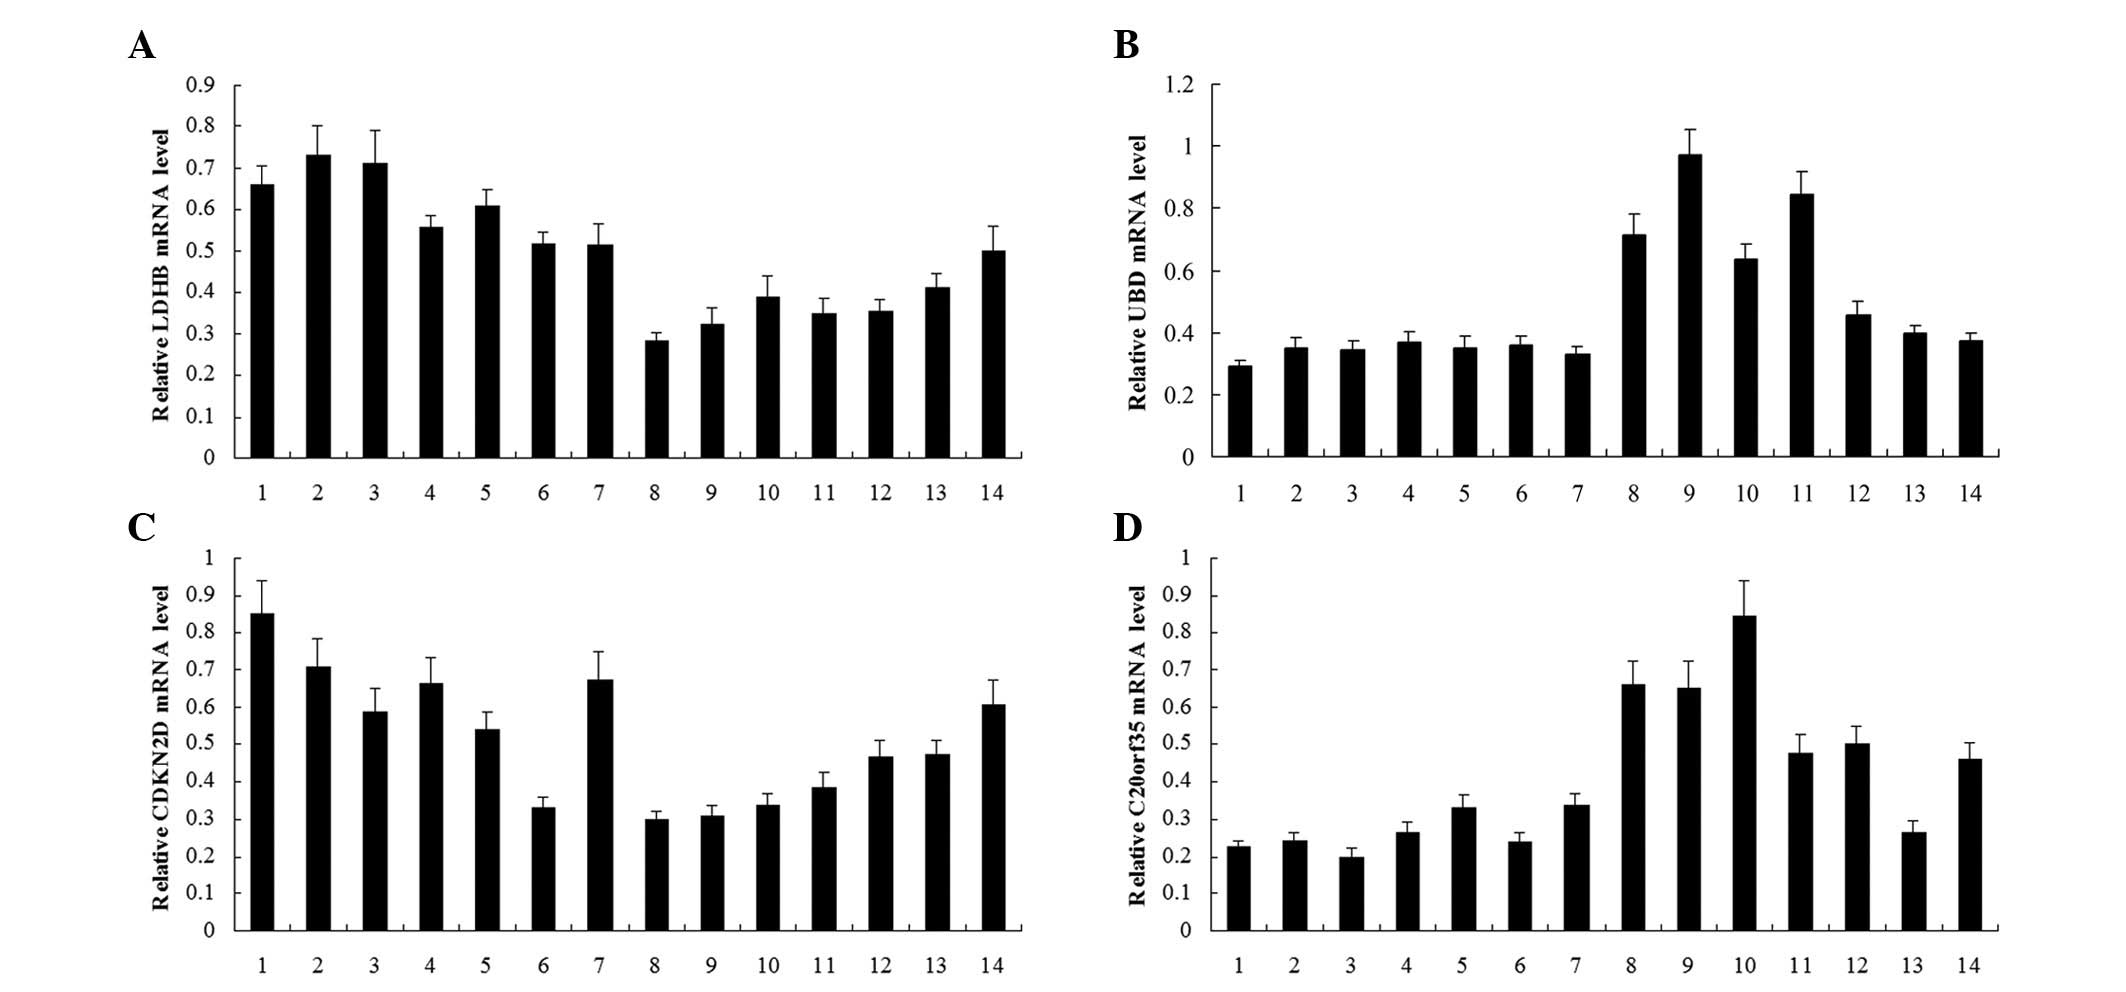
As demonstrated in Fig.
1, qPCR revealed that the mRNA levels of UBD and
C20orf35 in LSCC were significantly lower than those in RSCC
(P= 0.033 and P= 0.005, respectively), while those of LDHB
and CDKN2D were significantly higher in LSCC than those in
RSCC (P=0.008 and P=0.017, respectively), thus confirming the
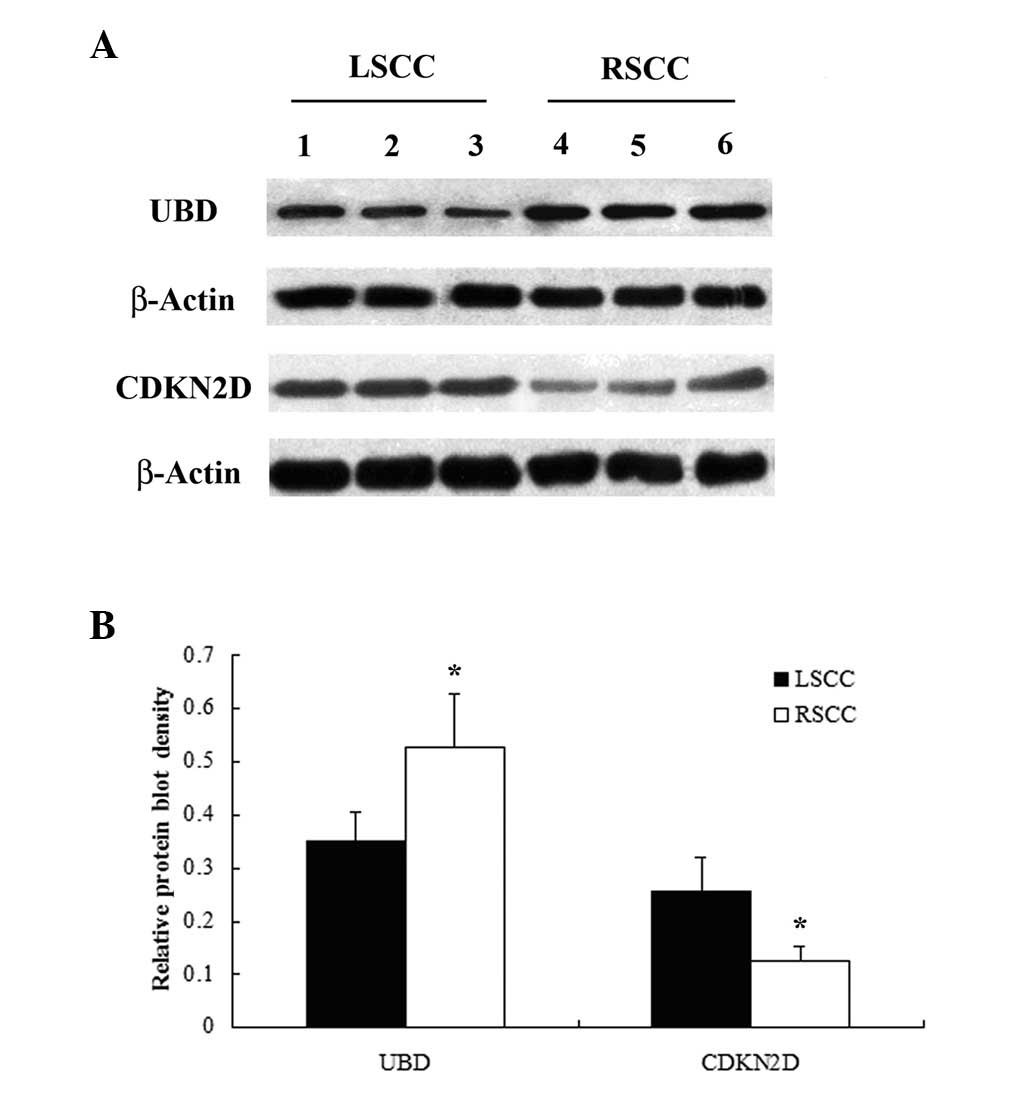
results of the microarray analysis. The western blot analyses
demonstrated that the protein level of CDKN2D in LSCC was
significantly higher than that in RSCC (P=0.041), while that of UBD
in LSCC was significantly lower compared with that in RSCC
(P=0.029) (Fig. 2). The
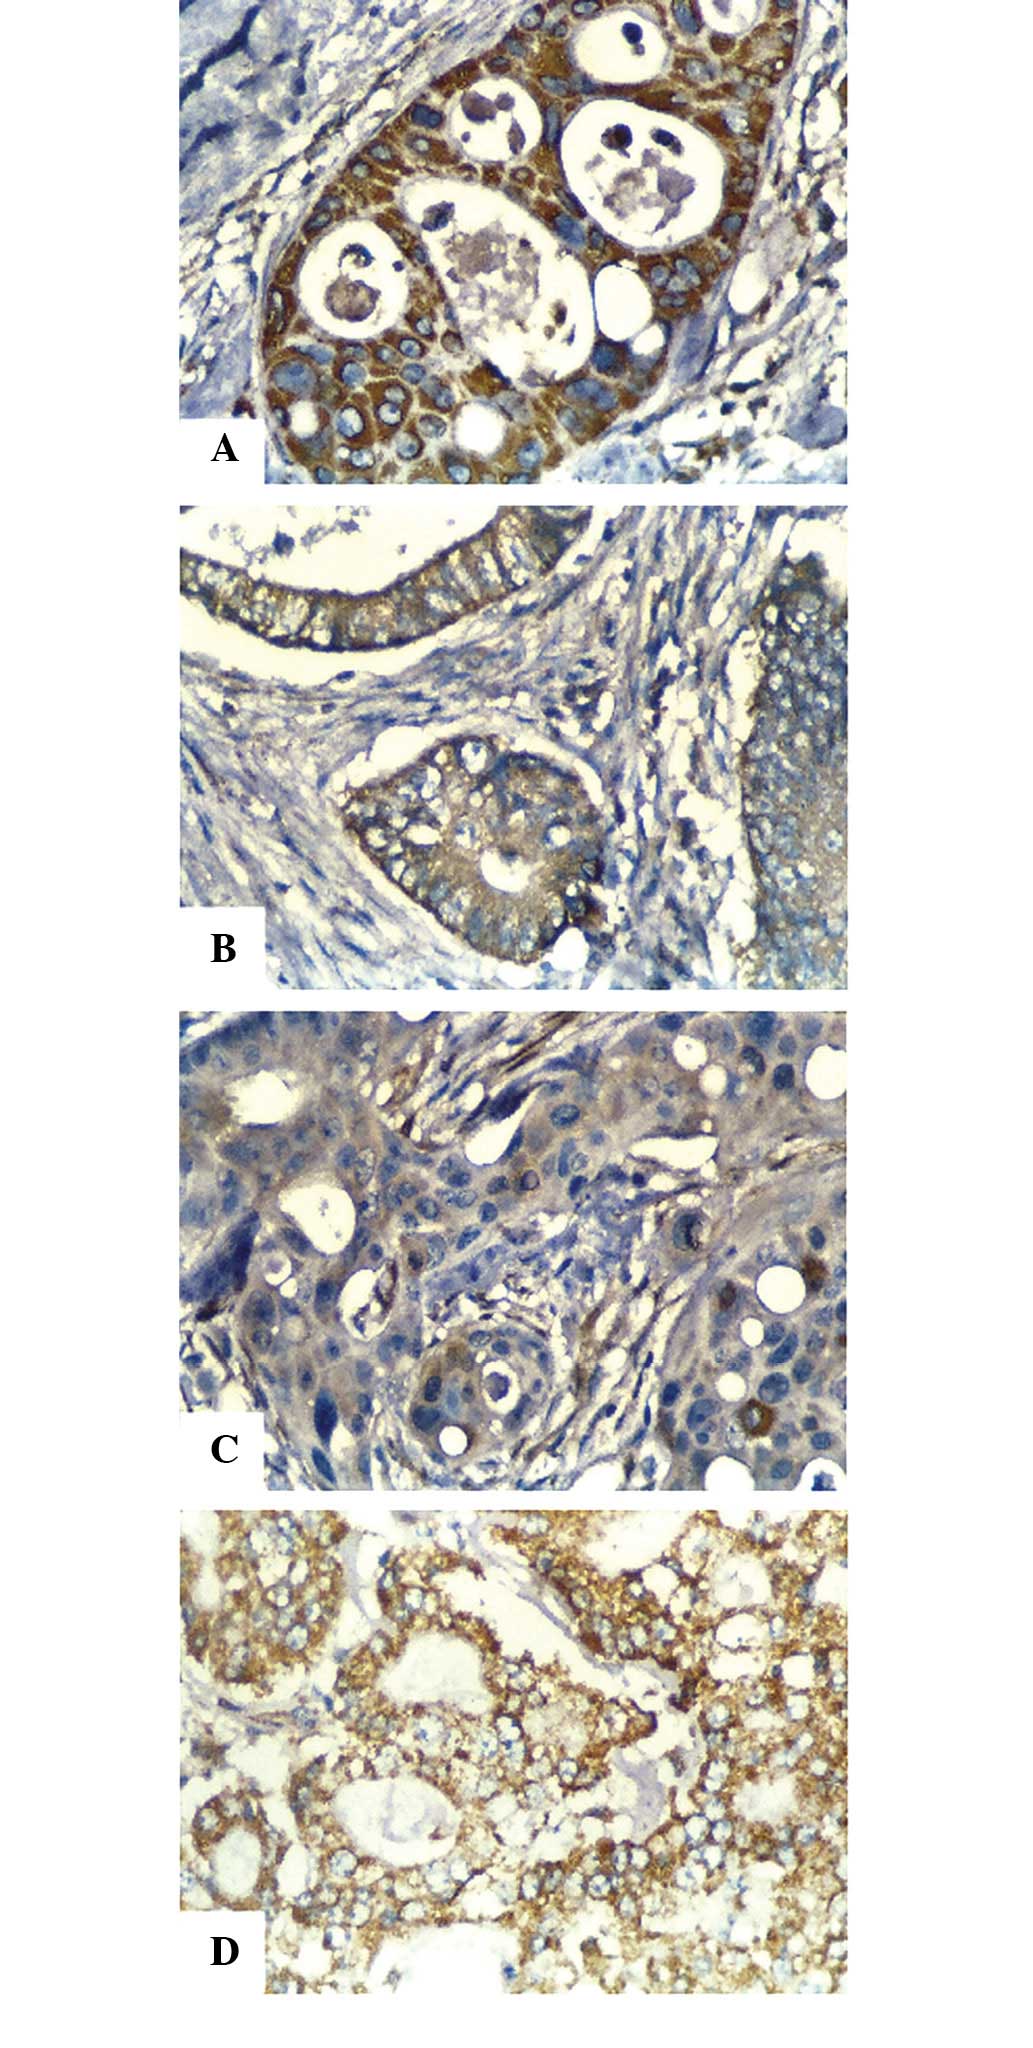
immunohistochemical analyses revealed that the positive staining
rate of CDKN2D in LSCC was significantly higher than that in RSCC
(P= 0.016), while that of UBD in LSCC was significantly lower
compared with that in RSCC (P=0.007; Table III; Fig.
3).
| Table III.Immunohistochemical detection of UBD
and CDKN2D expression in LSCC and RSCC. |
Table III.
Immunohistochemical detection of UBD
and CDKN2D expression in LSCC and RSCC.
| n | CDKN2D | P-value | UBD | P-value |
|---|
|
|
|---|
| Positive, n | Positive rate
(%) | Positive, n | Positive rate
(%) |
|---|
| RSCC | 50 | 16 | 32 | 0.016 | 38 | 76 | 0.007 |
| LSCC | 50 | 28 | 56 | | 25 | 50 | |
Discussion
Significant differences exist between LSCC and RSCC,
with regard to epidemiological, biological and clinical data
concerned with carcinogenesis and survival (10–13). A
number of studies have suggested that LSCC and RSCC differ in their
genetic susceptibilities to neoplastic transformation (5–9). Using
expression profiling with microarray analysis, the present study
identified 11 genes that were differentially expressed in LSCC and
RSCC.
Compared with RSCC, five genes were upregulated in
LSCC; LDHB, CDKN2D, PI3KC2α, FAT and
DUSP2. LDHB is an important enzyme in sugar metabolism.
Griffini et al proposed that LDH may be involved in
increasing anaerobic glycolysis in the metastatic foci of CRC in
the liver, suggesting that the LDH activity may reflect the status
of tumor metabolism (18). In the
present study, LSCC demonstrated higher LDHB expression than
RSCC, implicating that the left and right side of the colon differ
in their tumor metabolic activity, particularly with regard to
anaerobic glucose metabolism. An RSCC is typically larger and has a
poorer survival outcome compared with LSCC, which may be due to the
fact that symptoms such as bleeding and pain occur later on in RSCC
(10). CDKN2D has been demonstrated
to induce tumor cell apoptosis through the cyclin D-CDK4/6-INK4-Rb
pathway (19). The present study
identified that LSCC had increased CDKN2D expression compared with
RSCC, suggesting an additional mechanism for the differences in
tumor size and survival outcome between LSCC and RSCC.
Compared with RSCC, six genes were downregulated in
LSCC; UBD, C20orf35, SYT13, ZNF560, PLEKHB2
and FCGBP. Yan et al demonstrated that UBD may
contribute to the progression of colon carcinogenesis and function
as a novel prognostic indicator that may predict tumor recurrence
in stage II and III patients following curative surgery (20). The results of the present study
revealed that RSCC had higher UBD expression than LSCC,
suggesting that RSCC may have a poorer prognosis compared with
LSCC, which is concordant with the results of a study by
Christodoulidis et al (10).
Studies have investigated the association between FCGBP
expression and the presence of tumors. O’Donovan et al
revealed that while the FCGBP gene was constitutively
expressed in normal thyroid tissue, its expression was
significantly decreased in papillary and follicular thyroid
carcinomas (21). The correlation
between the expression of FCGBP, C2, FAT or
DUSP2 and LSCC or RSCC remains unclear. Further studies are
required to uncover the role of these genes in the pathogenesis and
progression of LSCC and RSCC. Thus, the present results not only
confirm those of previous studies, but also suggest potential
targets for future studies on the pathogenesis and progression of
colon cancer, which may serve as a basis for the identification of
novel colon cancer markers and therapeutic targets. In addition, it
may be useful to explore the potential interactions between the
differentially expressed genes and well-studied oncogenes or tumor
suppressor genes, such as V-Ki-ras2 Kirsten rat sarcoma viral
oncogene homolog (KRAS), v-raf murine sarcoma viral oncogene
homolog B1 (BRAF) and phosphatase and tensin homolog (PTEN).
In conclusion, using microarray analysis, the
present study identified 11 genes that were differentially
expressed between LSCC and RSCC. This therefore provided important
insights into the understanding of the molecular genetic basis for
the different biological behaviors that are evident between LSCC
and RSCC.
References
|
1.
|
Jemal A, Siegel R, Ward E, Hao Y, Xu J and
Thun MJ: Cancer statistics 2009. CA Cancer J Clin. 59:225–249.
2009. View Article : Google Scholar
|
|
2.
|
Zhang S, Cui Y, Weng Z, Gong X, Chen M and
Zhong B: Changes on the disease pattern of primary colorectal
cancers in Southern China: a retrospective study of 20 years. Int J
Colorectal Dis. 24:943–949. 2009.PubMed/NCBI
|
|
3.
|
Jiang SX, Wang XS, Geng CH and Wang GY:
Altering trend of clinical characteristics of colorectal cancer: a
report of 3,607 cases. Ai Zheng. 28:54–56. 2009.PubMed/NCBI
|
|
4.
|
Suttie SA, Shaikh I, Mullen R, Amin AI,
Daniel T and Yalamarthi S: Outcome of right- and left-sided colonic
and rectal cancer following surgical resection. Colorectal Dis.
13:884–889. 2011. View Article : Google Scholar
|
|
5.
|
Bufill JA: Colorectal cancer: evidence for
distinct genetic categories based on proximal or distal tumor
location. Ann Intern Med. 113:779–788. 1990. View Article : Google Scholar : PubMed/NCBI
|
|
6.
|
Elnatan J, Goh HS and Smith DR: C-KI-RAS
activation and the biological behaviour of proximal and distal
colonic adenocarcinomas. Eur J Cancer. 32A:491–497. 1996.
View Article : Google Scholar : PubMed/NCBI
|
|
7.
|
Bell SM, Scott N, Cross D, et al:
Prognostic value of p53 over-expression and c-Ki-ras gene mutations
in colorectal cancer. Gastroenterology. 104:57–64. 1993.PubMed/NCBI
|
|
8.
|
Breivik J, Meling GI, Spurkland A, Rognum
TO and Gaudernack G: K-ras mutation in colorectal cancer: relations
to patient age, sex and tumour location. Br J Cancer. 69:367–371.
1994. View Article : Google Scholar : PubMed/NCBI
|
|
9.
|
Thibodeau SN, Bren G and Schaid D:
Microsatellite instability in cancer of the proximal colon.
Science. 260:816–819. 1993. View Article : Google Scholar : PubMed/NCBI
|
|
10.
|
Christodoulidis G, Spyridakis M,
Symeonidis D, Kapatou K and Manolakis A: Clinicopathological
differences between right- and left-sided colonic tumors and impact
upon survival. Tech Coloproctol. 14(Suppl 1): S45–S47. 2010.
View Article : Google Scholar : PubMed/NCBI
|
|
11.
|
Wray CM, Ziogas A, Hinojosa MW, Le H,
Stamos MJ and Zell JA: Tumor subsite location within the colon is
prognostic for survival after colon cancer diagnosis. Dis Colon
Rectum. 52:1359–1366. 2009. View Article : Google Scholar : PubMed/NCBI
|
|
12.
|
Benedix F, Kube R, Meyer F, Schmidt U,
Gastinger I and Lippert H; Colon/Rectum Carcinomas (Primary Tumor)
Study Group: Comparison of 17,641 patients with right- and
left-sided colon cancer: differences in epidemiology, perioperative
course, histology, and survival. Dis Colon Rectum. 53:57–64. 2010.
View Article : Google Scholar
|
|
13.
|
Papagiorgis P, Oikonomakis I,
Karapanagiotou I, Wexner SD and Nikiteas N: The impact of tumor
location on the histopathologic expression of colorectal cancer. J
BUON. 11:317–321. 2006.PubMed/NCBI
|
|
14.
|
Yang YH, Dudoit S, Luu P, Lin DM, Peng V,
Ngai J and Speed TP: Normalization for cDNA microarray data: a
robust composite method addressing single and multiple slide
systematic variation. Nucl Acids Res. 30:e152002. View Article : Google Scholar : PubMed/NCBI
|
|
15.
|
Koo CL, Kok LF, Lee MY, et al: Scoring
mechanisms of p16INK4a immunohistochemistry based on either
independent nucleic stain or mixed cytoplasmic with nucleic
expression can significantly signal to distinguish between
endocervical and endometrial adenocarcinomas in a tissue microarray
study. J Transl Med. 7:252009.
|
|
16.
|
Li Y, Basang Z, Ding H, et al: Latexin
expression is down-regulated in human gastric carcinomas and
exhibits tumor suppressor potential. BMC Cancer. 11:1212011.
View Article : Google Scholar : PubMed/NCBI
|
|
17.
|
Roh SS, Lee MH, Hwang YL, et al:
Stimulation of the extra-cellular matrix production in dermal
fibroblasts by velvet antler extract. Ann Dermatol. 22:173–179.
2010. View Article : Google Scholar : PubMed/NCBI
|
|
18.
|
Griffini P, Freitas I, Vigorelli E and Van
Noorden CJ: Changes in the zonation of lactate activity in lobules
of rat liver after experimentally induced colon carcinoma
metastases. Anticancer Res. 14:2537–2540. 1994.PubMed/NCBI
|
|
19.
|
Sherr CJ and Roberts JM: CDK inhibitors:
positive and negative regulators of G1-phase progression. Genes
Dev. 13:1501–1512. 1999. View Article : Google Scholar : PubMed/NCBI
|
|
20.
|
Yan DW, Li DW, Yang YX, et al: Ubiquitin D
is correlated with colon cancer progression and predicts recurrence
for stage II–III disease after curative surgery. Br J Cancer.
103:961–969. 2010.PubMed/NCBI
|
|
21.
|
O’Donovan N, Fischer A, Abdo EM, et al:
Differential expression of IgG Fc binding protein (FcgammaBP) in
human normal thyroid tissue, thyroid adenomas and thyroid
carcinomas. J Endocrinol. 174:517–524. 2002.PubMed/NCBI
|