Introduction
Gastric cancer (GC) is the fourth most common
malignancy with ~1 million patients diagnosed with GC worldwide per
year, and the second leading cause of cancer-related mortality
worldwide with 800,000 fatalities per year (1), though the prevalence and mortality of
GC have gradually decreased (2). In
China, ~0.4 million new cases of GC and 0.3 million fatalities
occurred each year, making it the third leading cause of
cancer-related mortality (3). In
addition, the outcome of GC remains poor with a 5-year survival
rate of only ~20–25% (4).
Accurate prediction of the prognosis of patients
with GC is crucial, as surgery is the most important therapeutic
approach (5). It helps to define
which patients with GC should receive secondary treatments, such as
chemotherapy and/or radiotherapy, which are largely dependent on
clinical staging (6,7).
The prognosis of GC is closely related to the tumor
stage, including the depth of tumor invasion, lymph node status and
distant metastases (8–10). The most commonly used staging system
of GC is proposed by the American Joint Committee on Cancer (AJCC)
and is known as the AJCC tumor-node-metastases (TNM) staging
system. In 2010, the 7th edition of the AJCC gastric cancer staging
manual was ascertained, resulting in much controversy (11). Certain studies confirmed that the
7th AJCC TNM staging system was superior to the 6th AJCC TNM
staging system (12–14), while other studies confirmed the 6th
was better for prognostic stratification (15,16).
In recent years, lymph node ratio (LNR), defined as
the ratio of the number of metastatic lymph nodes (LNs) to the
number of removed LNs, has gained increasing attention in
researches because of its lymph node status (pN) in AJCC TNM
staging system (17–19). However, the analytical methods of
these studies were commonly the same and no in depth investigations
have been conducted.
In this study, GC patients with radical resection
and extended lymphatic resection were selected, as R0 resection
with D2 lymphadenectomy is regarded as the standard surgical
technique in Eastern Asian countries (7). Comprehensive analytical methods were
used to evaluate whether LNR was a superior prognosticator compared
with pN for GC.
Patients and methods
Patients
This retrospective study initially consisted of 613
patients with GC who underwent resection from three tertiary
referral hospitals from January 2004 to August 2011. All the
clinicopathological information was available, including
demographic variables, underlying co-morbidities, surgical
modality, lab and image study information, pathological reports,
pre- and postoperative therapies, and follow-up information. Among
these patients with GC, only those who had >15 LNs resected and
radical resection were enrolled into the final study. Patients who
had palliative resection, ≤15 LNs resected and incomplete follow-up
information were excluded, as this method was more suitable for
those patients with >15 LNs resected. In total, 138 patients
were enrolled into the final study.
The patients were followed up every 3 months during
the first 2 years after surgery, every 6 months during the third
postoperative year and every year thereafter. All the follow-up
information was entered into a database.
Tumor-node-ratio-metastases (TRM) staging
system
For defining the TRM staging system, two recognized
methods were used to determine the best cut-off points for LNR. One
was the commonly used cut-off approach using the log-rank test, the
other was X-tile as reported by Wang et al(17). X-tile determines the optimal cut-off
points of LNR by taking LNR as a continuous variable. Compared with
the commonly used cut-off approach, X-tile controls for the
inflated type I error problem and minimizes information loss. LNR
was then substituted for pN in the 7th AJCC TNM staging system to
generate the TRM staging system as the N classification of the 7th
AJCC TNM staging system is thought to be superior (13).
Statistical analysis
All data were analyzed using SPSS 17.0 statistical
software package (SPSS, Inc., Chicago, IL, USA). Pearson's
correlation coefficient (r) was used to study the correlations
among the number of removed LNs, pN and LNR. The Kaplan-Meier
survival curve was used to study the survival status, and the
log-rank test and Cox proportional hazards model were used to
identify the independent factors for survival. Receiver operating
characteristic (ROC) curve analysis was used to determine the
predictive value of the parameters. Two-sided P<0.05 was
considered to indicate a statistically significant difference.
Results
Characteristics of patients
Among 613 GC patients who had undergone resection
from three tertiary referral hospitals between January 2004 and
August 2011, 138 were enrolled into the final study. By the time of
the last follow-up (May 31, 2012), 76 mortalities had occurred. The
median number of removed LNs was 21 (range 16–47). The median age
of patients was 56 years (range 27–79 years), and the
male-to-female ratio was 2.54 to 1. Detailed information is listed
in Table I.
 | Table IThe characteristics and univariate
analysis of 138 patients with GC. |
Table I
The characteristics and univariate
analysis of 138 patients with GC.
| Variables | n (%) | Events (%) | Median OS (95% CI)
(months) | P-value |
|---|
| Hospital | | | | 0.374 |
| Zhongnan
Hospital | 53 (38.4) | 34 (64.2) | 25.0 (15.4–34.6) | |
| Heji Hospital | 43 (31.2) | 21 (48.4) | 38.9 (35.0–42.8) | |
| Hubei Tumor
Hospital | 42 (30.4) | 21 (50.0) | 34.1 (27.8–40.4) | |
| Gender | | | | 0.171 |
| Male | 99 (71.7) | 52 (52.5) | 36.4 (25.8–47.0) | |
| Female | 39 (28.3) | 24 (61.5) | 27.0 (16.3–37.7) | |
| Age (years) | | | | 0.216 |
| ≤65 | 101 (73.2) | 52 (51.5) | 36.4 (17.5–55.3) | |
| >65 | 37 (26.8) | 24 (64.9) | 25.0 (16.1–33.9) | |
| Cancer site | | | | 0.020 |
| Upper third | 31 (22.5) | 14 (45.2) | 31.1 (25.6–36.5) | |
| Middle third | 27 (19.6) | 15 (55.6) | 25.0 (10.9–39.1) | |
| Lower third | 70 (50.7) | 39 (55.7) | 36.4 (25.3–47.5) | |
| Whole stomach | 10 (7.2) | 8 (80.0) | 8.7 (4.1–13.4) | |
| Pathological
type | | | | 0.126 |
| Intestinal | 106 (76.8) | 57 (53.8) | 35.9 (25.7–46.1) | |
| Diffuse | 12 (8.7) | 5 (41.7) | 25.9 (19.3–32.4) | |
| Mixed | 20 (14.5) | 14 (70.0) | 14.1 (8.2–20.0) | |
| Surgery type | | | | 0.044 |
| Proximal
gastrectomy | 36 (26.1) | 16 (44.4) | 30.7
(25.4–36.0) | |
| Distant
gastrectomy | 81 (58.7) | 44 (54.3) | 36.4
(25.6–47.2) | |
| Total
gastrectomy | 21 (15.2) | 16 (76.2) | 13.4
(1.9–24.9) | |
| Tumor invasion | | | | 0.004 |
| T1 | 6 (4.3) | 2 (33.3) | 43.5
(26.3–60.7) | |
| T2 | 21 (15.2) | 4 (19.0) | 75.0
(61.3–88.8) | |
| T3 | 1 (0.7) | 1 (100.0) | 15.8
(15.8–15.8) | |
| T4a | 79 (57.2) | 48 (60.8) | 28.2
(16.7–39.7) | |
| T4b | 31 (22.5) | 21 (67.7) | 17.5
(10.4–24.6) | |
| pN | | | | <0.001 |
| N0 | 33 (23.9) | 10 (30.3) | 64.4
(50.9–77.9) | |
| N1 | 19 (13.8) | 7 (36.8) | 61.5
(44.4–78.6) | |
| N2 | 25 (18.1) | 14 (56.0) | 27.0
(15.4–38.6) | |
| N3 | 61 (44.2) | 45 (73.8) | 14.6
(8.4–20.8) | |
| LNR | | | | <0.001 |
| R0 | 33 (23.9) | 10 (30.3) | 64.4
(50.9–77.9) | |
| R1 | 68 (49.3) | 34 (50.0) | 37.8
(19.6–56.0) | |
| R2 | 24 (17.4) | 19 (79.2) | 13.8
(6.4–21.2) | |
| R3 | 13 (9.4) | 13 (100.0) | 7.5 (2.2–12.7) | |
| Distant
metastases | | | | <0.001 |
| M0 | 128 (92.8) | 66 (51.6) | 36.4
(27.8–45.0) | |
| M1 | 10 (7.2) | 10 (100.0) | 11.4
(7.6–15.1) | |
| TNM staging | | | | <0.001 |
| I | 18 (13.0) | 3 (16.7) | 77.2
(63.4–91.0) | |
| II | 19 (13.8) | 7 (36.8) | 43.4
(32.3–54.5) | |
| IIIA | 17 (12.3) | 6 (35.3) | 64.5
(47.7–81.3) | |
| IIIB | 15 (10.9) | 9 (60.0) | 28.0
(25.0–31.0) | |
| IIIC | 61 (44.2) | 43 (70.5) | 14.6
(8.6–20.5) | |
| IV | 8 (5.8) | 8 (100.0) | 11.4
(2.1–20.7) | |
| TRM staging | | | | <0.001 |
| I | 18 (13.0) | 3 (16.7) | 77.2
(63.4–91.0) | |
| II | 20 (14.5) | 7 (35.0) | 44.3
(33.4–55.1) | |
| IIIA | 40 (29.0) | 21 (52.5) | 36.4
(4.3–68.5) | |
| IIIB | 32 (23.2) | 17 (53.1) | 25.0
(10.1–39.9) | |
| IIIC | 20 (14.5) | 20 (100.0) | 11.3
(9.1–13.5) | |
| IV | 8 (5.8) | 8 (100.0) | 11.4
(2.1–20.7) | |
| Postoperative
SAE | | | | <0.001 |
| No | 118 (85.5) | 57 (48.3) | 38.9
(20.7–57.1) | |
| Yes | 20 (14.5) | 19 (95.0) | 13.4
(5.9–20.9) | |
| Chemotherapy | | | | 0.183 |
| No | 52 (37.7) | 31 (59.6) | 23.5
(14.5–32.5) | |
| Yes | 86 (62.3) | 45 (52.3) | 37.8
(22.2–53.4) | |
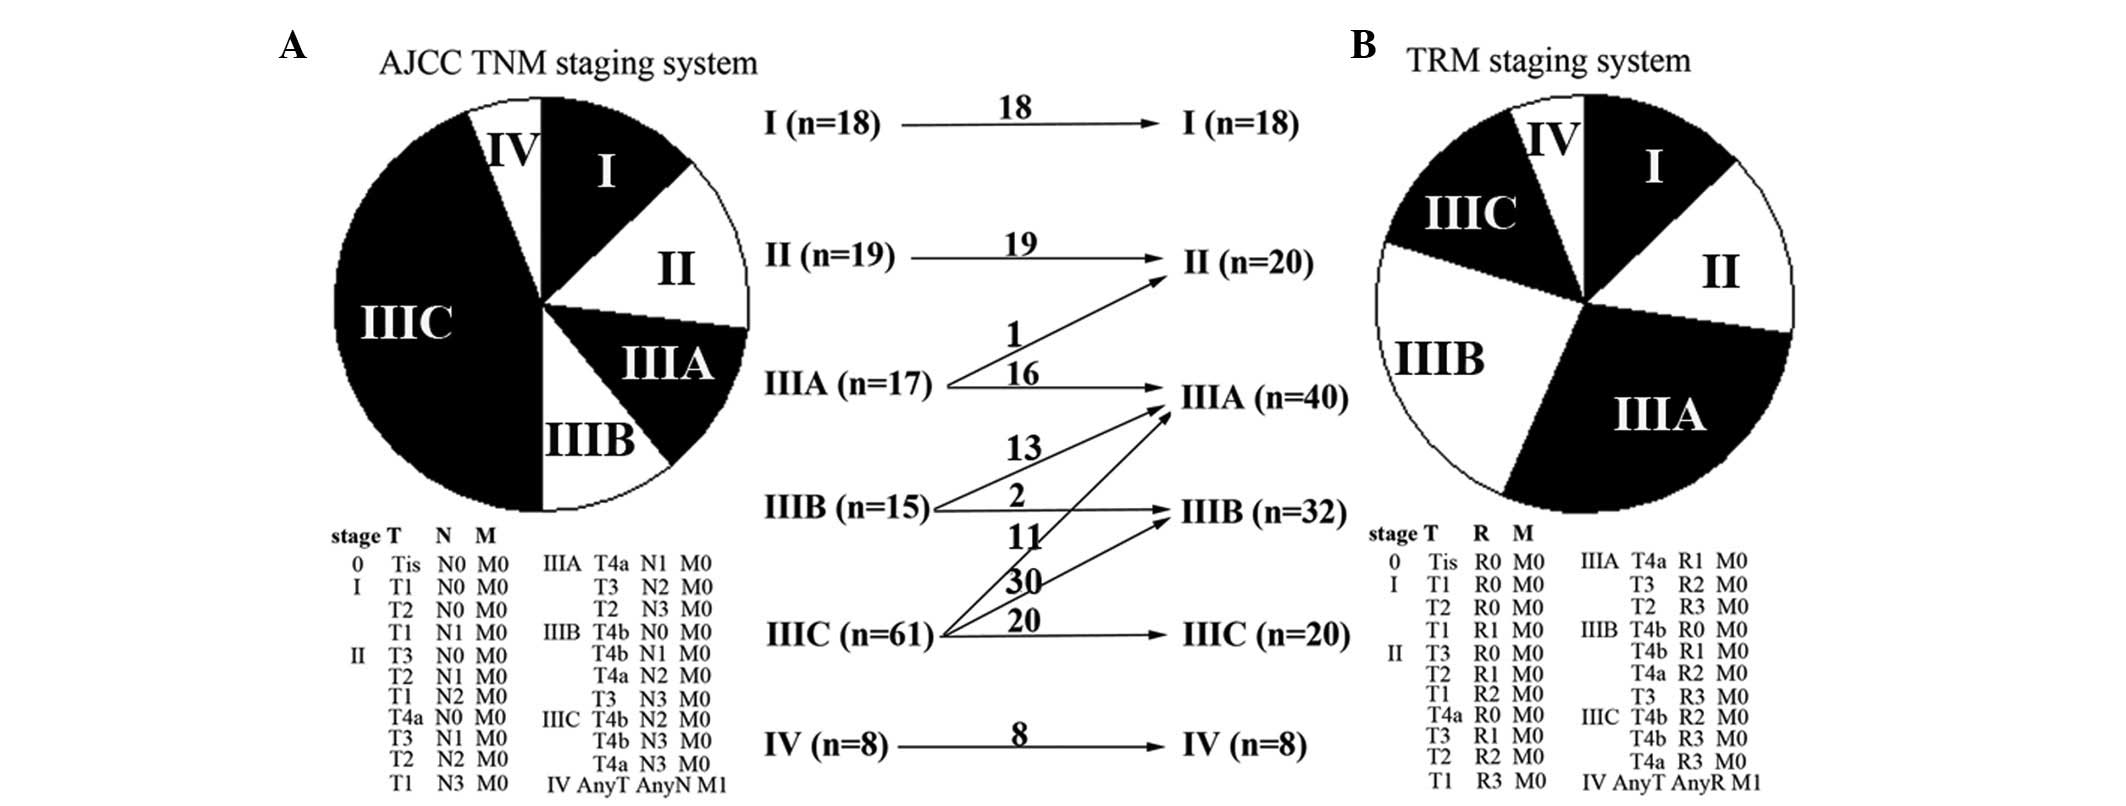
TRM staging system
According to the commonly used cut-off approach by
the log-rank test, three cut-off points were generated: 0, 0.50 and
0.80. According to X-tile (http://www.tissuearray.org/rimmlab/), patients with
LNR=0 were fixed into one group, as it has been demonstrated that
their prognosis was significantly different from patients with LNR
>0 (20). The remaining patients
were analyzed and the two other cut-off points were 0.48 and 0.79.
Considering the log-rank test results and clinical feasibility, the
final cut-off points for LNR were set as 0, 0.5 and 0.8. Four
subgroups were then determined (R0, LNR=0; R1, LNR ≤0.5; R2,
0.5> LNR ≤0.8; and R3, LNR >0.8), and the TRM staging system
was generated. Compared with the 7th AJCC TNM staging system, 55
(39.9%) GC patients were downstaged and no patients were upstaged
in the TRM staging system (Fig.
1).
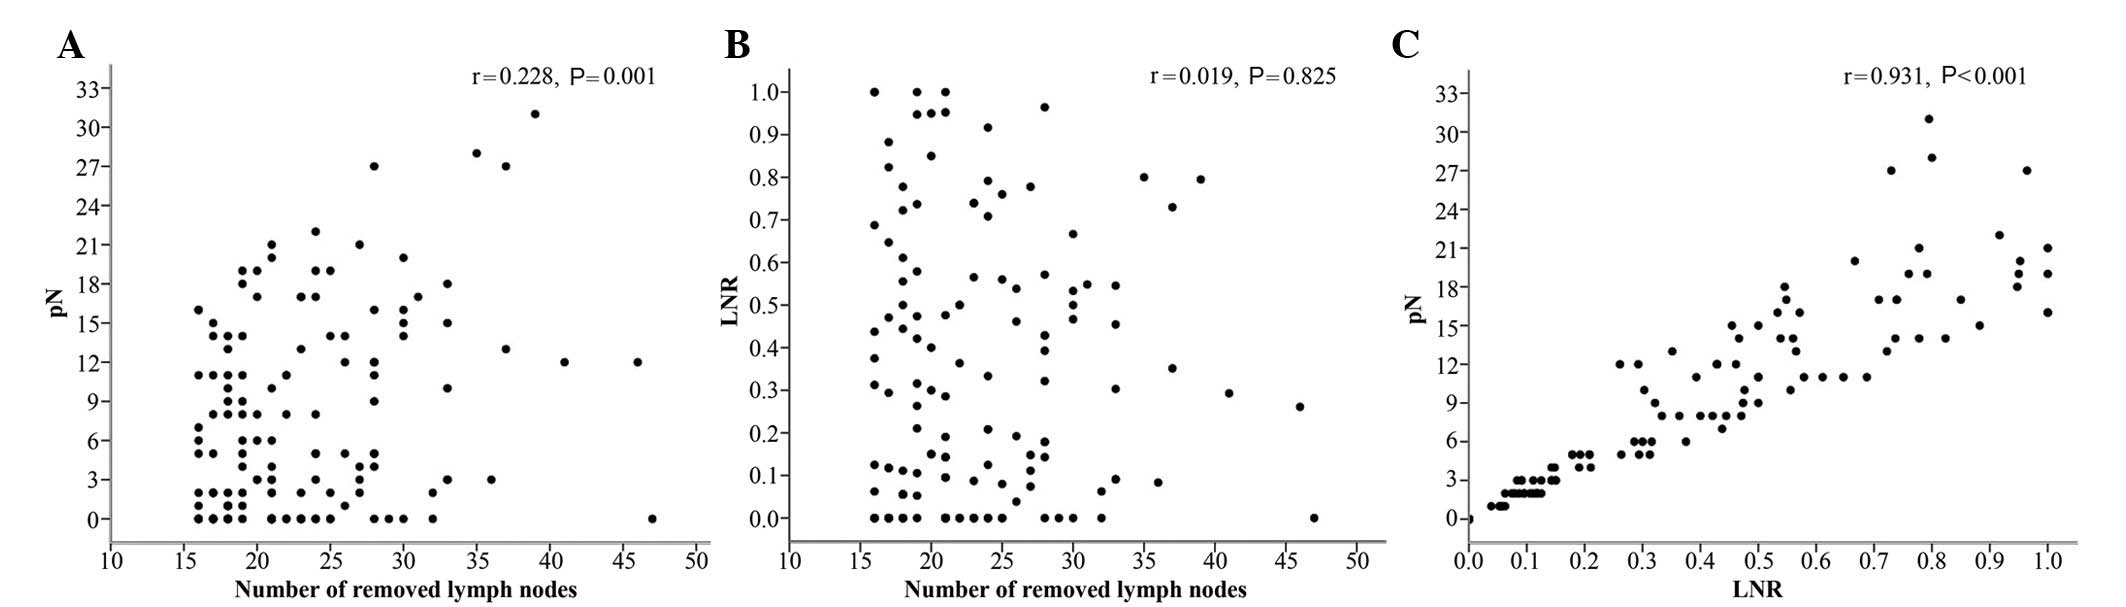
Correlations between the number of
removed LNs, pN and LNR
There was a significant correlation between the
number of removed LNs and pN (r=0.228, P=0.001) (Fig. 2A). There was no significant
correlation between the number of removed LNs and LNR (r=0.019,
P=0.825) (Fig. 2B). The difference
between pN and LNR was statistically significant (r=0.931,
P<0.001) (Fig. 2C). These
results demonstrated that LNR was not influenced by surgery;
however, pN was.
Univariate and multivariate analyses
By the Kaplan-Meier curve and log-rank test, nine
factors were identified as possible determinants on overall
survival (OS), including cancer site (P=0.020), tumor invasion
(P=0.004), pN (P<0.001), LNR (P<0.001), distant metastases
(P<0.001), TNM staging (P<0.001), TRM staging (P<0.001),
surgery type (P=0.044) and postoperative serious adverse events
(SAEs) (P<0.001). All factors were then integrated into
multivariate analysis using Cox proportional hazards model, and
both LNR and pN were found to be independent prognostic factors
(Table II).
| Table IIIndependent prognostic factors of 138
GC patients identified by multivariate analysis. |
Table II
Independent prognostic factors of 138
GC patients identified by multivariate analysis.
| Variables | χ2 | Hazard ratio (95%
CI) | P-value |
|---|
| TNM-based |
| pN | | | 0.004 |
| N0
(reference) |
| N1 | 0.356 | 1.342
(0.510–3.531) | 0.551 |
| N2 | 4.022 | 2.301
(1.019–5.193) | 0.045 |
| N3 | 11.120 | 3.319
(1.640–6.718) | 0.001 |
| Postoperative
SAE | | | 0.014 |
| No
(reference) |
| Yes | 6.034 | 1.991
(1.149–3.449) | |
| TRM-based |
| LNR | | | <0.001 |
| R0
(reference) |
| R1 | 2.515 | 1.775
(0.873–3.609) | 0.113 |
| R2 | 18.771 | 5.636
(2.578–12.321) | <0.001 |
| R3 | 34.116 | 15.113
(6.076–37.591) | <0.001 |
| Distant
metastases | | | 0.006 |
| No
(reference) |
| Yes | 7.685 | 2.728
(1.342–5.548) | |
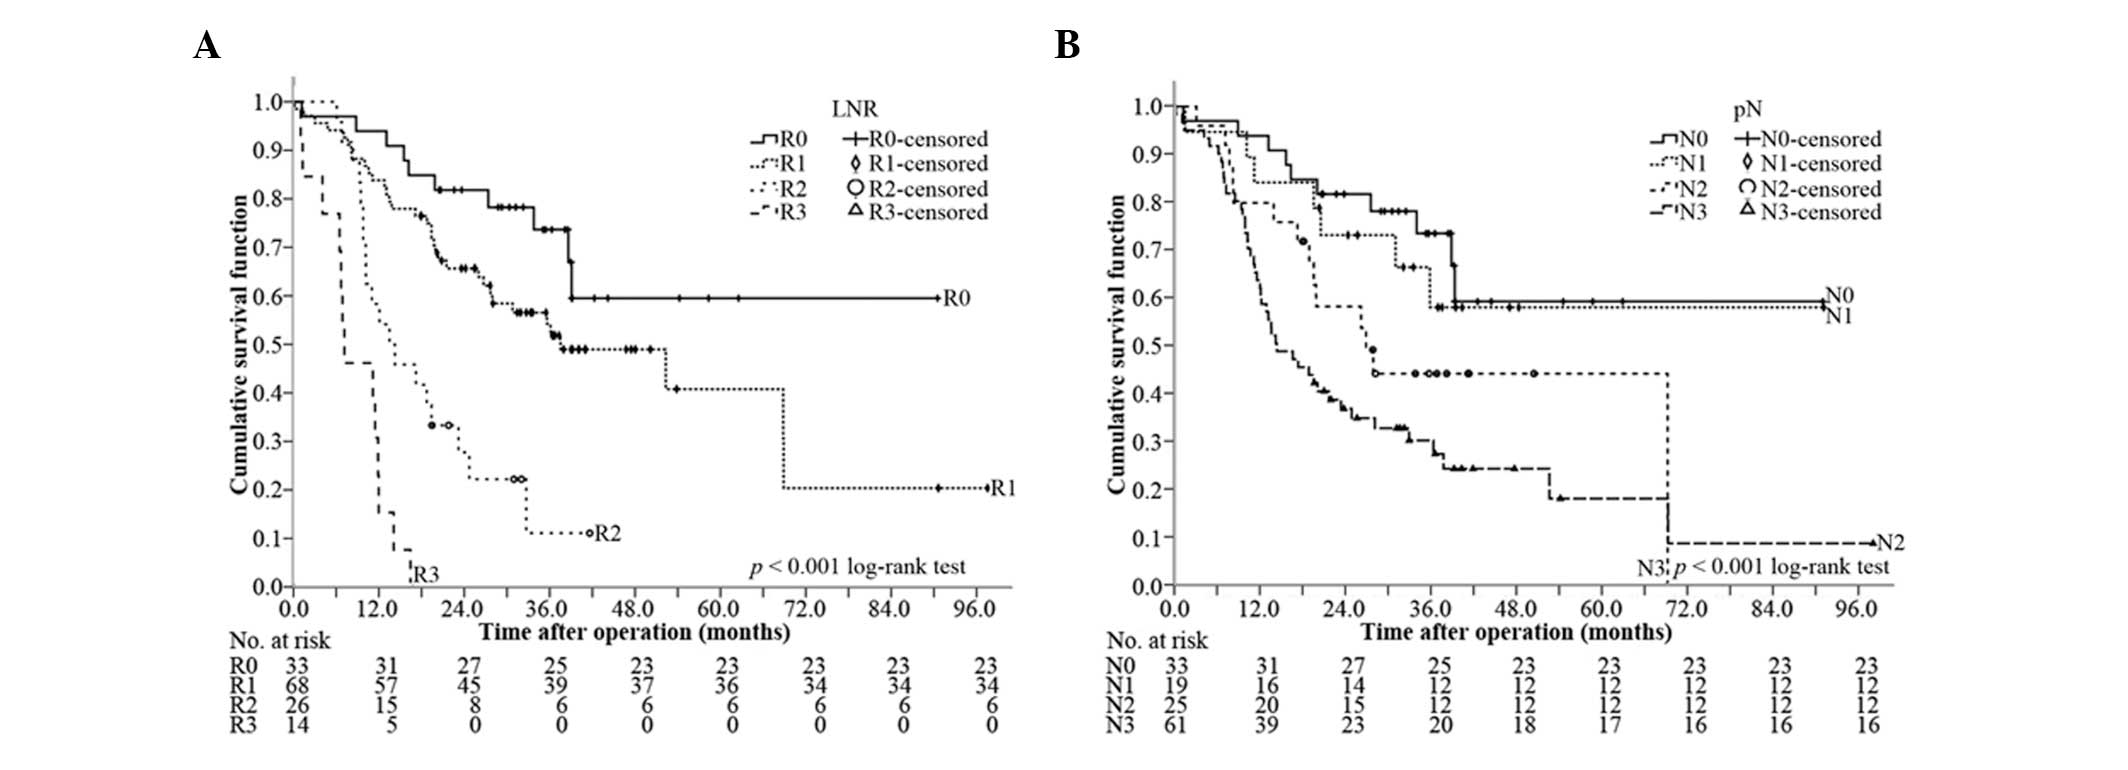
Comparison of the discriminative power
between pN and LNR for OS
The median OS of R0, R1, R2 and R3 was 64.4 months
[95% confidence interval (CI), 50.9–77.9 months], 37.8 months (95%
CI, 19.6–56.0 months), 13.8 months (95% CI, 6.4–21.2 months) and
7.5 months (95% CI, 2.2–12.7 months), respectively (P<0.001,
overall comparison; P=0.071 for R0 vs. R1; P<0.001 for R1 vs.
R2; and P=0.001 for R2 vs. R3) (Fig.
3A). In comparison, the median OS of N0, N1, N2 and N3 was 64.4
months (95% CI, 50.9–77.9 months), 61.5 months (95% CI, 44.4–78.6
months), 27.0 months (95% CI, 15.4–38.6 months) and 14.6 months
(95% CI, 8.4–20.8 months), respectively (P<0.001, all overall
comparison; P=0.597 for N0 vs. N1; P=0.168 for N1 vs. N2; P=0.122
for N2 vs. N3) (Fig. 3B).
Therefore, LNR could better differentiate OS than LN.
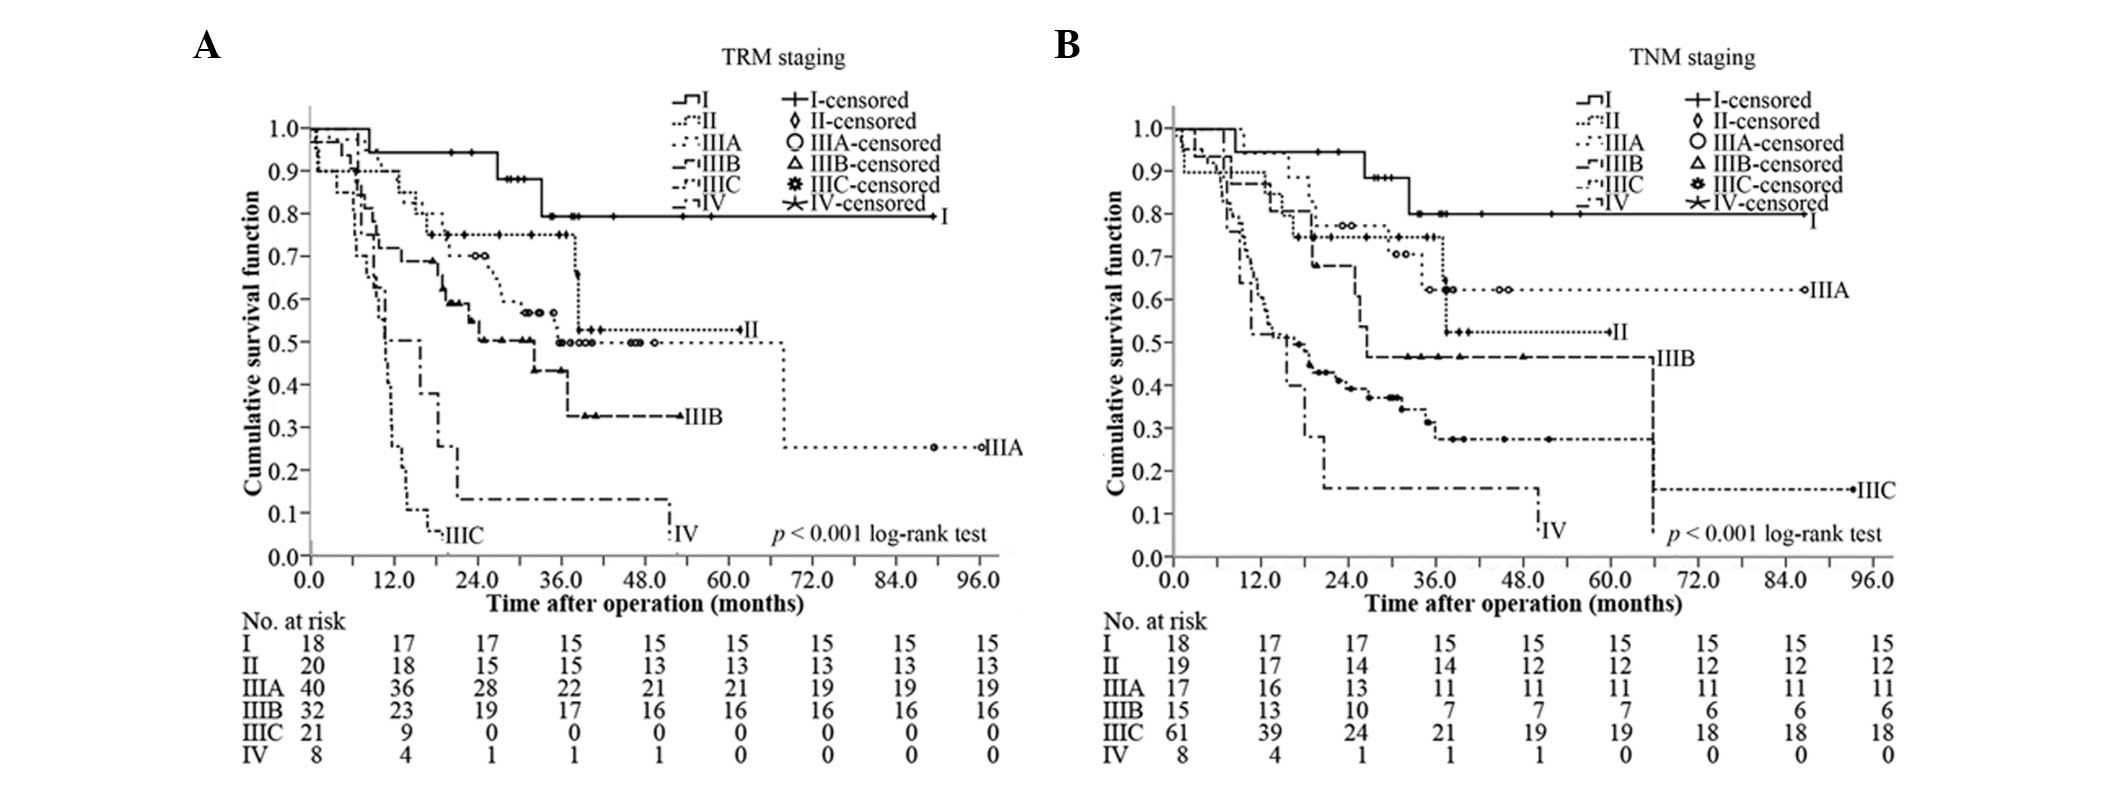
Comparison of the discriminative power
between TRM staging and TNM staging for OS
At the median follow-up of 38.3 months (range,
9.9–97.7 months), the median OS was 23.9 months (95% CI, 18.8–29.0
months), and the 1-, 2-, 3- and 5-year survival rates were 76.8,
57.2, 50.0 and 46.4%, respectively. Based on the TRM staging, the
median OS of stages I, II, IIIA, IIIB, IIIC and IV was 77.2 months
(95% CI, 63.4–91.0 months), 44.3 months (95% CI, 33.4–55.1 months),
36.4 months (95% CI, 4.3–68.5 months), 25.0 months (95% CI,
10.1–39.9 months), 11.3 months (95% CI, 9.1–13.5 months) and 11.4
months (95% CI, 2.1–20.7 months), respectively (P<0.001, overall
comparison; P=0.228 for I vs. II; P=0.490 for II vs. IIIA; P=0.173
for IIIA vs. IIIB; P<0.001 for IIIB vs. IIIC, P=0.072 for IIIC
vs. IV) (Fig. 4A). By comparison,
the median OS of stages I, II, IIIA, IIIB, IIIC and IV of TNM
staging was 77.2 months (95% CI, 63.4–91.0 months), 43.4 months
(95% CI, 32.3–54.5 months), 64.5 months (95% CI, 47.7–81.3 months),
28.0 months (95% CI, 25.0–31.0 months), 14.6 months (95% CI,
8.6–20.5 months) and 11.4 months (95% CI, 2.1–20.7 months),
respectively (P<0.001, overall comparison; P=0.190 for I vs. II;
P=0.786 for II vs. IIIA; P=0.180 for IIIA vs. IIIB; P=0.181 for
IIIB vs. IIIC, P=0.212 for IIIC vs. IV) (Fig. 4B). TRM staging was capable of
discriminating stages IIIB and IIIC, but TNM staging could not
discriminate any neighboring subgroups.
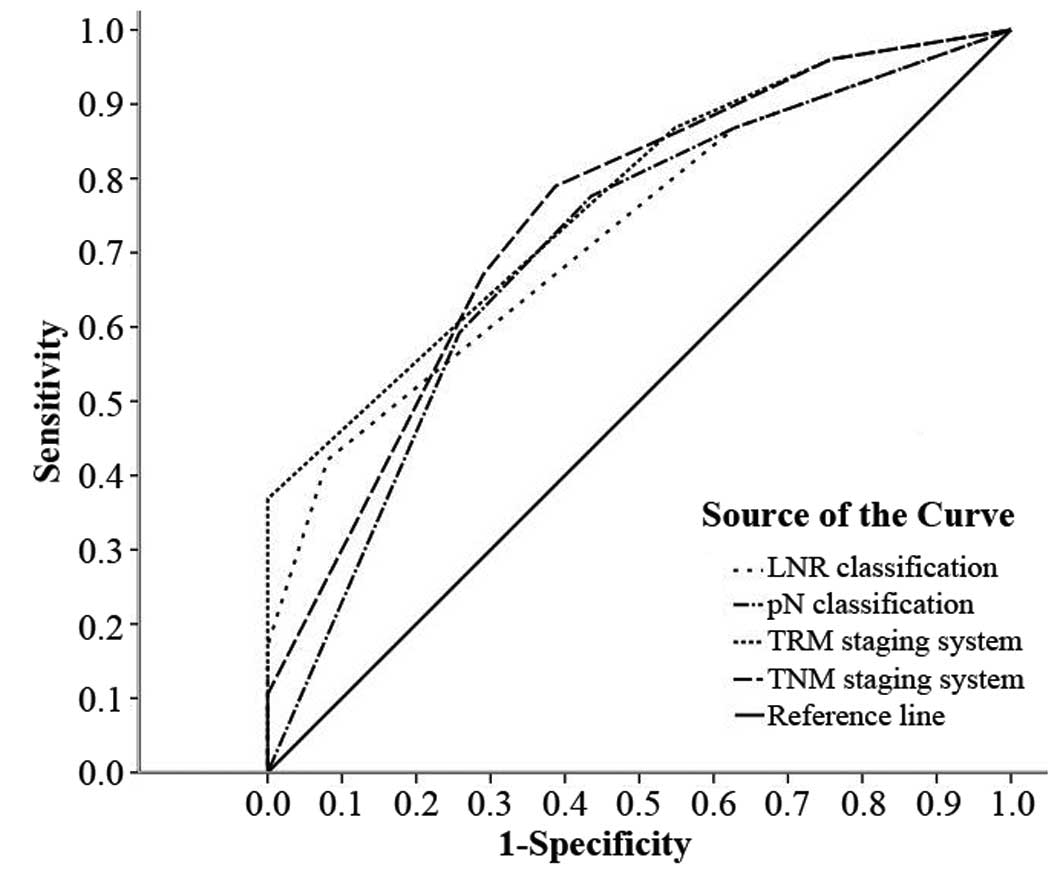
Predictive accuracy
The predictive value of the LNR classification, pN
classification, TRM staging system and TNM staging system was
further studied by ROC analysis. All of the factors predicted
mortality precisely (P<0.01) (Table III). The TRM staging system was
better to predict the clinical outcomes than the TNM staging
system, and LNR was better than pN (Fig. 5).
| Table IIIPredictive value of the factors
assessed in ROC analysis. |
Table III
Predictive value of the factors
assessed in ROC analysis.
| | 95% CI | | |
|---|
| |
| | |
|---|
| Staging
systems | AUC | Lower | Upper | Std. error | P-value |
|---|
| TRM staging
system | 0.769 | 0.692 | 0.845 | 0.039 | <0.001 |
| TNM staging
system | 0.745 | 0.662 | 0.827 | 0.042 | <0.001 |
| LNR
classification | 0.724 | 0.641 | 0.807 | 0.042 | <0.001 |
| pN
classification | 0.704 | 0.615 | 0.792 | 0.045 | <0.001 |
Discussion
Due to the shortcomings of the AJCC TNM staging
system, increasing numbers of investigators have shifted their
attention to looking for an optimal method. The most popular and
the most recognized optimal method was the TRM staging system based
on LNR. Table IV lists a number of
previous studies on LNR, and these studies confirmed the
superiority of the LNR and TRM staging system compared with the
AJCC TNM staging system through univariate and multivariate
analysis and Kaplan-Meier survival curves (8). In the present study, the cut-off
points were 0, 0.50 and 0.80.
| Table IVInformation on LNR from previous
studies and the present study. |
Table IV
Information on LNR from previous
studies and the present study.
| Authors (ref.) | No. of
patients | No. of removed LNs
(range) | Cutoff points of
LNR | 5-year survival
rates of R0, R1, R2, R3 (%) |
|---|
| Kim et
al(19) | 529 | 6a(1–104) | 0, 0.30, 0.60 | 71.7, 35.7, 16.3,
0 |
| Asoglu et
al(20) | 264 | 27b(16–75) | 0, 0.10, 0.25 | 86.9, 81.1, 47.1,
24.7 |
| Xu et
al(21) | 177 | 20a(16–53) | 0, 0.10, 0.25 | 84.3, 71.1, 45.1,
24.2 |
| Lee et
al(22) | 342 | 28.9b(16–98) | 0, 0.30, 0.60 | Unknown |
| Huang et
al(23) | 634 | 23a(5–61) | 0, 0.20, 0.50 | 83.3, 68.4, 40.7,
17.2 |
| Feng et
al(24) | 109 | 38.34b | 0, 0.10, 0.25 | 58.8, 43.8, 25.0,
10.4 |
| Lemmens et
al(25) | 880 | 7a (unknown) | 0, 0.20, 0.30 | 58, 50, 18, 11 |
| Wang et
al(16) | 1343 | 15b(3–72) | 0, 0.30, 0.60 | 77.5, 64.3, 39.7,
22.3 |
| Qiu et
al(26) | 730 | 16a (0–72) | 0, 0.30, 0.60 | 72.1, 65.6, 30.3,
13.0 |
| Present study | 138 | 21a(16–47) | 0, 0.50, 0.80 | 69.7, 52.9, 20.8,
0 |
In our previous study of GC, patients with stage
IIIB and beyond had much poorer OS than other patients. In this
study, stage IIIB and beyond accounted for >60% of patients in
TNM staging, but <45% in TRM staging, as 24 (17.4%) patients
were downstaged to stage IIIA. The prognosis of patients with
different classifications could apparently be discriminated, and
this may provide a basis for determining secondary treatment.
In routine clinical practice, LN resection in GC
patients is generally not up to D2 lymphadenectomy standard,
despite D2 lymphadenectomy being regarded as the standard surgical
technique in Eastern Asian countries (21,22).
Certain studies did not consider this factor in the inclusion
criteria (17,23,27,30),
weakening the credibility of the results. In this study, only
patients with >15 LN resections were included. However, pN is
correlated with surgery, whereas LNR is not. Therefore, in
univariate and multivariate analyses, both pN and LNR were
independent prognostic factors, indicating that LNR was closely
associated with prognosis, similar to pN. Moreover, the LNR and TRM
staging system could better discriminate subgroups (Figs. 3 and 4), as confirmed by other studies (17,23–27,29).
From this perspective, LNR was a better prognosticator than pN.
As to the predictive accuracy analysis, there has
been no validated standard. The most commonly used methods were the
area under the curve by ROC analysis, the concordance index,
explained variation and a summary measure of separation (31). In this study, the TRM staging system
had the maximal area under the curve by ROC, and LNR also had a
bigger area than pN.
In conclusion, LNR may be a better prognosticator
than pN for the following reasons: i) LNR has no correlation with
surgery; ii) there were 55 (39.9%) GC patients down-staged and no
patients upstaged in the TRM staging system; iii) in univariate and
multivariate analysis, both LNR and pN were independent prognostic
factors; iv) the LNR and TRM staging system were capable of better
differentiating patients than the pN and TNM staging system; v) in
ROC analysis, the LNR and TRM staging system have a greater area
than the pN and TNM staging system, respectively. The resulting TRM
staging system may better predict the clinical outcomes.
Acknowledgements
This study is supported by the Academic Award for
Excellent PhD Candidates Funded by the Ministry of Education of
China (no. 5052011303014), the Science Fund of the National Natural
Science Foundation of China (no. 81171396), the Science Fund for
Creative Research Groups of the National Natural Science Foundation
of China (nos. 20621502, 20921062) and the Fundamental Research
Funds for the Central Universities of Ministry of Education of
China (no. 4103005).
References
|
1
|
Jemal A, Bray F, Center MM, Ferlay J, Ward
E and Forman D: Global cancer statistics. CA Cancer J Clin.
61:69–90. 2011. View Article : Google Scholar
|
|
2
|
Ferlay J, Shin HR, Bray F, Forman D,
Mathers C and Parkin DM: Estimates of worldwide burden of cancer in
2008: GLOBOCAN 2008. Int J Cancer. 127:2893–2917. 2010. View Article : Google Scholar : PubMed/NCBI
|
|
3
|
Yang L: Incidence and mortality of gastric
cancer in China. World J Gastroenterol. 12:17–20. 2006.
|
|
4
|
Hartgrink HH, Jansen EP, van Grieken NC
and van de Velde CJ: Gastric cancer. Lancet. 374:477–490. 2009.
View Article : Google Scholar
|
|
5
|
Wang XN and Liang H: Some problems in the
surgical treatment of gastric cancer. Chin J Cancer. 29:369–373.
2010. View Article : Google Scholar : PubMed/NCBI
|
|
6
|
Viudez-Berral A, Miranda-Murua C,
Arias-de-la-Vega F, et al: Current management of gastric cancer.
Rev Esp Enferm Dig. 104:134–141. 2012. View Article : Google Scholar
|
|
7
|
Lee JH, Kim KM, Cheong JH and Noh SH:
Current management and future strategies of gastric cancer. Yonsei
Med J. 53:248–257. 2012. View Article : Google Scholar : PubMed/NCBI
|
|
8
|
Wu HL, Tian Q, Peng CW, Liu SP and Li Y:
Multivariate survival and outcome analysis of 154 patients with
gastric cancer at a single Chinese institution. Asian Pac J Cancer
Prev. 12:3341–3345. 2011.PubMed/NCBI
|
|
9
|
Landry CS, Brock G, Scoggins CR, McMasters
KM and Martin RN II: A proposed staging system for gastric
carcinoid tumors based on an analysis of 1,543 patients. Ann Surg
Oncol. 16:51–60. 2009. View Article : Google Scholar : PubMed/NCBI
|
|
10
|
Cammerer G, Formentini A, Karletshofer M,
Henne-Bruns D and Kornmann M: Evaluation of important prognostic
clinical and pathological factors in gastric cancer. Anticancer
Res. 32:1839–1842. 2012.PubMed/NCBI
|
|
11
|
Washington K: 7th edition of the AJCC
cancer staging manual: stomach. Ann Surg Oncol. 17:3077–3079. 2010.
View Article : Google Scholar : PubMed/NCBI
|
|
12
|
Sun Z, Wang ZN, Zhu Z, et al: Evaluation
of the seventh edition of American Joint Committee on Cancer TNM
staging system for gastric cancer: results from a Chinese
monoinstitutional study. Ann Surg Oncol. 19:1918–1927. 2012.
View Article : Google Scholar : PubMed/NCBI
|
|
13
|
Chae S, Lee A and Lee JH: The
effectiveness of the new (7th) UICC N classification in the
prognosis evaluation of gastric cancer patients: a comparative
study between the 5th/6th and 7th UICC N classification. Gastric
Cancer. 14:166–171. 2011. View Article : Google Scholar : PubMed/NCBI
|
|
14
|
Ahn HS, Lee HJ, Hahn S, et al: Evaluation
of the seventh American Joint Committee on Cancer/International
Union Against Cancer Classification of gastric adenocarcinoma in
comparison with the sixth classification. Cancer. 116:5592–5598.
2010. View Article : Google Scholar
|
|
15
|
Wang W, Sun XW, Li CF, et al: Comparison
of the 6th and 7th editions of the UICC TNM staging system for
gastric cancer: results of a Chinese single-institution study of
1,503 patients. Ann Surg Oncol. 18:1060–1067. 2011. View Article : Google Scholar : PubMed/NCBI
|
|
16
|
Kim SS, Choi BY, Seo SI, et al: The
comparison between 6th and 7th International Union Against
Cancer/American Joint Committee on Cancer Classification for
Survival Prognosis of Gastric Cancer. Korean J Gastroenterol.
58:258–263. 2011.(In Korean).
|
|
17
|
Wang W, Xu DZ, Li YF, et al:
Tumor-ratio-metastasis staging system as an alternative to the 7th
edition UICC TNM system in gastric cancer after D2 resection -
results of a single-institution study of 1343 Chinese patients. Ann
Oncol. 22:2049–2056. 2011. View Article : Google Scholar : PubMed/NCBI
|
|
18
|
Wang J, Dang P, Raut CP, et al: Comparison
of a lymph node ratio-based staging system with the 7th AJCC system
for gastric cancer: analysis of 18,043 patients from the SEER
database. Ann Surg. 255:478–485. 2012. View Article : Google Scholar : PubMed/NCBI
|
|
19
|
Lee SR, Kim HO, Son BH, Shin JH and Yoo
CH: Prognostic significance of the metastatic lymph node ratio in
patients with gastric cancer. World J Surg. 36:1096–1101. 2012.
View Article : Google Scholar : PubMed/NCBI
|
|
20
|
Liu X, Cai H, Shi Y and Wang Y: Prognostic
factors in patients with node-negative gastric cancer: a single
center experience from China. J Gastrointest Surg. 16:1123–1127.
2012. View Article : Google Scholar : PubMed/NCBI
|
|
21
|
Diaz de Liaño A, Yarnoz C, Aguilar R,
Artieda C and Ortiz H: Rationale for gastrectomy with D2
lymphadenectomy in the treatment of gastric cancer. Gastric Cancer.
11:96–102. 2008.PubMed/NCBI
|
|
22
|
D’Annibale A, Pende V, Pernazza G, et al:
Full robotic gastrectomy with extended (D2) lymphadenectomy for
gastric cancer: surgical technique and preliminary results. J Surg
Res. 166:113–120. 2011.PubMed/NCBI
|
|
23
|
Kim CY and Yang DH: Adjustment of N stages
of gastric cancer by the ratio between the metastatic and examined
lymph nodes. Ann Surg Oncol. 16:1868–1874. 2009. View Article : Google Scholar : PubMed/NCBI
|
|
24
|
Asoglu O, Karanlik H, Parlak M, et al:
Metastatic lymph node ratio is an independent prognostic factor in
gastric cancer. Hepatogastroenterology. 56:908–913. 2009.PubMed/NCBI
|
|
25
|
Xu DZ, Geng QR, Long ZJ, et al: Positive
lymph node ratio is an independent prognostic factor in gastric
cancer after d2 resection regardless of the examined number of
lymph nodes. Ann Surg Oncol. 16:319–326. 2009. View Article : Google Scholar : PubMed/NCBI
|
|
26
|
Lee SY, Hwang I, Park YS, Gardner J and Ro
JY: Metastatic lymph node ratio in advanced gastric carcinoma: A
better prognostic factor than number of metastatic lymph nodes? Int
J Oncol. 36:1461–1467. 2010.PubMed/NCBI
|
|
27
|
Huang CM, Lin JX, Zheng CH, et al:
Prognostic impact of metastatic lymph node ratio on gastric cancer
after curative distal gastrectomy. World J Gastroenterol.
16:2055–2060. 2010. View Article : Google Scholar : PubMed/NCBI
|
|
28
|
Feng J, Wu YF, Xu HM, Wang SB and Chen JQ:
Prognostic significance of the metastatic lymph node ratio in T3
gastric cancer patients undergoing total gastrectomy. Asian Pac J
Cancer Prev. 12:3289–3292. 2011.PubMed/NCBI
|
|
29
|
Lemmens V, Dassen AE, van der Wurff A,
Coebergh J and Bosscha K: Lymph node examination among patients
with gastric cancer: variation between departments of pathology and
prognostic impact of lymph node ratio. Eur J Surg Oncol.
37:488–496. 2011. View Article : Google Scholar : PubMed/NCBI
|
|
30
|
Qiu MZ, Qiu HJ, Wang ZQ, et al: The
tumor-log odds of positive lymph nodes-metastasis staging system, a
promising new staging system for gastric cancer after D2 resection
in China. PLoS One. 7:e317362012. View Article : Google Scholar : PubMed/NCBI
|
|
31
|
Peng CW, Wang LW, zeng WJ, Yang XJ and Li
Y: Evaluation of the staging system for gastric cancer. J Surg
Oncol. 108:93–105. 2013. View Article : Google Scholar
|