Introduction
Integrated 2-deoxy-2-F18-fluoro-D-glucose
positron emission tomography combined with computed tomography
(FDG-PET/CT) has increasingly been used for the management of
patients with various types of cancer, including soft tissue
tumors. FDG-PET can determine the tumor characteristics of high
metabolism and an increased rate of glucose utilization compared
with normal tissues. The high capacity of glucose utilization is a
possible reflection of the malignant nature of a tumor. A high
maximum standardized uptake value (SUVmax) is one of the
informative biomarkers measured using this modality for the
differential diagnosis between malignant and benign tumors.
Numerous studies (1–3) previously proposed that a threshold
SUVmax value of 1.9–2.0 may contribute to the differential
diagnosis. Conversely, CT can evaluate the size of soft tissue
tumors, and it is well-known that a tumor size ≥5 cm is highly
likely to be a malignant soft tissue tumor (4,5).
Integrated FDG-PET/CT, which can evaluate tumor function and
perform a morphological assessment at the same time, may therefore
have an advantage for differentiating between a malignant and a
benign soft tissue tumor.
Certain malignant soft tissue tumors frequently
develop to distant metastases and local recurrences. Integrated
FDG-PET/CT is able to rapidly predict the biological activity of
tumors (6,7). SUVmax values in integrated FDG-PET can
predict biological activity of tumors, as well as the tumor grade.
SUVmax values of metastatic and recurrent tumors are generally
considered to be higher when compared with primary lesions
(8); however, few studies have
focused on this issue in the field of soft tissue tumors.
To monitor soft tissue tumors at follow-up, the
orthopedic oncologists and radiologists must be aware of the
capabilities and limitations of integrated FDG-PET/CT for the
evaluation of soft tissue tumors. The present study was composed of
two clinical studies. First, the diagnostic criteria for malignant
soft tissue tumors were defined as a tumor ≥5 cm in size and an
SUVmax of ≥2.0; this was interpreted using integrated FDG-PET/CT.
Furthermore, the efficacy of these criteria in differentiating
malignant from benign soft tissue tumors and establishing patient
prognoses was examined. Second, the role of integrated FDG-PET/CT
in comparing metastases/recurrences to primary tumors in the same
individuals was investigated.
Materials and methods
From our database comprising of 243 bone and soft
tissue tumors, which were obtained from patients who were examined
by pre-operative integrated FDG-PET imaging during the period from
December 2004 to December 2012, 113 patients with soft tissue
tumors were biopsied or surgically treated, pathologically
recognized, and followed up at the Department of Orthopedic
Surgery, Osaka City University Graduate School of Medicine (Osaka,
Japan). These patients consisted of 58 males and 55 females,
ranging in age from 17 to 91 years (mean age, 56.2±16.6 years). All
of the follow-up patient data were available and the median
follow-up period was 24.5±20.9 months. Clinical information was
retrospectively reviewed in the present study and focused on
clinical features, radiological findings, histopathology and
prognoses of the patients, compared with SUVmax.
In accordance with previous studies (1–5), the
diagnostic criteria for a malignant soft tissue tumor using
integrated FDG-PET/CT was defined as a tumor sized ≥5 cm with an
SUVmax ≥2.0. The sensitivity and accuracy was calculated using
these criteria and the patient survival curve was estimated using
the Kaplan-Meier method. Group 1 (G1) is formed of patients with a
tumor size <5 cm and/or SUVmax <2.0. Group 2 (G2) is formed
of patients with a tumor size ≥5 cm and SUVmax ≥2.0.
Distant metastasis and local recurrence were newly
identified using integrated FDG-PET/CT in a total of 12 patients
between the initial visit and the last follow-up. These patients
consisted of nine males and three females, ranging in age from 22
to 83 years (56.6±18.1 years). The values of SUVmax were measured
in primary and metastatic/recurrent lesions in the same patients.
The metastases or local recurrence following identification using
integrated FDG-PET/CT was determined through histological diagnosis
on surgically resected materials, radiological magnetic resonance
imaging (MRI) or CT. In addition, the clinical information of the
patients was retrospectively reviewed in the present study. All
follow-up patient data were available.
The study protocol was approved by the institutional
ethics review board of Osaka City University Graduate School of
Medicine.
FDG-PET/CT scanning
All patients had previously undergone routine
evaluation by plain radiography and CT and/or MRI at Osaka City
University Hospital (Osaka, Japan) or at the referring institution.
Patients fasted for ≥4 h prior to the FDG-PET study to standardize
the imaging conditions. To avoid data contamination, patients with
blood glucose levels >150 mg/dl were excluded from the study. CT
and PET images were routinely acquired from the orbit to the
proximal thigh 60 min after intravenous injection of 2.7 MBq/kg of
FDG. If necessary, additional images were captured of the toes. PET
was performed using a whole body PET/CT scanner (Discovery ST; GE
Healthcare, Tokyo, Japan). For the CT scan portion of the study,
the settings were as follows: 140 kVp; 50 mA (Auto mA); pitch,
1.75; slice thickness, 3.27 mm; beam collimation, 20 mm; field of
view (FOV), 500 mm; and matrix size, 512×512, with breathing at
rest. For the PET portion of the study, a 3-dimensional acquisition
was performed; slice thickness, 3.27 mm; reconstruction interval,
3.27 mm; FOV, 500 mm; and matrix size, 128×128, using the Ordered
Subsets Expectation Maximization Reconstruction method, with 17-mm
overlap and a Gaussian filter (9).
The FDG-PET/CT images were analyzed by a radiologist
who was unaware of the histology and all of the FDG-PET/CT studies
were analyzed quantitatively. The SUVmax was measured within the
axial image slice with the highest concentration of FDG activity.
The SUV was defined as follows: SUV = radioactivity concentration
in tissue (Bq/g) / [injected dose (Bq)/patient’s body weight (g)].
The regions of interest were determined using the pixel with the
highest FDG accumulation (SUVmax).
Histological examination
Biopsies or surgically resected specimens were fixed
in 10% formalin and routinely processed for paraffin embedding. The
sections were cut to a 4-μm thickness and stained with hematoxylin
and eosin and the final diagnoses of the lesions were
histologically determined. All biopsies and resected specimens were
assessed by pathologists with specific training and expertise in
bone and soft tissue tumors; the investigators were blinded to the
findings of the FDG-PET/CT studies. The diagnoses followed the
World Health Organization classification system (10).
Statistical analysis
Quantitative data are presented as the mean ±
standard deviation, median and range. The Mann-Whitney U test and
Kruskal-Wallis one-way analysis of variance were used for unpaired
comparisons between the quantitative parameters. Patient survival
was estimated using the Kaplan-Meier survival method between the
patients diagnosed with malignant and non-malignant tumors. The
relevant time scale was analyzed from the time of the FDG-PET/CT
study to the last follow-up and log-rank tests were used to
evaluate the differences. Statistical analysis was performed using
Excel statistics software (version 2012; SSRI Co., Ltd.) for
Windows. P<0.05 was considered to indicate a statistically
significant difference.
Results
Details of each histological tumor type
and SUVmax
A total of 113 patients with soft tissue tumors were
included in the present study. The SUVmax for each histological
subtype is summarized in Table I.
The majority of malignant tumors demonstrated a high SUVmax, while
well-differentiated liposarcoma, low-grade myofibroblastic sarcoma,
myxoinflammatory fibroblastic sarcoma, malignant mixed tumor and
extraskeletal chondrosarcoma demonstrated a low SUVmax of <2.0.
In benign tumors, schwannoma, neurofibroma, desmoid, hematoma and
sarcoidosis demonstrated a relatively high SUVmax of ≥2.0.
 | Table IDetails of each histological tumor
type and SUVmax. |
Table I
Details of each histological tumor
type and SUVmax.
| Type (no. of
cases) | SUVmax |
|---|
| Malignant |
| Myxoid liposarcoma
(22) | 2.9±2.1 |
| Pleomorphic
liposarcoma (21) | 6.5±3.2 |
| Leiomyosarcoma
(7) | 6.5±8.6 |
| Well-differentiated
liposarcoma (6) | 1.0±0.9 |
| Malignant peripheral
nerve sheath tumor (5) | 7.9±2.0 |
| Synovial sarcoma
(4) | 3.6±1.5 |
| Epithelioid sarcoma
(4) | 6.9±0.7 |
| Dedifferentiated
liposarcoma (3) | 3.5±1.4 |
| Gastrointestinal
mesenchymal tumor (3) | 4.8±3.4 |
| Pleomorphic
malignant fibrous histiocytoma (3) | 7.8±3.8 |
| Low grade
myofibroblastic sarcoma (2) | 1.5±0.7 |
| Myxofibrosarcoma
(2) | 2.5±2.5 |
| Solitary fibrous
tumor (2) | 2.2±0.7 |
| Alveolar soft part
sarcoma (1) | 9.0 |
| Clear cell sarcoma
(1) | 3.9 |
| Malignant
hemangiopericytoma (1) | 13.7 |
| Myxoinflammatory
fibroblastic sarcoma (1) | 0.9 |
| Malignant mixed
tumor (1) | 1.3 |
| Extraskeletal
osteosarcoma (1) | 16.3 |
| Mesothelioma
(1) | 2.0 |
| Extraskeletal
chondrosarcoma (1) | 1.9 |
| Extraskeletal myxoid
chondrosarcoma (1) | 5.6 |
| Extraskeletal
mesenchymal chondrosarcoma (1) | 6.2 |
| Benign |
| Schwannoma (5) | 4.1±2.4 |
| Lipoma (3) | 0.7±0.4 |
| Neurofibroma
(2) | 2.4±1.1 |
| Desmoid (2) | 3.8±0.5 |
| Nodular fasciitis
(2) | 1.8±2.5 |
| Hemangioma (1) | 1.3 |
| Hematoma (1) | 3.0 |
| Ganglion (1) | 1.0 |
| Sarcoidosis (1) | 5.5 |
| Giant cell tumor of
tendon sheath (1) | 2.2 |
Clinical information of soft tissue
tumors and SUVmax
The final diagnosis revealed 19 benign lesions and
94 malignant bone tumors. There was a statistically significant
difference identified in the SUVmax between the intensity of the
benign (2.9±2.2) and the malignant (4.8±3.9) soft tissue tumors
(P=0.01); however, no statistically significant differences were
observed when comparing primary and metastatic tumors, age (older
or younger than 60 years old), tumor site (extremity or trunk),
tumor size at the greatest diameter (<5, 5–10 or >10 cm) and
depth (superficial or deep).
Tumor size and SUVmax on PET/CT findings
in comparison with histology
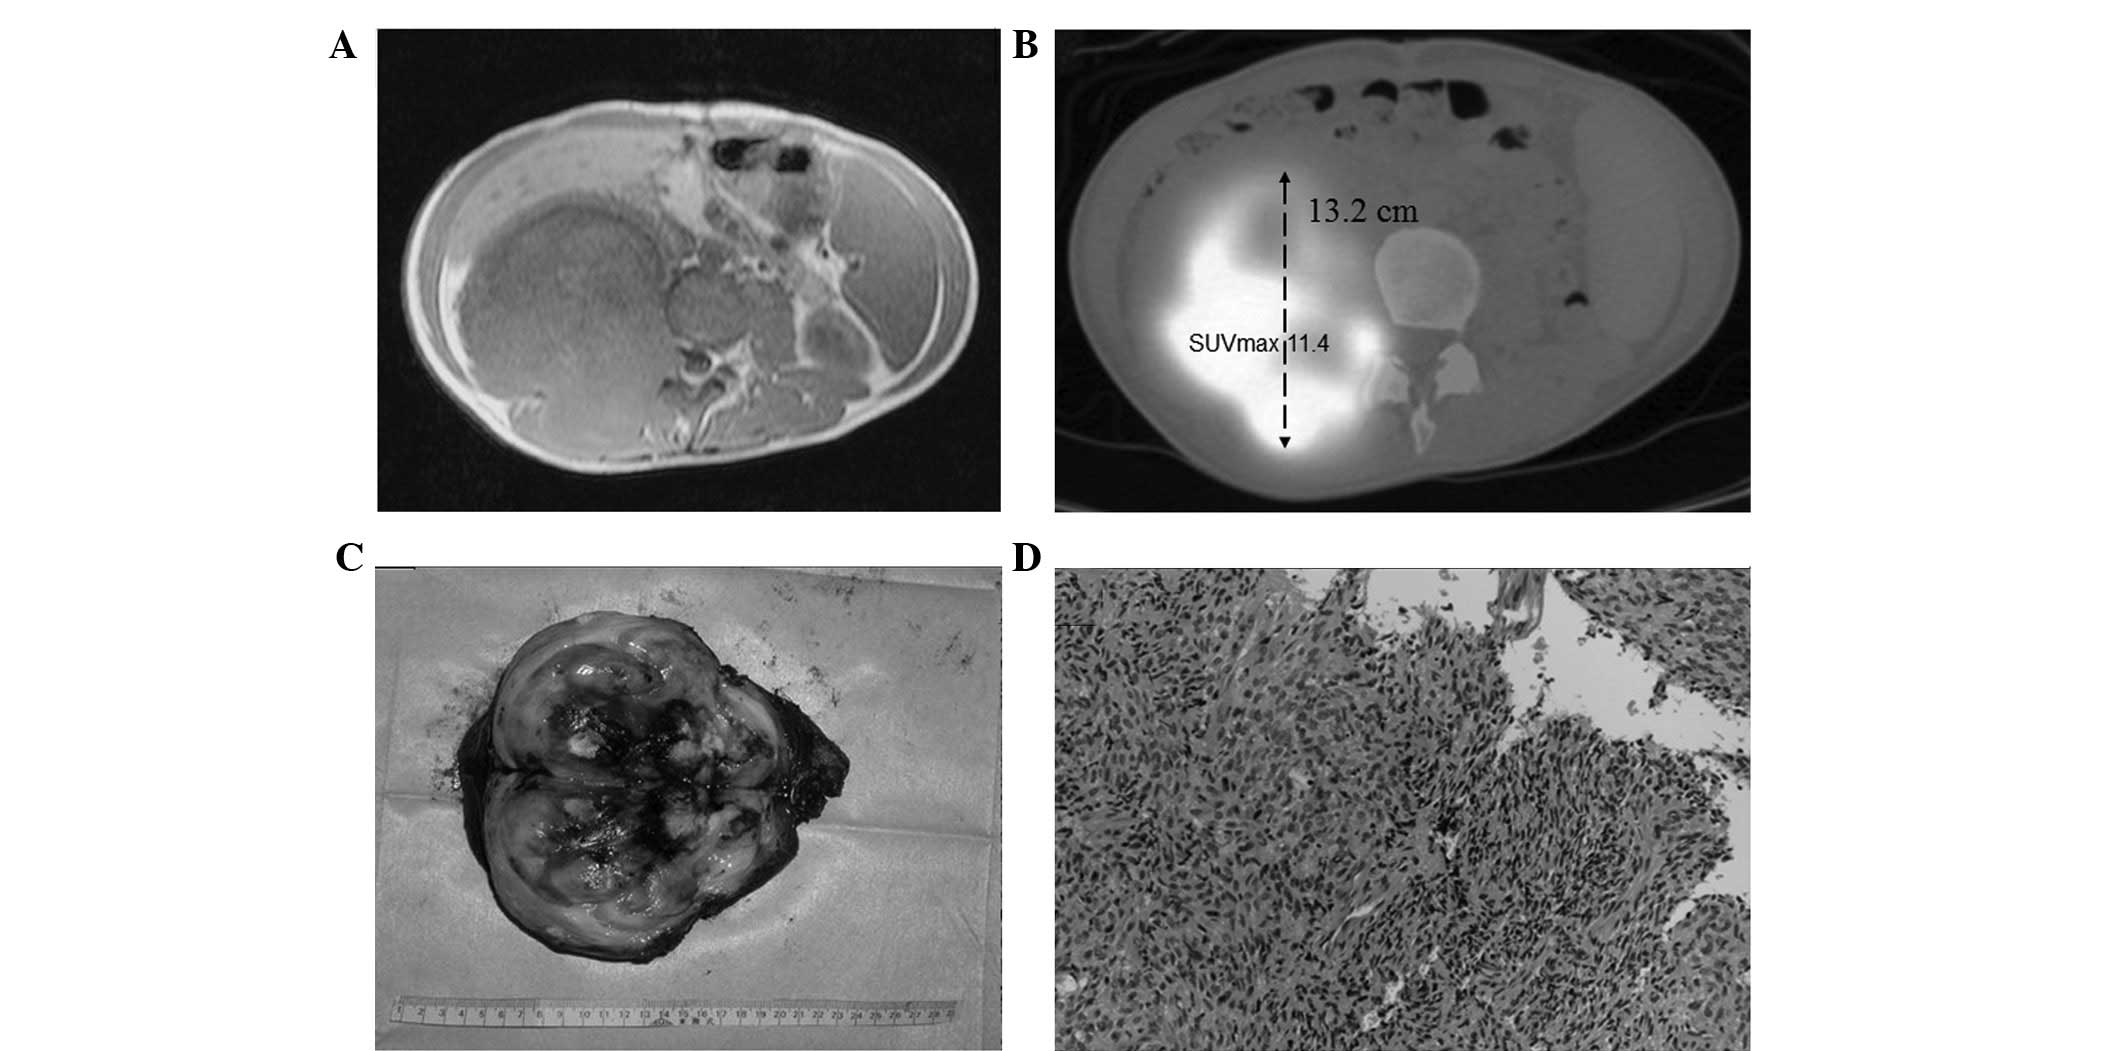
The sensitivity and accuracy were calculated using
the criteria described in the present study for malignancy of
tumors size ≥5 cm and an SUVmax ≥2.0, in comparison with the
histological results (Fig. 1).
Sensitivity and accuracy were calculated to be 55.3 and 54.0%,
respectively (Table II).
| Table IITumor size and SUVmax on findings
from FDG-PET/CT in comparison with the histology results. |
Table II
Tumor size and SUVmax on findings
from FDG-PET/CT in comparison with the histology results.
| Malignant | Benign | Total |
|---|
| Tumor size ≥5 cm
and SUVmax ≥2.0 | 52 | 10 | 62 |
| Tumor size <5 cm
and/or SUVmax <2.0 | 42 | 9 | 51 |
| Total | 94 | 19 | 113 |
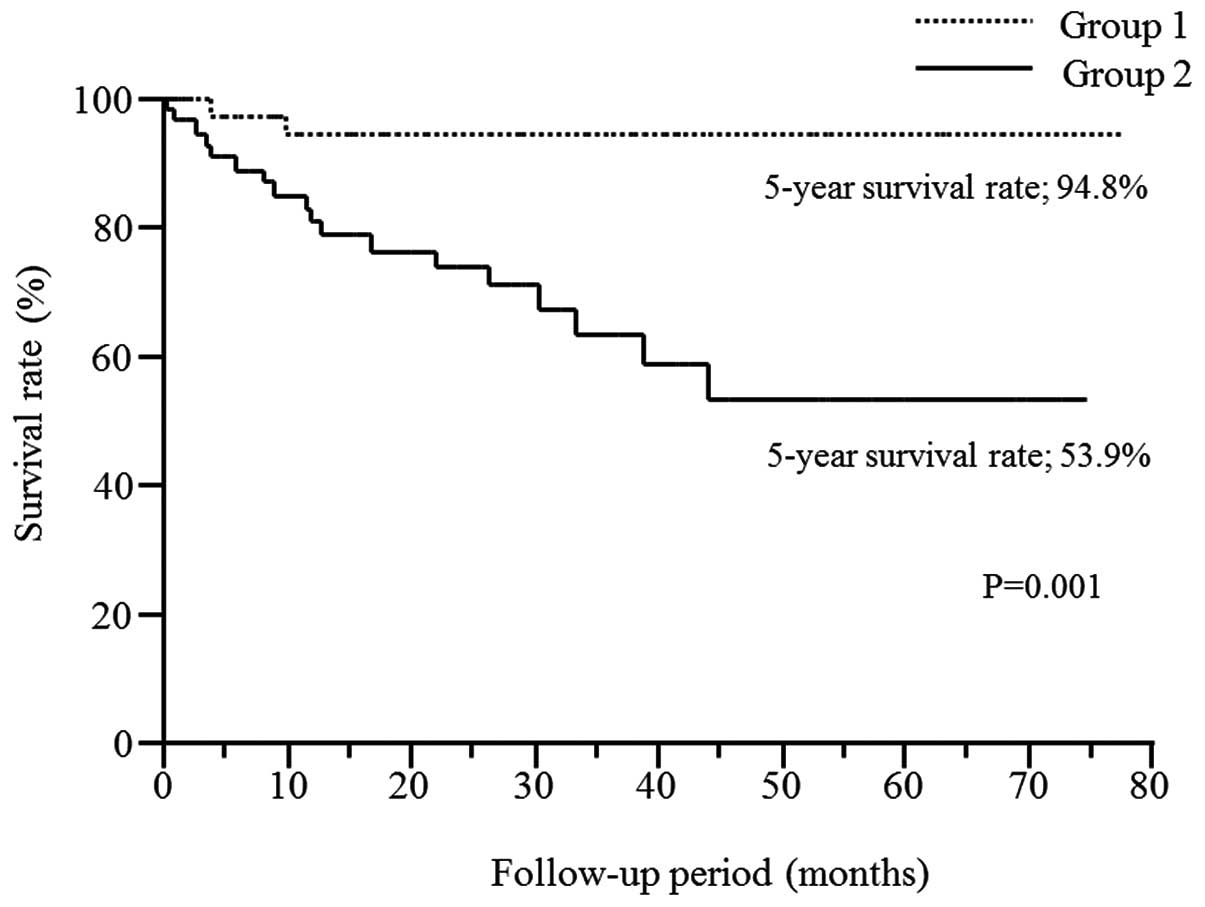
Survival curve of the patients with
tumors sized ≥5 cm and an SUVmax ≥2.0
The Kaplan-Meier analysis demonstrated that the
five-year survival rate was 53.9% in patients with tumors sized ≥5
cm and an SUVmax ≥2.0 (G2), while that of the patient excluded from
group 1 was 94.8% (G1). The difference was statistically
significant (P=0.001; log-rank test) (Fig. 2).
Clinical information of patients with
metastatic/recurrent tumors
A total of 12 patients with soft tissue tumors were
included in the present study. The clinical information, anatomical
site, histopathology, tumor size and SUVmax of primary and
metastatic/recurrent lesions is summarized in Table III. With regard to prognosis,
eight patients died of disease (DOD), three were alive with disease
(AWD) and one had no evidence of disease (NED).
| Table IIIClinical information of patients with
metastatic/recurrent tumors. |
Table III
Clinical information of patients with
metastatic/recurrent tumors.
| | Primary tumor | |
Metastasis/recurrence | |
|---|
| |
| |
| |
|---|
| Case | Age (years) | Gender | Primary site | Histopathology | Size (cm) | SUVmax | Site | Type | Size (cm) | SUVmax | Prognosis |
|---|
| 1 | 22 | F | Lower leg | Alveolar soft part
sarcoma | 5.9 | 8.9 | Lumbar
vertebrae | Metastasis | 2.8 | 8.9 | DOD |
| 2 | 27 | M | Forearm | Epithelioid
sarcoma | 3.2 | 7.2 | Lung | Metastasis | 1.6 | 2.2 | AWD |
| 3 | 52 | M | Thigh | Pleomorphic
liposarcoma | 8.5 | 9.2 | Humerus | Metastasis | 3.1 | 2.2 | DOD |
| 4 | 59 | M | Forearm | MIFS | 5.2 | 0.9 | Buttock | Metastasis | 3.7 | 6.6 | DOD |
| 5 | 75 | M | Thigh | Myxoid
liposarcoma | 3.4 | 2.5 | Thigh | Recurrence | 4.8 | 2.7 | AWD |
| 6 | 71 | F | Forearm | Leiomyosarcoma | 6.5 | 2.5 | Forearm | Recurrence | 1.4 | 4.8 | NED |
| 7 | 73 | M | Thigh | Pleomorphic
liposarcoma | 11.9 | 5.5 | Pubic bone | Recurrence | 9.2 | 7.7 | DOD |
| 8 | 46 | M | Chest wall | Clear cell
sarcoma | 4.8 | 3.4 | Lung | Metastasis | 4 | 3.9 | AWD |
| 9 | 79 | F | Thigh | Pleomorphic
liposarcoma | 6.2 | 7.1 | Ileocecal | Metastasis | 2 | 9.7 | DOD |
| 10 | 56 | M | Shoulder | Pleomorphic
malignant fibrous hystiocytoma | 10.1 | 6.7 | lung | Metastasis | 2 | 2.7 | DOD |
| 11 | 46 | M | Groin | Epithelioid
sarcoma | 5.4 | 6.3 | Groin | Metastasis | 3.8 | 9.4 | DOD |
| 12 | 83 | M | Chest wall | Pleomorphic
liposarcoma | 12.4 | 10.3 | Liver | Metastasis | 5.7 | 11.8 | DOD |
Comparison of SUVmax and tumor size on
FDG-PET/CT between primary and metastatic/recurrent lesions
The mean SUVmax of primary and metastatic/recurrent
tumors were 5.9±3.0 and 6.1±3.4, respectively. No statistical
significances were identified between them. The mean values of the
greatest diameter of primary tumors and metastasis/recurrence were
7.0±3.1 cm and 3.7±2.2 cm, respectively. The primary tumor was
significantly larger than the metastatic/recurrence tumors
(P=0.00029).
Discussion
Kern et al (11) first applied FDG-PET to soft tissue
tumors, including malignant fibrous histiocytoma; it has since been
shown to be one of the most powerful diagnostic tools in oncology,
enabling the functional assessment of soft tissue tumors.
Currently, FDG-PET can identify the metabolic rate of glycolysis in
tumors and is increasingly applied to grading (12,13),
staging (14), chemotherapeutic
response assessment (15,16) and surgical planning (3) of soft tissue tumors. Preliminary
reports emphasized the ability of FDG-PET to distinguish benign
from malignant tumors (1–3,17).
However, numerous studies (18,19)
have raised the question that if FDG-PET cannot differentiate
malignant from benign soft tissue tumors in the presence of false
positive findings from aggressive benign tumors and inflammatory
lesions, then is it an insufficient technique to judge between
benign and malignant bone tumors? However, recently FDG-PET/CT
analysis has been re-examined and its efficiency was investigated
(20). Bischoff et al
(21) reported that the usefulness
of FDG-PET/CT in soft tissue and osseous tumors had a sensitivity
of 69–80%, a specificity of 83–100% and an accuracy of 79–86%;
although their criteria for interpreting malignant tumors were
obscure and required the judgment of radiologists from numerous
sources of information for conventional imaging. Charest et
al (20) demonstrated a high
sensitivity for the accurate discrimination between low- and
high-grade sarcomas, however, not between benign and malignant soft
tissue tumors. We doubt whether FDG-PET/CT is able to accurately
differentiate malignant from benign tumors. In the present study,
distinct criteria were designed to interpret malignant tumors and
the efficacy of establishing a differential diagnosis using these
criteria was evaluated.
Previous studies were referred to in order to define
the criteria between malignant and benign tumors. In FDG-PET
analysis, Feldman et al (2)
proposed an SUVmax of 2.0 with a high sensitivity of 97.7% and a
high specificity of 100%, while Watanabe et al (3) calculated the SUVmean of 1.9 with a
high sensitivity of 100% and a high specificity of 76.9%. In the
present study, an SUVmax of 2.0 was defined as the threshold value
in FDG-PET for glucose metabolism in tumors. Furthermore,
FDG-PET/CT is able to perform morphological measurements of tumor
size at the same time, in addition to the functional assessment. A
size of ≥5 cm has been used as an indicator of possibly malignant
soft tissue tumor (5). Thus,
combining the findings of SUVmax ≥2.0 and tumor size ≥5 cm was
expected be a highly sensitive detector of malignant tumor in
FDG-PET/CT. The results of the present study indicated that the
sensitivity and accuracy, that were based on the proposed criteria,
were 55.3 and 54.0%, respectively, for the differential diagnosis
between malignant and benign tumors. Contrary to expectations,
these data indicate that the criteria set out in the present study
were insufficient to enable a differential diagnosis using
integrated FDG-PET/CT. Aoki et al (19) previously denied the usefulness of a
threshold value in distinguishing malignant and benign soft tumors,
owing to a false positive overlap by histiocytic, fibroblastic and
neurogenic tumors. Inflammatory processes also enhanced FDG uptake
(22), although the mechanism
remains to be completely understood.
Previously, concerning specific histological
subtype, such as osteosarcoma (23), Ewing sarcoma (24) and rhabdomyosarcoma (25), FDG-PET was assessed as a useful
modality for prognosis. Metabolic reduction after chemotherapy on
FDG-PET may be a useful response marker in high-grade sarcomas
(26). According to the
Kaplan-Meier analysis in the present study, patients with a tumor
size ≥5 cm and an SUVmax ≥2.0 were associated with worse survival,
compared with those without these characteristics. The tumors sized
≥5 cm with an SUVmax ≥2.0 may be malignant soft tissue sarcomas. In
the present study, false positive tumors that were identified in
the benign tumors were schwannoma (n=5), neurofibroma (n=2),
desmoid (n=2), hematoma (n=1), sarcoidosis (n=1) and giant cell
tumor of the tendon sheath (n=1). The sizes of these benign tumors
were generally small (<5 cm) and they were divided into G1.
Whereas, the false negative tumors in the malignant tumors were
well-differentiated liposarcoma (n=6), low grade myxofibroblastic
sarcoma (n=2), myxoinflammatory fibroblastic sarcoma (n=1),
malignant mixed tumor (n=1) and extraskeletal chondrosarcoma (n=1).
The majority of these negative false tumors were interpreted as
potentially low-grade sarcoma, even when the size was >5 cm.
These tumors may also be classified as G1. Therefore, the criteria
of tumors sized ≥5 cm with an SUVmax ≥2.0 on integrated FDG-PET/CT
is likely to be an indicator of a worse prognosis in soft tissue
tumors.
Tateishi et al (6) and Arush et al (7) described that FDG-PET/CT was useful in
identifying metastasis of musculoskeletal tumors as a screening of
sarcoma and was superior to conventional images. Yanagawa et
al (8) demonstrated that
metastatic bone tumors exhibited a higher SUVmax compared with that
of primary tumors. It appears likely that metastatic tumors acquire
a more aggressive nature than primary tumors. Additionally, a
previous study reported that a higher pathological grade of tumor
resulted in a higher SUVmax in FDG-PET/CT (12). In the present study, the SUVmax on
FDG-PET/CT for metastatic/recurrent tumor was not higher than that
of primary lesions, which was contrary to the prediction that
metastatic tumors may have a higher SUV than primary tumors.
Although no significant difference in the value of
SUVmax between primary and metastatic/recurrent tumors was
detected, these results may be dependent on the tumor size. The
size of the primary tumor, estimated as the greatest diameter, was
demonstrated to be significantly larger than that of
metastatic/recurrent tumor. The periodical follow-ups with
FDG-PET/CT contributed to finding the small-size
metastatic/recurrent tumors in the present study. In a previous
study, there was a correlation between the size of the tumor and
sensitivity of the FDG-PET (27).
Gould et al (28) also
published a meta-analysis of 1,474 pulmonary nodules that were
evaluated by FDG-PET and concluded that FDG-PET had an overall high
specificity (96.8%) but variable sensitivities (77.8%) for nodules
<1 cm. Fortes et al (27)
supported that the small size of lung metastasis from sarcoma was
markedly less sensitive than other carcinoma in FDG-PET. The
glucose metabolism of sarcoma in FDG-PET/CT should be affected by
the size of the tumors (29).
There are several limitations of the present study,
including its retrospective nature, the limited number of patients
enrolled and the potential selection bias of the patients. The
proportion of malignant tumors that were studied was greater than
the proportion of benign tumors. The study included numerous types
of soft tissue tumors and their histologies were not matched,
although soft tissue tumors arise from various points of origin. It
would be difficult to isolate cases to an individual origin, due to
its rarity. Schwab and Healey (30)
demonstrated that FDG-PET may lack the sensitivity for myxoid
liposarcoma metastasis, due to the inability to detect glucose
utilizing cells within the myxoid matrix. Similarly, certain
sarcoma may show a peculiar FDG uptake pattern. Further study was
necessary to establish each specific histological subtype for
accurate examination in the present study. The size of the tumor is
also an important diagnostic problem that is related to the
capability of FDG-PET/CT in detecting tumors (31). The smallest diameter of the
metastatic tumor in the present study was 1.1 cm; a previous study
identified that a lesion of size 5 mm could not be evaluated
adequately by FDG-PET (32). A
prospective study is required to overcome these limitations and
confirm the results of the present study.
In conclusion, the diagnostic criteria of tumor size
≥5 cm and SUVmax ≥2.0 on integrated FDG-PET/CT was insufficient for
distinguishing malignant from benign soft tissue tumors, owing to
false positive benign tumors and false negative malignant tumors.
However, the Kaplan-Meier analysis demonstrated that patients
meeting these criteria were associated with a worse prognosis. The
SUVmax on FDG-PET/CT was compared between primary and
metastatic/recurrent tumors and no significant difference
identified between their values. Although the idea of whole body
cancer surveillance using FDG-PET/CT is fascinating as a screening
tool for the recurrence of sarcoma, orthopedic oncologists and
radiologists must be aware that FDG-PET/CT assessments are limited
by the tumor size.
Acknowledgements
The authors would like to thank Dr Yoshihiko
Nishikubo for the examination and interpretation of the FDG-PET/CT
data.
References
|
1
|
Adler LP, Blair HF, Makley JT, Williams
RP, Joyce MJ, Leisure G, al-Kaisi N and Miraldi F: Noninvasive
grading of musculoskeletal tumors using PET. J Nucl Med.
32:1508–1512. 1991.PubMed/NCBI
|
|
2
|
Feldman F, van Heertum R and Manos C:
18FDG PET scanning of benign and malignant musculoskeletal lesions.
Skeletal Radiol. 32:201–208. 2003. View Article : Google Scholar : PubMed/NCBI
|
|
3
|
Watanabe H, Shinozaki T, Yanagawa T, Aoki
J, Tokunaga M, Inoue T, Endo K, Mohara S, Sano K and Takagishi K:
Glucose metabolic analysis of musculoskeletal tumours using
18fluorine-FDG PET as an aid to preoperative planning. J Bone Joint
Surg Br. 82:760–767. 2000. View Article : Google Scholar : PubMed/NCBI
|
|
4
|
Pappo AS, Fontanesi J, Luo X, Rao BN,
Parham DM, Hurwitz C, Avery L and Pratt CB: Synovial sarcoma in
children and adolescents: the St Jude Children’s Research Hospital
experience. J Clin Oncol. 12:2360–2366. 1994.
|
|
5
|
Ueda T, Yoshikawa H, Mori S, Araki N,
Myoui A, Kuratsu S and Uchida A: Influence of local recurrence on
the prognosis of soft-tissue sarcomas. J Bone Joint Surg Br.
79:553–557. 1997. View Article : Google Scholar : PubMed/NCBI
|
|
6
|
Tateishi U, Hosono A, Makimoto A, Sakurada
A, Terauchi T, Arai Y, Imai Y and Kim EE: Accuracy of 18F
fluorodeoxyglucose positron emission tomography/computed tomography
in staging of pediatric sarcomas. J Pediatr Hematol Oncol.
29:608–612. 2007. View Article : Google Scholar
|
|
7
|
Arush MW, Israel O, Postovsky S, Militianu
D, Meller I, Zaidman I, Sapir AE and Bar-Shalom R: Positron
emission tomography/computed tomography with 18fluoro-deoxyglucose
in the detection of local recurrence and distant metastases of
pediatric sarcoma. Pediatr Blood Cancer. 49:901–905. 2007.
View Article : Google Scholar
|
|
8
|
Yanagawa T, Shinozaki T, Iizuka Y,
Takagishi K and Watanabe H: Role of 2-deoxy-2-[F-18]
fluoro-D-glucose positron emission tomography in the management of
bone and soft-tissue metastases. J Bone Joint Surg Br. 92:419–423.
2010.
|
|
9
|
Hudson HM and Larkin RS: Accelerated image
reconstruction using ordered subsets of projection data. IEEE Trans
Med Imaging. 13:601–609. 1994. View Article : Google Scholar : PubMed/NCBI
|
|
10
|
Flecher CDM, Unni KK and Mertens F:
Pathology and genetics; tumors of soft tissue and bone. 4. World
Health Organisation; Lyon: 2002
|
|
11
|
Kern KA, Brunetti A, Norton JA, Chang AE,
Malawer M, Lack E, Finn RD, Rosenberg SA and Larson SM: Metabolic
imaging of human extremity musculoskeletal tumors by PET. J Nucl
Med. 29:181–186. 1988.PubMed/NCBI
|
|
12
|
Benz MR, Dry SM, Eilber FC, Allen-Auerbach
MS, Tap WD, Elashoff D, Phelps ME and Czernin J: Correlation
between glycolytic phenotype and tumor grade in soft-tissue
sarcomas by 18F-FDG PET. J Nucl Med. 51:1174–1181. 2010. View Article : Google Scholar
|
|
13
|
Folpe AL, Lyles RH, Sprouse JT, Conrad EU
III and Eary JF: (F-18) fluorodeoxyglucose positron emission
tomography as a predictor of pathologic grade and other prognostic
variables in bone and soft tissue sarcoma. Clin Cancer Res.
6:1279–1287. 2000.
|
|
14
|
Völker T, Denecke T, Steffen I, Misch D,
Schönberger S, Plotkin M, Ruf J, Furth C, Stöver B, Hautzel H,
Henze G and Amthauer H: Positron emission tomography for staging of
pediatric sarcoma patients: results of a prospective multicenter
trial. J Clin Oncol. 25:5435–5441. 2007.PubMed/NCBI
|
|
15
|
Eftekhari F: Imaging assessment of
osteosarcoma in childhood and adolescence: diagnosis, staging, and
evaluating response to chemotherapy. Cancer Treat Res. 152:33–62.
2009. View Article : Google Scholar : PubMed/NCBI
|
|
16
|
Cheon GJ, Kim MS, Lee JA, Lee SY, Cho WH,
Song WS, Koh JS, Yoo JY, Oh DH, Shin DS and Jeon DG: Prediction
model of chemotherapy response in osteosarcoma by 18F-FDG PET and
MRI. J Nucl Med. 50:1435–1440. 2009. View Article : Google Scholar : PubMed/NCBI
|
|
17
|
Griffeth LK, Dehdashti F, McGuire AH,
McGuire DJ, Perry DJ, Moerlein SM and Siegel BA: PET evaluation of
soft-tissue masses with fluorine-18 fluoro-2-deoxy-D-glucose.
Radiology. 182:185–194. 1992. View Article : Google Scholar : PubMed/NCBI
|
|
18
|
Hamada K, Tomita Y, Qiu Y, Zhang B, Ueda
T, Myoui A, Higuchi I, Yoshikawa H, Aozasa K and Hatazawa J:
18F-FDG-PET of musculoskeletal tumors: a correlation with the
expression of glucose transporter 1 and hexokinase II. Ann Nucl
Med. 22:699–705. 2008. View Article : Google Scholar : PubMed/NCBI
|
|
19
|
Aoki J, Watanabe H, Shinozaki T, Takagishi
K, Tokunaga M, Koyama Y, Sato N and Endo K: FDG-PET for
preoperative differential diagnosis between benign and malignant
soft tissue masses. Skeletal Radiol. 32:133–138. 2003. View Article : Google Scholar
|
|
20
|
Charest M, Hickeson M, Lisbona R,
Novales-Diaz JA, Derbekyan V and Turcotte RE: FDG PET/CT imaging in
primary osseous and soft tissue sarcomas: a retrospective review of
212 cases. Eur J Nucl Med Mol Imaging. 36:1944–1951. 2009.
View Article : Google Scholar : PubMed/NCBI
|
|
21
|
Bischoff M, Bischoff G, Buck A, von Baer
A, Pauls S, Scheffold F, Schultheiss M, Gebhard F and Reske SN:
Integrated FDG-PET-CT: its role in the assessment of bone and soft
tissue tumors. Arch Orthop Trauma Surg. 130:819–827. 2010.
View Article : Google Scholar
|
|
22
|
Bakheet SM, Saleem M, Powe J, Al-Amro A,
Larsson SG and Mahassin Z: F-18 fluorodeoxyglucose chest uptake in
lung inflammation and infection. Clin Nucl Med. 25:273–278. 2000.
View Article : Google Scholar : PubMed/NCBI
|
|
23
|
Bajpai J, Kumar R, Sreenivas V, Sharma MC,
Khan SA, Rastogi S, Malhotra A, Gamnagatti S, Kumar R, Safaya R and
Bakhshi S: Prediction of chemotherapy response by PET-CT in
osteosarcoma: correlation with histologic necrosis. J Pediatr
Hematol Oncol. 33:e271–e278. 2011.PubMed/NCBI
|
|
24
|
Gupta K, Pawaskar A, Basu S, Rajan MG,
Asopa RV, Arora B, Nair N and Banavali S: Potential role of FDG PET
imaging in predicting metastatic potential and assessment of
therapeutic response to neoadjuvant chemotherapy in Ewing sarcoma
family of tumors. Clin Nucl Med. 36:973–977. 2011. View Article : Google Scholar
|
|
25
|
Baum SH, Frühwald M, Rahbar K, Wessling J,
Schober O and Weckesser M: Contribution of PET/CT to prediction of
outcome in children and young adults with rhabdomyosarcoma. J Nucl
Med. 52:1535–1540. 2011. View Article : Google Scholar : PubMed/NCBI
|
|
26
|
Tateishi U, Kawai A, Chuman H, Nakatani F,
Beppu Y, Seki K, Miyake M, Terauchi T, Moriyama N and Kim EE:
PET/CT allows stratification of responders to neoadjuvant
chemotherapy for high-grade sarcoma: a prospective study. Clin Nucl
Med. 36:526–532. 2011. View Article : Google Scholar
|
|
27
|
Fortes DL, Allen MS, Lowe VJ, Shen KR,
Wigle DA, Cassivi SD, Nichols FC and Deschamps C: The sensitivity
of 18F-fluorodeoxyglucose positron emission tomography in the
evaluation of metastatic pulmonary nodules. Eur J Cardiothorac
Surg. 34:1223–1227. 2008. View Article : Google Scholar
|
|
28
|
Gould MK, Maclean CC, Kuschner WG, Rydzak
CE and Owens DK: Accuracy of positron emission tomography for
diagnosis of pulmonary nodules and mass lesions: a meta-analysis.
JAMA. 285:914–924. 2001. View Article : Google Scholar : PubMed/NCBI
|
|
29
|
Bamba Y, Itabashi M and Kameoka S: Value
of PET/CT imaging for diagnosing pulmonary metastasis of colorectal
cancer. Hepatogastroenterology. 58:1972–1974. 2011. View Article : Google Scholar : PubMed/NCBI
|
|
30
|
Schwab JH and Healey JH: FDG-PET lacks
sufficient sensitivity to detect myxoid liposarcoma spinal
metastases detected by MRI. Sarcoma. 2007:367852007. View Article : Google Scholar : PubMed/NCBI
|
|
31
|
Iagaru A, Chawla S, Menendez L and Conti
PS: 18F-FDG PET and PET/CT for detection of pulmonary metastases
from musculoskeletal sarcomas. Nucl Med Commun. 27:795–802. 2006.
View Article : Google Scholar : PubMed/NCBI
|
|
32
|
Kleis M, Daldrup-Link H, Matthay K,
Goldsby R, Lu Y, Schuster T, Schreck C, Chu PW, Hawkins RA and
Franc BL: Diagnostic value of PET/CT for the staging and restaging
of pediatric tumors. Eur J Nucl Med Mol Imaging. 36:23–36. 2009.
View Article : Google Scholar
|