Introduction
In the USA, gallbladder cancers (GBCs) are the most
common biliary tract malignancy and the fifth most common
gastrointestinal cancer (1,2). The prognosis of GBC is extremely poor,
with a high mortality rate, and early diagnosis is generally
impossible due to a lack of specific signs or symptoms (3). The majority of GBC patients (>90%)
are diagnosed at an inoperable stage, with serious invasion and
metastasis to other organs (4). The
majority of GBCs are adenocarcinomas (ACs; >90%) (5). By contrast, it is rare for other
histopathological subtypes, including mucinous, papillary and
squamous subtypes, to be identified (2). Between 1 and 12% of gallbladder
cancers are squamous cell/adenosquamous carcinomas (SC/ASCs)
(2,6), and the clinicopathological
characteristics of SC/ASCs are not well documented, as the majority
of available studies are individual case studies or analyses of
small case series. The establishment of therapeutic interventions
for SC/ASC is required (2).
Currently, biomarkers for predicting the prognosis of AC are under
investigation, however, none have achieved clinical application as
of yet (4). Notably, biomarkers
associated with the progression and prognosis of SC/ASC have not
been reported, and therefore, documenting the clinicopathological
and biological characteristics is essential.
Paternally expressed gene (PEG) 10 was first
identified by Ono et al as an imprinted gene that is
paternally expressed and maternally silenced (8). The human PEG10 gene is located on
chromosome band 7q21, functioning as a transcriptional factor.
PEG10 expression can be detected in a variety of human normal
tissues, including the brain, kidney, lung, placenta, testis,
ovary, spleen, lymphoblasts, endothelial cells and thymus (9,10),
however, its exact roles remain unknown. The overexpression of the
PEG10 gene has also been detected in human cancers, including
leukemia, breast cancer, hepatocellular carcinoma (HCC), prostate
cancer and pancreatic cancer (7,11). The
exact association between PEG10 and tumorigenesis has not yet been
identified. However, the accumulated evidence indicates the
involvement of PEG10 in apoptotic resistance and oncogenesis. For
instance, in studies of B-cell acute lymphoblastic leukemia, PEG10
mRNA expression was strongly associated with high lipoprotein
lipase expression, which is a predictor of unfavorable outcome in
B-cell chronic lymphocytic leukemia (10), whereas overexpressed PEG10 increased
apoptotic resistance in B cell lineage, acute and chronic
lymphocytic leukemia cluster of differentiation
(CD)23+/CD5+ B cells (12). In HCC, PEG10 decreases cell death
through interaction with seven in absentia homolog-1, a mediator of
apoptosis (9). Previous studies
have demonstrated that PEG10 expression can be regulated by the
proto-oncogene, c-MYC, via the binding of the c-MYC oncoprotein to
the E-box-containing region of the first intron of PEG10 (13–15).
PEG10 also interacts with the transforming growth factor (TGF)-β
type I receptor, activin receptor-like kinase (ALK) 1 (16). Additionally, knockdown of PEG10
inhibits the proliferation of pancreatic carcinoma and HepG2 HCC
cells (13), while knockout of the
PEG gene causes early embryonic lethality (17). This evidence indicates that PEG10
may play a crucial role in carcinogenesis and tumor cell growth.
However, PEG10 expression in SC/ASC and AC of the gallbladder has
not yet been identified.
Although tumor susceptibility gene (TSG) 101 was
originally identified as a potential tumor suppressor gene
(18), subsequent studies have
shown that the deletion of TSG101 in cell cultures did not lead to
uncontrolled cell growth, while conditional knockout of TSG101 in
mice did not result in neoplastic transformation. However,
homozygous deletion of TSG101 led to embryonic lethality in gene
knockout mice, whereas cell cycle arrest and cell death resulted
from the silencing of TSG101 expression in mammalian cells
(18). This indicates that TSG101
plays a crucial role in cell survival. In addition, a previous
study has indicated that TSG101 is an essential protein involved in
numerous cellular processes associated with cell growth and signal
transduction, including transcriptional regulation, protein
ubiquitination, cell cycle control and vesicular transport
(20). Liu et al reported
overexpression of TSG101 in human papillary thyroid carcinomas,
which provided one of the earliest pieces of evidence for linking
PSG101 to carcinogenesis (21). The
overexpression of TSG101 was also observed in several human
cancers, including ovarian cancer (19), gastrointestinal tumors (22) and colorectal carcinoma (23). Gene silencing of TSG101 leads to
growth arrest and cell death in breast and prostate cancer cells
(24). In addition, early evidence
indicated the close interaction of TSG101 with p53 within the
p53/mouse double minute (MDM) 2 homolog feedback control loop,
which upon de-regulation, results in tumorigenesis (25). However, no studies have shown the
involvement of TSG101 in gallbladder cancer.
In the present study, the expression of PEG10 and
TSG101 in resection specimens, including 80 AC and 46 SC/ASC
samples, were examined by immunohistochemistry. The correlations of
PEG10 and TSG101 expression with the biological behavior and
prognosis of SC/ASC and AC of the gallbladder were evaluated, along
with the clinical significance and the survival rates of the
patients.
Materials and methods
Case selection
Between January 1995 and December 2009, 46 SC/ASC
samples were collected from patients who had undergone surgical
resection or biopsy. In the gallbladder cancers of the present
study, the percentage of SC/ASC was 4.34% (46/1,060 GBCs). Among
the 46 SCs/ASCs, 14 samples (14/325 GBCs) were collected from
Xiangya Hospital, 16 (16/370 GBCs) from Second Xiangya Hospital, 5
(5/110 GBCs) from Third Xiangya Hospital, 5 (5/105 GBCs) from Hunan
Provincial People’s Hospital, 4 (4/100 GBCs) from Hunan Provincial
Tumor Hospital (all Changsha, Hunan, China) and 1 each from Changde
Central Hospital and Loudi Central Hospital (Loudi, Hunan, China),
respectively (2/50 GBCs). Between January 2001 to December 2009, a
total of 80 AC samples from patients who had undergone surgical
resection or biopsy, were collected from Second Xiangya Hospital
and Loudi Central Hospital. This study was approved by the Ethics
Committee for Human Research, Central South University (Changsha,
China).
In total, there were 27 female and 19 male (F/M,
1.42) SC/ASC patients, and 54 female and 26 male (F/M, 2.08) AC
patients. The age range was 35–82 years (mean ± SD, 55.8±9.6 years)
for the SC/ASC patients and 33–80 years (mean ± SD, 53.8±9.9 years)
for the AC patients. The differentiation classifications of the
squamous cells of the SCs/ASCs samples included 16
well-differentiated (34.8%), 24 moderately-differentiated (52.2%)
and 6 poorly-differentiated (13.0%) carcinomas. For the AC samples,
27 samples were well-differentiated (33.8%), 25 were
moderately-differentiated (31.3%) and 28 were poorly-differentiated
(35.0%). Invasion of the gallbladder, surrounding tissues and
organs was identified in 30 SC/ASC patients (65.2%), while 29 had
regional lymph node metastasis (63.0%) and 28 had gallstones
(60.9%). Invasion was found in 49 AC patients (61.3%), while 50 had
regional lymph node metastasis (62.5%) and 38 had gallstones
(47.5%). According to the tumor-node-metastasis (TNM) staging, 5 of
the SC/ASC samples were stage I tumors, 7 were stage II, 20 were
stage III and 14 were stage IV. For the AC samples, 8 were stage I
tumors, 13 were stage II, 38 were stage III and 21 were stage IV.
In total, for the SCs/ASCs and ACs, 14 and 26 patients underwent
radical resection surgery, 18 and 28 underwent palliative surgery
and 14 and 26 underwent no operation and only had biopsies,
respectively.
The 2-year survival data of the SC/ASC and AC
patients was collected from phone calls and letters. In total, 23
AC patients survived >1 year (9 patients survived >2 years)
and 57 survived <1 year, with an average survival time of
10.34±0.63 months. Among the SCs/ASCs patients, 13 survived >1
year (4 patients survived >2 years) and 33 survived <1 year,
with an average survival time of 10.07±0.78 months.
Immunohistochemistry staining
Sections (4-μm thick) were cut from routinely
paraffin-embedded tissues of AC and SC/ASC. Rabbit anti-PEG10 and
mouse anti-TSG101 antibodies were purchased from Santa Cruz
Biotechnology, Inc. (Santa Cruz, CA, USA). The staining was
performed with the peroxidase-based EnVision™ Detection kit (Dako
Laboratories, Carpinteria, CA, USA), following the manufacturer’s
instructions. In brief, 4-μM sections were cut from routinely
paraffin-embedded tissues of the AC and SC/ASC samples. The
sections were soaked with phosphate-buffered saline (PBS) for 3×5
min prior to the sections being deparaffinized and incubated with
3% H2O2 for 15 min. The sections were then
incubated with mouse anti-TSG101 (1:100 dilution) or rabbit
anti-PEG10 (1:100 dilution) antibody for 1 h at room temperature.
Solution A (containing horseradish peroxidase-conjugated secondary
antibody) was added subsequent to the rinsing of the sections with
PBS (3 times), and then the sections were incubated for 30 min. The
substrate, 3,3′-diaminobenzidine, was added prior to hematoxylin
counter-staining. Following dehydration, the slides were soaked in
xylene 3 times, for 5 min each. For the positive control, positive
sections were purchased from Foochow Maixin Biotechnology Company
(Foochow, China), and for the negative control, the primary
antibody was replaced with 5% fetal bovine serum. The percentage of
positive cells was calculated from 500 cells in 10 random fields;
≥25% positive cells were regarded as positive and <25% positive
cells were regarded as negative.
Statistical analysis
The data were analyzed using the statistical package
for the Social Sciences, Version 13.0 (SPSS, 13.0; SPSS, Inc.,
Chicago, IL, USA). The inter-association of TSG101 or PEG10
expression with histological or clinical factors was analyzed using
χ2 or Fisher’s exact tests. Kaplan-Meier and time series
(log-rank) tests were used for the univariate survival analysis.
Cox’s proportional hazards model was used for the multivariate
analysis and to determine the 95% confidence interval. P<0.05
was used to indicate a statistically significant difference.
Results
Comparison of TSG101 and PEG10 expression
and clinicopathological characteristics in SC/ASC and AC
As shown in Table I,
the percentage of cases with a patient age of >45 years, a tumor
mass of >3 cm and well- or moderately-differentiated tumors was
significantly higher in the SCs/ASCs compared with the ACs
(P<0.05). Correlations between other clinicopathological
characteristics and the percentage of positive TSG101 and PEG10
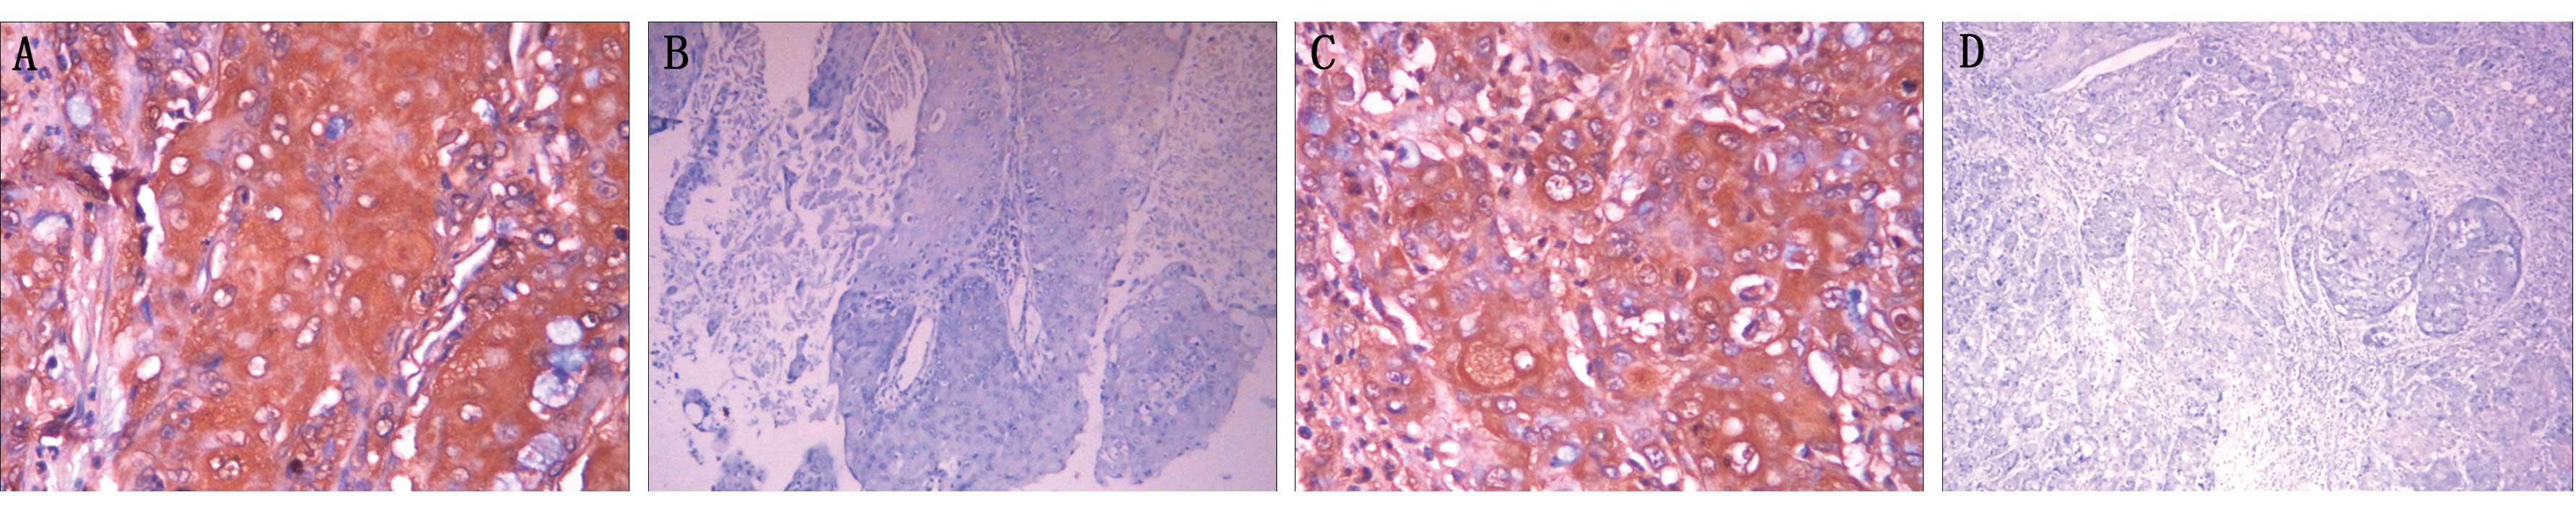
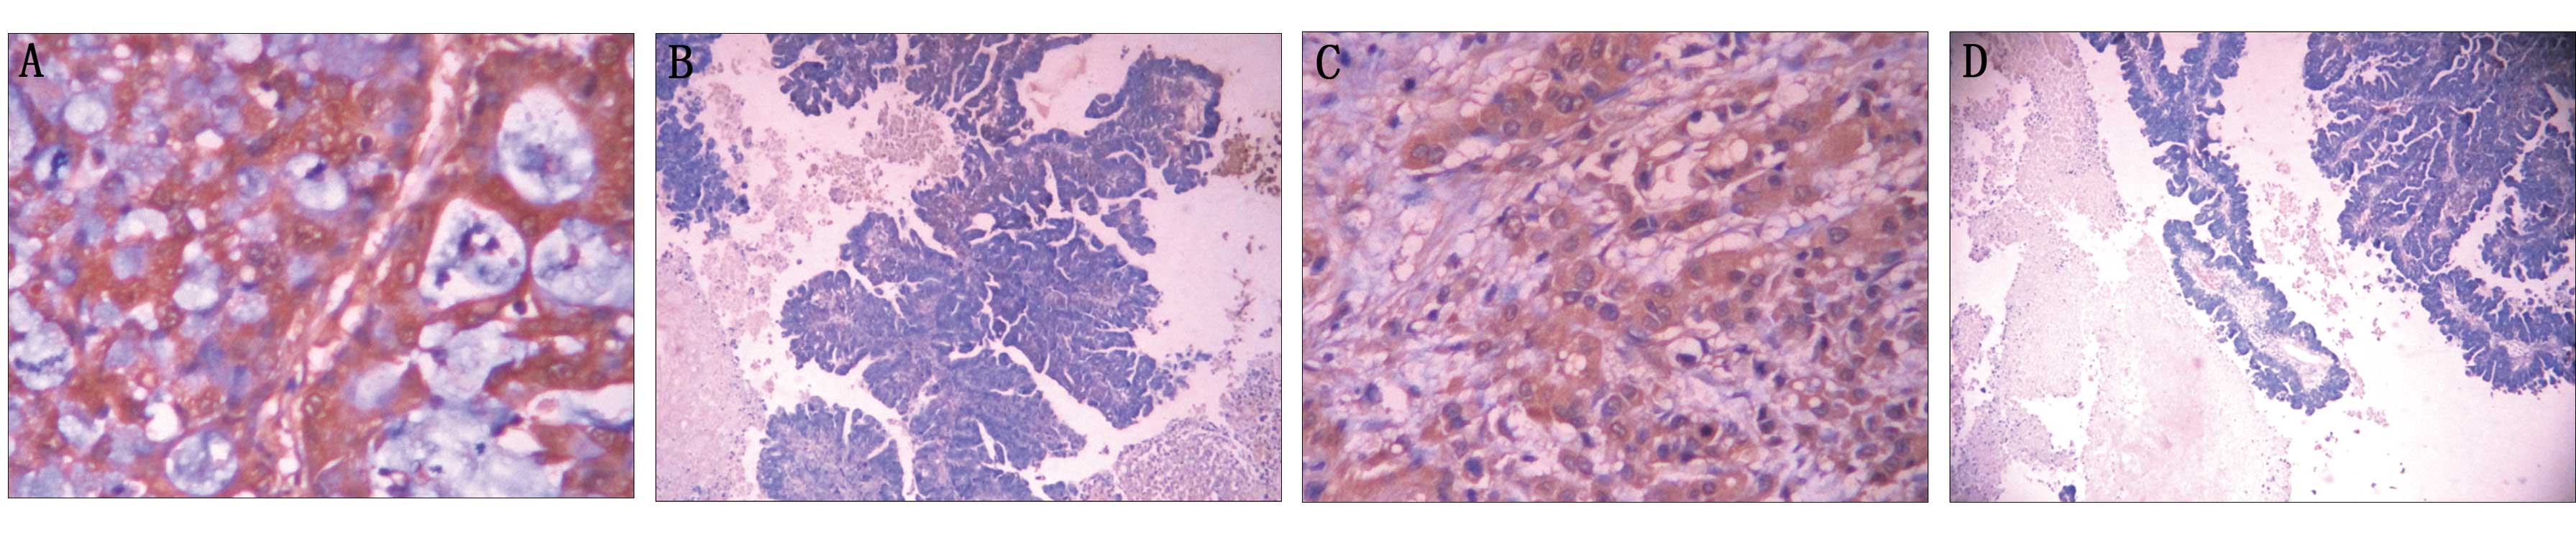
expression were not significant. The majority of TSG101- and
PEG10-positive reactions were localized in the cytoplasm of the
SC/ASCs (Fig. 1) and ACs (Fig. 2), as observed using EnVision
immunohistochemistry (Dako Laboratories).
 | Table IComparison of gallbladder SC/ASC and
AC clinicopathological features and TSG101 and PEG10 expression
status. |
Table I
Comparison of gallbladder SC/ASC and
AC clinicopathological features and TSG101 and PEG10 expression
status.
| Clinicopathological
characteristics | SC/ASC (n=46) | AC (n=80) | χ2 | P-value |
|---|
| Gender, n (%) |
| Male | 19 (41.3) | 26 (32.5) | 0.986 | 0.352 |
| Female | 27 (58.7) | 54 (67.5) | | |
| Age, n (%) |
| ≤45 years | 3 (6.5) | 16 (20.0) | 4.143 | 0.042 |
| >45 years | 43 (93.5) | 64 (80.0) | | |
| Differentiation, n
(%) |
| Well | 16 (34.8) | 27 (33.8) | | |
| Moderate | 24 (52.2) | 25 (31.3) | 8.515 | 0.014 |
| Poor | 6 (13.0) | 28 (35.0) | | |
| Maximum tumor
diameter, n (%) |
| ≤3 cm | 20 (43.5) | 50 (62.5) | 4.280 | 0.039 |
| >3 cm | 26 (56.5) | 30 (37.5) | | |
|
Cholecystolithiasis, n (%) |
| (−) | 18 (39.1) | 42 (52.5) | 2.093 | 0.148 |
| (+) | 28 (60.9) | 38 (47.5) | | |
| TNM stages, n
(%) |
| I+II | 12 (26.1) | 21 (26.3) | | |
| III | 20 (43.5) | 38 (47.5) | 0.287 | 0.866 |
| IV | 14 (30.4) | 21 (26.3) | | |
| Lymph node
metastasis, n (%) |
| (−) | 17 (37.0) | 30 (37.5) | 0.004 | 0.952 |
| (+) | 29 (63.0) | 50 (62.5) | | |
| Locoregional
invasion, n (%) |
| (−) | 16 (34.8) | 31 (38.8) | 0.197 | 0.658 |
| (+) | 30 (65.2) | 49 (61.3) | | |
| Surgical methods, n
(%) |
| Radical | 14 (30.4) | 26 (32.5) | | |
| Palliative | 18 (39.1) | 28 (35.0) | 0.215 | 0.898 |
| Without
resection | 14 (30.4) | 26 (32.5) | | |
| Mean survival time,
months (range) | 10.07 (4–25) | 10.34 (3–27) | 0.014 | 0.906 |
| TSG101, n (%) |
| (−) | 24 (52.2) | 38 (47.5) | 0.951 | 0.382 |
| (+) | 22 (47.8) | 42 (52.5) | | |
| PEG10, n (%) |
| (−) | 26 (56.5) | 38 (47.5) | 0.289 | 0.678 |
| (+) | 20 (43.5) | 42 (52.5) | | |
Association of clinicopathological
characteristics and TSG101 and PEG10 expression in SC/ASC and AC
patients
A significantly higher association was apparent
between the percentage of cases with TSG101- and PEG10-positive
expression in the SC/ASC samples with a large tumor mass size, high
TNM stage, lymph node metastasis, invasion and no resection (biopsy
only) compared with the cases of small tumor size, low TNM stage,
no lymph metastasis, no invasion and radical resection (P<0.05;
Table II).
| Table IIAssociation of TSG101 and PEG10
expression with the clinicopathological characteristics of
SC/ASC. |
Table II
Association of TSG101 and PEG10
expression with the clinicopathological characteristics of
SC/ASC.
| Clinicopathological
characteristics | Cases, n | TSG101 | PEG10 |
|---|
|
|
|---|
| Pos, n (%) | χ2 | P-value | Pos, n (%) | χ2 | P-value |
|---|
| Gender |
| Male | 19 | 8 (42.1) | 0.425 | 0.515 | 7 (36.8) | 0.580 | 0.446 |
| Female | 27 | 14 (51.9) | | | 13 (48.1) | | |
| Age |
| ≤45 years | 3 | 1 (33.3) | 0.270 | 0.603 | 1 (33.3) | 0.134 | 0.714 |
| >45 years | 43 | 21 (48.8) | | | 19 (44.2) | | |
| Pathological
type |
| SC | 26 | 14 (53.8) | 0.869 | 0.351 | 14 (53.8) | 2.616 | 0.106 |
| ASC | 20 | 8 (40.0) | | | 6 (30.0) | | |
|
Differentiation |
| Well | 16 | 6 (37.5) | 3.753 | 0.153 | 6 (37.5) | 1.573 | 0.456 |
| Moderate | 24 | 11 (45.8) | | | 10 (41.7) | | |
| Poor | 6 | 5 (83.3) | | | 4 (66.7) | | |
| Tumor mass
size |
| ≤3 cm | 20 | 6 (30.0) | 4.506 | 0.032 | 5 (25.0) | 4.916 | 0.028 |
| >3 cm | 26 | 16 (61.5) | | | 15 (57.7) | | |
| Gallstones |
| No | 18 | 9 (50.0) | 0.056 | 0.813 | 10 (55.6) | 1.755 | 0.185 |
| Yes | 28 | 13 (46.4) | | | 10 (35.7) | | |
| TNM stage |
| I+II | 12 | 3 (25.0) | | | 2 (16.7) | | |
| III | 20 | 8 (40.0) | 8.282 | 0.017 | 8 (40.0) | 8.059 | 0.018 |
| IV | 14 | 11 (78.6) | | | 10 (71.4) | | |
| Lymph
metastasis |
| No | 17 | 4 (23.5) | 6.379 | 0.012 | 4 (23.5) | 4.367 | 0.037 |
| Yes | 29 | 18 (62.1) | | | 16 (55.2) | | |
| Invasion |
| No | 16 | 4 (25.0) | 5.123 | 0.024 | 3 (18.8) | 6.105 | 0.016 |
| Yes | 30 | 18 (60.0) | | | 17 (56.7) | | |
| Surgery |
| Radical | 14 | 3 (21.4) | 9.296 | 0.010 | 3 (21.4) | 7.374 | 0.025 |
| Palliative | 18 | 8 (44.4) | | | 7 (38.9) | | |
| Biopsy | 14 | 11 (78.6) | | | 10 (71.4) | | |
For AC tumors, the percentage of TSG101- and
PEG10-positive expression was significantly higher in the cases
with poor differentiation, large tumor mass size, high TNM stage,
lymph node metastasis, invasion and collection of tumor samples by
biopsy, compared with the well-differentiated cases, small tumor
mass, low TNM stage, no lymph node metastasis, no invasion and
collection of tumor samples by resection (P<0.05 or P<0.01;
Table III).
| Table IIIAssociation of TSG101 and PEG10
expression with the clinicopathological characteristics of AC. |
Table III
Association of TSG101 and PEG10
expression with the clinicopathological characteristics of AC.
| Clinicopathological
characteristics | Cases, n | TSG101 | PEG10 |
|---|
|
|
|---|
| Pos, n (%) | χ2 | P-value | Pos, n (%) | χ2 | P-value |
|---|
| Gender |
| Male | 26 | 13 (50.0) | 0.097 | 0.756 | 13 (50.0) | 0.097 | 0.756 |
| Female | 54 | 29 (53.7) | | | 29 (53.7) | | |
| Age |
| ≤45 years | 16 | 6 (37.5) | 1.805 | 0.179 | 5 (31.3) | 3.622 | 0.057 |
| >45 years | 64 | 36 (56.3) | | | 37 (57.8) | | |
|
Differentiation |
| Well | 27 | 9 (33.3) | 9.865 | 0.007 | 10 (37.0) | 6.800 | 0.034 |
| Moderate | 25 | 12 (48.0) | | | 12 (48.0) | | |
| Poor | 28 | 21 (75.0) | | | 20 (71.4) | | |
| Tumor mass
size |
| ≤3 cm | 50 | 21 (42.0) | 5.896 | 0.015 | 22 (44.0) | 3.863 | 0.049 |
| >3 cm | 30 | 21 (70.0) | | | 20 (66.7) | | |
| Gallstones |
| No | 42 | 22 (52.4) | 0.001 | 0.982 | 20 (47.6) | 0.845 | 0.358 |
| Yes | 38 | 20 (52.6) | | | 22 (57.9) | | |
| TNM stage |
| I+II | 21 | 5 (23.8) | | | 6 (28.6) | | |
| III | 38 | 20 (52.6) | 13.749 | 0.001 | 19 (50.0) | 11.736 | 0.003 |
| IV | 21 | 17 (81.0) | | | 17 (81.0) | | |
| Lymph
metastasis |
| No | 30 | 9 (30.0) | 9.744 | 0.002 | 11 (36.7) | 4.825 | 0.032 |
| Yes | 50 | 33 (66.0) | | | 31 (62.0) | | |
| Invasion |
| No | 31 | 11 (35.5) | 5.877 | 0.015 | 12 (38.7) | 3.860 | 0.049 |
| Yes | 49 | 31 (63.3) | | | 30 (61.2) | | |
| Surgery |
| Radical | 26 | 7 (26.9) | 13.052 | 0.001 | 9 (34.6) | 9.282 | 0.010 |
| Palliative | 28 | 15 (53.6) | | | 14 (50.0) | | |
| Biopsy | 26 | 20 (76.9) | | | 19 (73.1) | | |
Correlation between survival rates and
TSG101 or PEG10 expression in patients with SC/ASC and AC
The survival information of the SC/ASC and AC
patients was collated from phone calls and letters. The follow-up
time for the present study was 2 years. The patients with a
survival time >2 years were included as censored cases in the
analysis. In total, 57 AC patients survived >1 year and 23
survived <1 year (9 survived >2 years), with an average
survival time of 10.34±0.63 months. For the SC/ASC patients, 33
survived <1 year and 13 survived >1 year (4 survived >2
years), with an average survival time of 10.07±0.78 months.
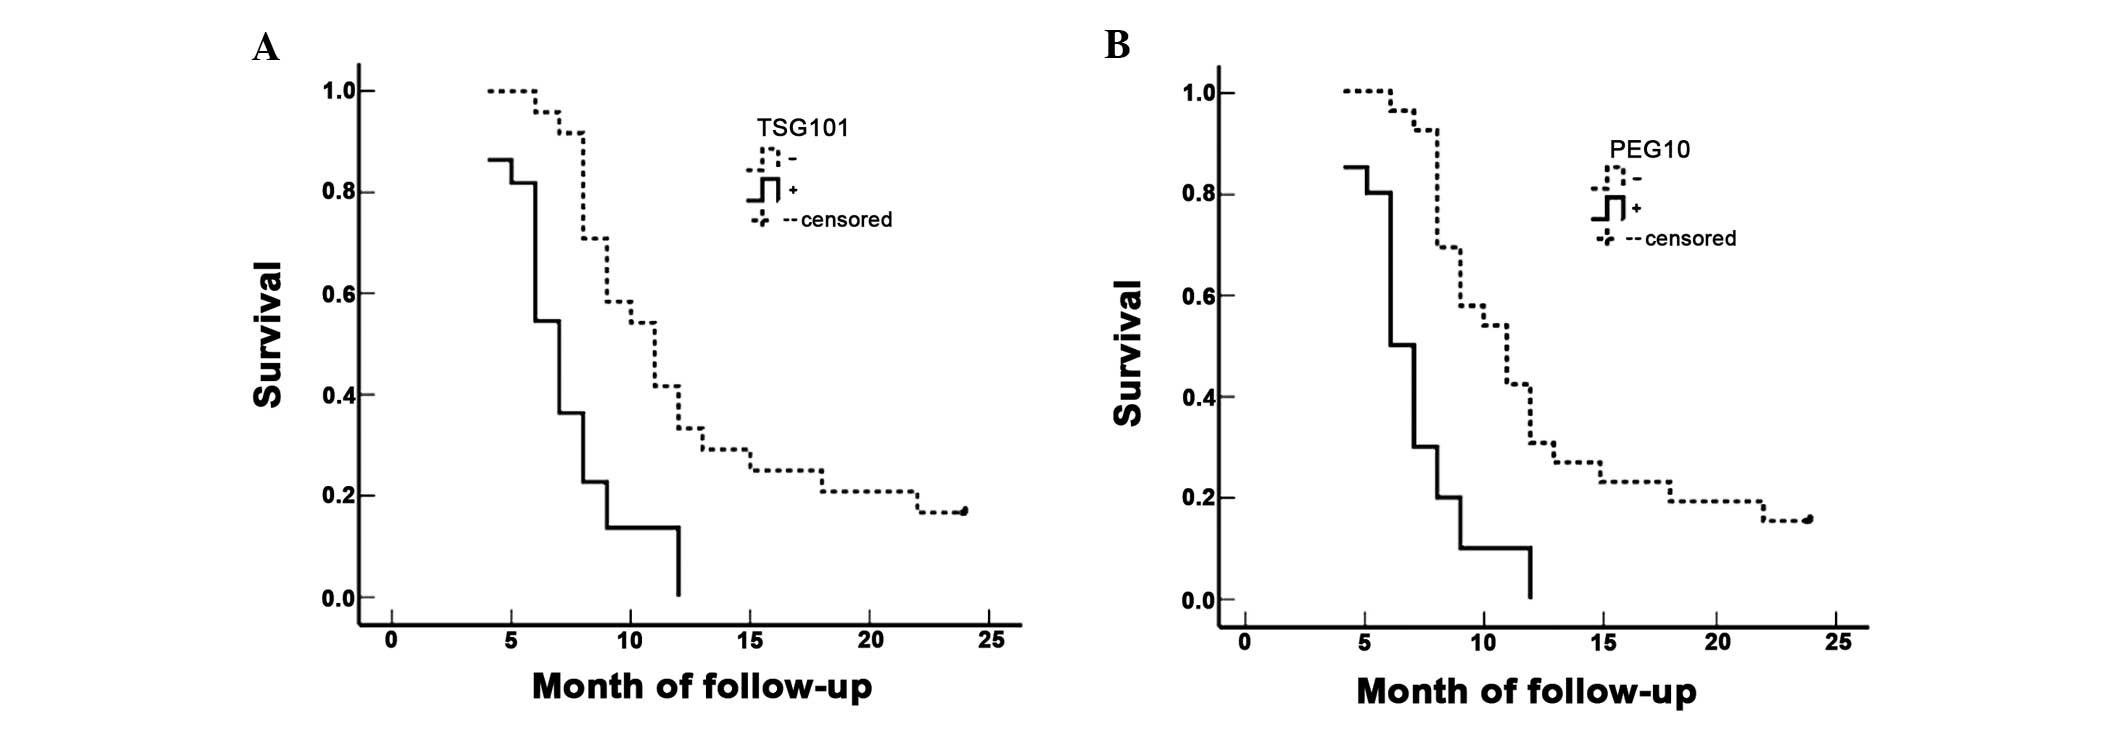
Evaluation of the SC/ASC patients using a
Kaplan-Meier survival analysis demonstrated that differentiation,
tumor size, TNM stage, lymph node metastasis, invasion and surgical
procedure (P<0.001) were significantly associated with average
survival time (Table IV), and the
average survival time of the TSG101- and PEG10-positive patients
was significantly lower than that of the patients with a negative
result for TSG101 and PEG10 expression (P<0.001; Table IV and Fig. 3). Cox’s multivariate analysis
demonstrated that the differentiation, tumor size (≥3 cm), TNM
stage, invasion, surgical procedure and TSG101- and PEG10-positive
expression were negatively correlated with overall survival,
indicating that the positive expression of TSG101 and PEG10 is a
risk factor of SCs/ASCs (Table
V).
| Table IVAssociation between TSG101 and PEG10
expression, clinicopathological characteristics and average
survival of SC/ASC patients. |
Table IV
Association between TSG101 and PEG10
expression, clinicopathological characteristics and average
survival of SC/ASC patients.
| Clinicopathological
characteristics | Cases, n | Average survival,
months (range) | χ2 | P-value |
|---|
| Gender |
| Male | 19 | 10.74 (6–24) | 0.767 | 0.381 |
| Female | 27 | 9.85 (4–24) | | |
| Age |
| ≤45 years | 3 | 15.67 (8–24) | 2.023 | 0.155 |
| >45 years | 43 | 9.84 (4–25) | | |
| Pathological
type |
| SC | 26 | 10.19 (4–24) | 0.223 | 0.637 |
| ASC | 20 | 10.25 (4–24) | | |
|
Differentiation |
| Well | 16 | 13.81 (5–24) | | |
| Moderate | 24 | 8.92 (4–18) | 19.125 | <0.0001 |
| Poor | 6 | 5.83 (4–9) | | |
| Tumor mass
size |
| ≤3 cm | 20 | 14.35 (7–24) | 31.337 | <0.0001 |
| >3 cm | 26 | 7.04 (4–11) | | |
| Gallstones |
| No | 18 | 8.22 (4–12) | 3.730 | <0.0001 |
| Yes | 28 | 11.50 (4–24) | | |
| TNM stage |
| I+II | 12 | 17.00 (9–24) | | |
| III | 20 | 9.20 (7–15) | 51.139 | <0.0001 |
| IV | 14 | 5.86 (4–8) | | |
| Lymph node
metastasis |
| No | 17 | 14.24 (4–24) | 16.219 | <0.0001 |
| Yes | 29 | 7.86 (4–15) | | |
| Invasion |
| No | 16 | 15.75 (9–24) | 32.271 | <0.0001 |
| Yes | 30 | 7.27 (4–12) | | |
| Surgery |
| Radical | 14 | 16.64 (10–24) | | |
| Palliative | 18 | 8.50 (6–12) | 50.165 | <0.0001 |
| Biopsy | 14 | 6.00 (4–8) | | |
| TSG101 |
| − | 24 | 12.96 (6–24) | 16.277 | <0.0001 |
| + | 22 | 7.23 (4–12) | | |
| PEG10 |
| − | 26 | 12.73 (6–24) | 19.275 | <0.0001 |
| + | 20 | 6.95 (4–12) | | |
| Table VMultivariate Cox regression analysis
of survival rate in SC/ASC patients. |
Table V
Multivariate Cox regression analysis
of survival rate in SC/ASC patients.
| | | | | | | 95% confidence
interval |
|---|
| | | | | | |
|
|---|
| Groups | Factors | RC | SE | Wald | P-value | RR | Lower | Upper |
|---|
| Pathological
types | SC/ASC | 0.189 | 0.363 | 0.271 | 0.603 | 1.208 | 0.593 | 2.461 |
|
Differentiation |
Well/Moderate/Poor | 1.167 | 0.402 | 8.427 | 0.004 | 3.212 | 1.461 | 7.063 |
| Tumor mass
size | ≤3 cm/>3 cm | 2.343 | 0.777 | 9.093 | 0.003 | 10.412 | 2.271 | 47.747 |
| Gallstone | No/Yes | 1.018 | 0.521 | 3.818 | 0.051 | 2.768 | 0.997 | 7.684 |
| TNM stage | I+II/III/IV | 1.170 | 0.517 | 5.121 | 0.024 | 3.222 | 1.170 | 8.876 |
| Lymph
metastasis | No/Yes | 1.061 | 0.421 | 6.351 | 0.012 | 2.889 | 1.266 | 6.594 |
| Invasion | No/Yes | 2.389 | 0.785 | 9.262 | 0.002 | 10.903 | 2.341 | 50.785 |
| Surgery |
Radical/Palliative/Biopsy | 1.068 | 0.487 | 4.809 | 0.028 | 2.910 | 1.120 | 7.557 |
| TSG101 | −/+ | 1.126 | 0.491 | 5.259 | 0.022 | 3.083 | 1.178 | 8.072 |
| PEG10 | −/+ | 1.194 | 0.486 | 6.036 | 0.014 | 3.300 | 1.273 | 8.555 |
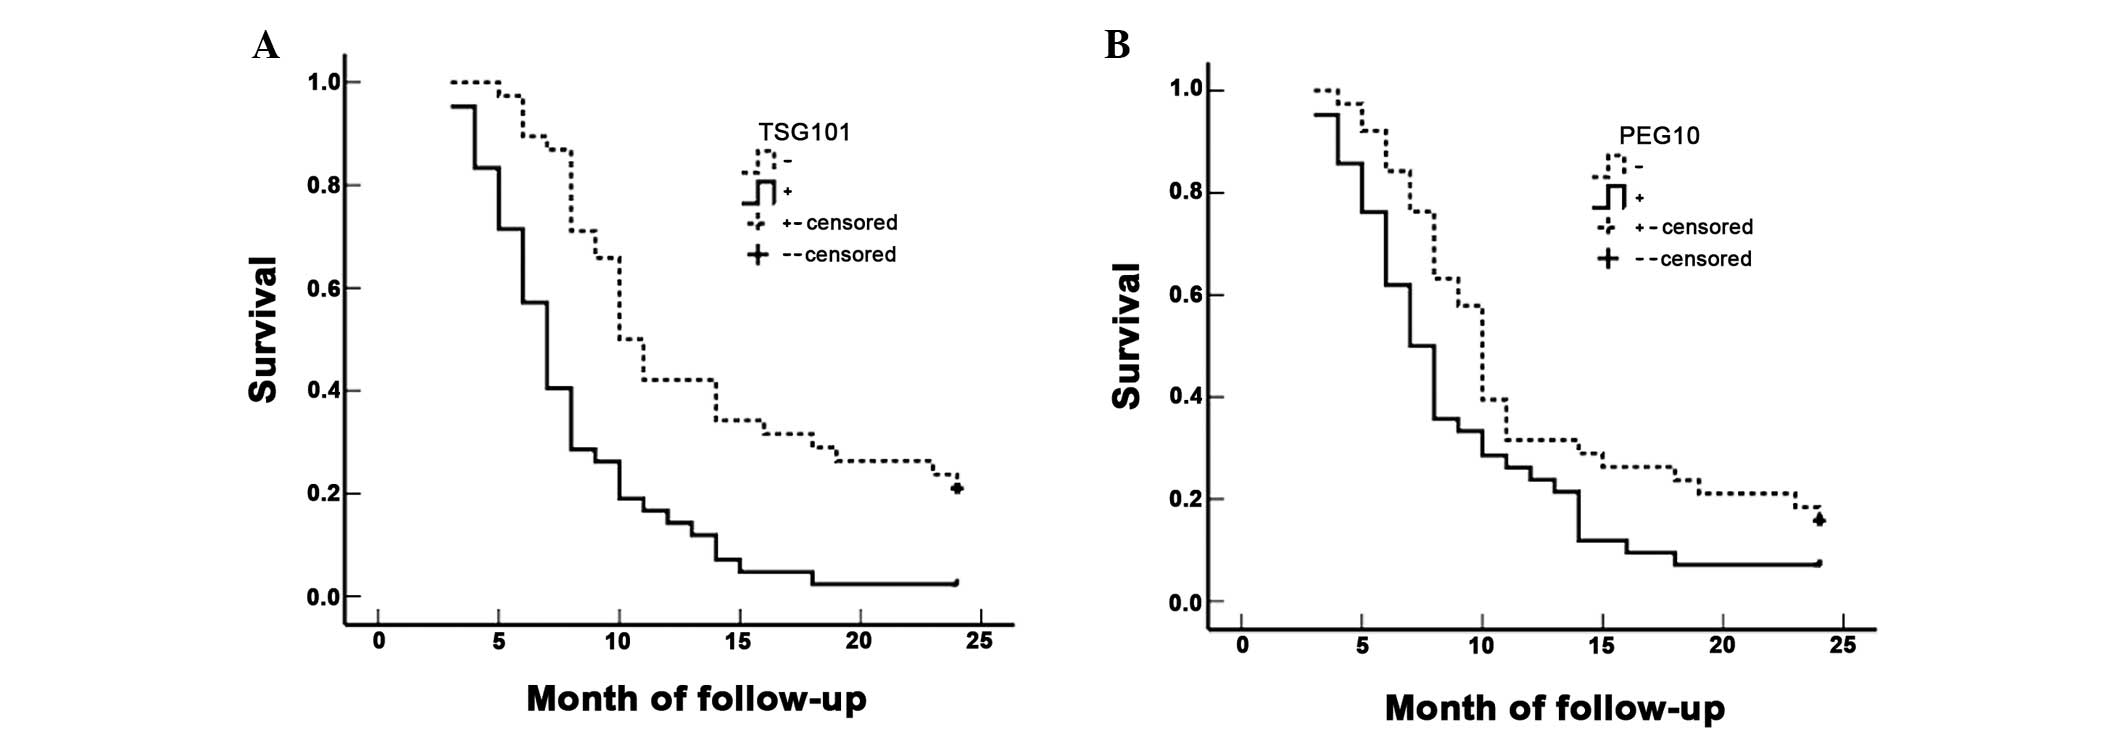
The Kaplan-Meier survival analysis of the AC
patients revealed similar results as for the SC/ASC patients
(Table VI). The average survival
time of the TSG101- or PEG10-positive AC patients was significantly
lower than patients exhibiting negative TSG101 or PEG10 expression
(P<0.001; Table VI and Fig. 4). Cox’s multivariate analysis
demonstrated that differentiation, tumor size (≥3 cm), TNM stage,
lymph node metastasis, invasion, surgical procedure and TSG101- and
PEG10-positive expression positively correlated with the poor
survival rate of the AC patients (Table VII).
| Table VIAssociation between TSG101 and PEG10
expression, clinicopathological characteristics and average
survival time of AC patients. |
Table VI
Association between TSG101 and PEG10
expression, clinicopathological characteristics and average
survival time of AC patients.
| Clinicopathological
characteristics | Cases, n | Average survival,
months (range) | χ2 | P-value |
|---|
| Gender |
| Male | 26 | 9.58 (3–24) | 2.567 | 0.109 |
| Female | 54 | 11.30 (3–24) | | |
| Age |
| ≤45 years | 16 | 10.81 (4–24) | 0.003 | 0.956 |
| >45 years | 64 | 10.72 (3–24) | | |
|
Differentiation |
| Well | 27 | 15.07 (5–24) | | |
| Moderate | 25 | 10.60 (4–24) | 32.501 | <0.0001 |
| Poor | 28 | 6.68 (3–14) | | |
| Tumor mass
size |
| ≤3 cm | 50 | 13.70 (6–24) | 68.283 | <0.0001 |
| >3 cm | 30 | 5.80 (3–10) | | |
| Gallstones |
| No | 42 | 10.19 (3–24) | 0.246 | 0.620 |
| Yes | 38 | 11.34 (4–24) | | |
| TNM stage |
| I+II | 21 | 18.96 (5–24) | | |
| III | 38 | 9.29 (6–15) | 105.825 | <0.0001 |
| IV | 21 | 5.14 (3–7) | | |
| Lymph node
metastasis |
| No | 30 | 16.27 (4–24) | 42.372 | <0.0001 |
| Yes | 50 | 7.42 (3–14) | | |
| Invasion |
| No | 31 | 16.68 (7–24) | 55.535 | <0.0001 |
| Yes | 49 | 6.98 (3–11) | | |
| Surgery |
| Radical | 26 | 18.31 (10–24) | | |
| Palliative | 28 | 8.64 (6–11) | 113.141 | <0.0001 |
| Biopsy | 26 | 5.42 (3–9) | | |
| TSG101 |
| − | 38 | 13.76 (5–24) | 18.937 | <0.0001 |
| + | 42 | 8.00 (3–24) | | |
| PEG10 |
| − | 38 | 12.40 (4–24) | 4.677 | 0.031 |
| + | 42 | 9.24 (3–24) | | |
| Table VIIMultivariate Cox regression analysis
of survival rate in AC patients. |
Table VII
Multivariate Cox regression analysis
of survival rate in AC patients.
| | | | | | | 95% confidence
interval |
|---|
| | | | | | |
|
|---|
| Groups | Factors | RC | SE | Wald | P-value | R | R Lower | Upper |
|---|
|
Differentiation |
Well/Moderate/Poor | 1.192 | 0.449 | 7.048 | 0.008 | 3.294 | 1.366 | 7.941 |
| Tumor mass
size | ≤3 cm/>3 cm | 1.127 | 0.430 | 6.869 | 0.009 | 3.086 | 1.329 | 7.169 |
| Gallstone | No/Yes | 0.213 | 0.262 | 0.661 | 0.416 | 1.237 | 0.740 | 2.068 |
| TNM stage | I+II/III/IV | 1.282 | 0.452 | 8.045 | 0.005 | 3.604 | 1.486 | 8.740 |
| Lymph
metastasis | No/Yes | 1.456 | 0.548 | 7.059 | 0.008 | 4.289 | 1.465 | 12.555 |
| Invasion | No/Yes | 1.420 | 0.501 | 8.033 | 0.005 | 4.137 | 1.550 | 11.045 |
| Surgery |
Radical/Palliative/Biopsy | 1.420 | 0.468 | 9.206 | 0.002 | 4.137 | 1.653 | 10.353 |
| TSG101 | −/+ | 1.198 | 0.480 | 6.229 | 0.013 | 3.313 | 1.293 | 8.489 |
| PEG10 | −/+ | 1.140 | 0.495 | 5.304 | 0.021 | 3.127 | 1.185 | 8.250 |
Discussion
The current knowledge on the clinicopathological
characteristics of SC/ASC has mainly been obtained from individual
case studies or analyses of small case series. Therefore, accurate
understanding of the differences between rare SC/ASC tumors and
ordinary adenocarcinomas is not possible without further studies.
The reported incidence of squamous differentiation is 1–12% in
gallbladder malignancies (26,27),
and in the present study 4.34% SCs/ASCs were observed. A previous
study identified that the occurrence of SC/ASC is predominant in
females (F/M, 3.8) (25), however
in the present study there was no significant difference (F/M,
1.4). It was also apparent in the present study that the prevalence
of SC/ASC was more significant in older patients compared with AC.
In previous studies, it has been demonstrated that the
proliferation of SC occurs at a higher rate than AC, whereas the
prevalence of squamous tumors is less frequent with lymph node
metastasis (28,29). Observations from the present study
revealed no differences in the occurrence of invasion and lymph
node metastasis between AC and SC/ASC, however, more SC/ASC
patients had a larger tumor size. In total, 86% of SC/ASC and 74%
of AC patients were diagnosed at an inoperable stage, however, for
the remaining patients it was apparent that radical resection was a
good prognostic factor for AC and SC/ASC. There was no significant
difference in the post-operative survival time between cases of AC
(10.34±0.63 months) and SC/ASC (10.07±0.78 months). Furthermore, no
significant differences in differentiation, TNM stage and surgical
curability were found between AC and SC/ASC. These observations
indicated that the clinicopathological presentations of SC/ASC did
not appear to be significantly different from ordinary AC, and that
squamous differentiation was no more aggressive than glandular
differentiation in the gallbladder.
A previous study has demonstrated that the PEG10
gene is overexpressed in leukemia, breast cancer, prostate cancer,
hepatocellular carcinoma and pancreatic cancer (11). Knockdown of PEG10 has been shown to
inhibit the proliferation of cancer cells (13). Further evidence has demonstrated
that PEG10 expression can be regulated by the proto-oncogene, MYC
(4), and that PEG10 also interacts
with the TGF-β type I receptor, ALK1 (16). Notably, the expression of human
telomerase reverse transcriptase is downregulated when PEG10 is
knocked down by siRNA (15). This
evidence indicates the involvement of PEG10 in carcinogenesis.
Similarly, the overexpression of TSG101 has been detected in human
papillary thyroid carcinomas (21),
ovarian cancer (19),
gastrointestinal tumors (22) and
colorectal carcinoma (23).
Silencing of TSG101 leads to growth arrest and cell death in breast
and prostate cancer cells (24).
Additionally, overexpression of TSG101 plays an oncogenic role by
inactivating p53 through MDM2 upregulation (21,25).
This evidence also strongly indicates that TSG101 is involved in
tumorigenesis. Certain studies have found that TSG101 is
overexpressed in the vincristine-resistant human gastric
adenocarcinoma cell line, SGC7901/VCR (30). The same group later found that the
silencing of TSG101 expression significantly increased SGC7901/VCR
sensitization to chemotherapeutic drugs through reducing adverse
drug reactions (31), indicating
that TSG101 plays a critical role in chemoresistance. Although no
studies have revealed that PEG10 is directly involved in
chemoresistance, overexpressed PEG10 is involved in apoptotic
resistance (12). This may be an
explanation for why chemotherapy and radiation therapy exhibit less
of an effect in GBC.
Although the overexpression of PEG10 and TSG101 in
cancer cells has been previously studied, their expression in
SC/ASC and AC of the gallbladder has yet to be identified. In the
present study, an extensive collection of human SC/ASC and AC
samples was used to demonstrate that overexpressed PEG10 and TSG101
are associated with large tumor mass size, high TNM stage, lymph
node metastasis, invasion and no resection (only biopsy) in SC/ASC
and AC, and with poor differentiation in AC. It was also
demonstrated that the survival time in patients with overexpression
of PEG10 and TSG101 was significantly shorter when compared with
patients with lower expression; Cox’s multivariate analysis
indicated that the overexpression of PEG10 and TSG101 was
positively correlated with mortality. The present study indicates
that the function of PEG10 and TSG101 may be involved in the
progression, metastasis and prognosis of AC and SC/ASC.
In conclusion, the elevated expression of PEG10 and
TSG101 in gallbladder SC/ASC and AC samples indicates that they are
significant markers for progression, clinical biological behavior
and prognosis. The involvement of TSG101 in chemoresistance and the
role of PEG10 in apoptosis resistance indicate that these two
markers have a strong potential to be developed as a target for
gene therapy, which may sensitize chemotherapy and radiotherapy.
Also, patients with high PEG10 and TSG101 expression in their
tumors are more likely to suffer from invasion and metastatic
recurrence. These patients may require close monitoring for
clinical signs of relapse, so that therapeutic inventions can be
applied early enough for optimal outcomes.
Acknowledgements
This study was supported by the Department of
Pathology, Basic School of Medicine, Central South University
(Changsha, China); Department of Pathology, Second Xiangya Hospital
(Changsha, China); Department of Pathology, Third Xiangya Hospital
(Changsha, China); Department of Pathology, Loudi Central Hospital
(Loudi, China); and the Department of Pathology, Hunan Provincial
Tumor Hospital (Changsha, China).
References
|
1
|
Azad MB, Chen Y and Gibson SB: Regulation
of autophagy by reactive oxygen species (ROS): implications for
cancer progression and treatment. Antioxid Redox Signal.
11:777–790. 2009. View Article : Google Scholar : PubMed/NCBI
|
|
2
|
Pelicano H, Carney D and Huang P: ROS
stress in cancer cells and therapeutic implications. Drug Resist
Updat. 7:97–110. 2004. View Article : Google Scholar : PubMed/NCBI
|
|
3
|
Storz P: Reactive oxygen species in tumor
progression. Front Biosci. 10:1881–1896. 2005. View Article : Google Scholar : PubMed/NCBI
|
|
4
|
Brigelius-Flohé R and Kipp A: Glutathione
peroxidases in different stages of carcinogenesis. Biochim Biophys
Acta. 1790:1555–1568. 2009.PubMed/NCBI
|
|
5
|
Wiseman H and Halliwell B: Damage to DNA
by reactive oxygen and nitrogen species: role in inflammatory
disease and progression to cancer. Biochem J. 313:17–29.
1996.PubMed/NCBI
|
|
6
|
Leto TL and Geiszt M: Role of Nox family
NADPH oxidases in host defense. Antioxid Redox Signal. 8:1549–1561.
2006. View Article : Google Scholar : PubMed/NCBI
|
|
7
|
Cullen JJ, Mitros FA and Oberley LW:
Expression of antioxidant enzymes in diseases of the human
pancreas: another link between chronic pancreatitis and pancreatic
cancer. Pancreas. 26:23–27. 2003. View Article : Google Scholar
|
|
8
|
Ono R, Kobayashi S, Wagatsuma H, et al: A
retrotransposon-derived gene, PEG10, is a novel imprinted gene
located on human chromosome 7q21. Genomics. 73:232–237. 2001.
View Article : Google Scholar : PubMed/NCBI
|
|
9
|
Okabe H, Satoh S, Furukawa Y, et al:
Involvement of PEG10 in human hepatocellular carcinogenesis through
interaction with SIAH1. Cancer Res. 63:3043–3048. 2003.PubMed/NCBI
|
|
10
|
Kainz B, Shehata M, Bilban M, et al:
Overexpression of the paternally expressed gene 10 (PEG10) from the
imprinted locus on chromosome 7q21 in high-risk B-cell chronic
lymphocytic leukemia. Int J Cancer. 121:1984–1993. 2007. View Article : Google Scholar : PubMed/NCBI
|
|
11
|
Tsuji K, Yasui K, Gen Y, et al: PEG10 is a
probable target for the amplification at 7q21 detected in
hepatocellular carcinoma. Cancer Genet Cytogenet. 198:118–125.
2010. View Article : Google Scholar : PubMed/NCBI
|
|
12
|
Chunsong H, Yuling H, Li W, et al: CXC
chemokine ligand 13 and CC chemokine ligand 19 cooperatively render
resistance to apoptosis in B cell lineage acute and chronic
lymphocytic leukemia CD23+CD5+ B cells. J Immunol. 177:6713–6722.
2006.PubMed/NCBI
|
|
13
|
Li CM, Margolin AA, Salas M, et al: PEG10
is a c-MYC target gene in cancer cells. Cancer Res. 66:665–672.
2006. View Article : Google Scholar : PubMed/NCBI
|
|
14
|
Ip WK, Lai PB, Wong NL, et al:
Identification of PEG10 as a progression related biomarker for
hepatocellular carcinoma. Cancer Lett. 250:284–291. 2007.
View Article : Google Scholar : PubMed/NCBI
|
|
15
|
Jie X, Lang C, Jian Q, et al: Androgen
activates PEG10 to promote carcinogenesis in hepatic cancer cells.
Oncogene. 26:5741–5751. 2007. View Article : Google Scholar : PubMed/NCBI
|
|
16
|
Lux A, Beil C, Majety M, et al: Human
retroviral gag- and gag-pol-like proteins interact with the
transforming growth factor-beta receptor activin receptor-like
kinase 1. J Biol Chem. 280:8482–8493. 2005. View Article : Google Scholar : PubMed/NCBI
|
|
17
|
Ono R, Nakamura K, Inoue K, et al:
Deletion of Peg10, an imprinted gene acquired from a
retrotransposon, causes early embryonic lethality. Nat Genet.
38:101–106. 2006. View
Article : Google Scholar : PubMed/NCBI
|
|
18
|
Li L and Cohen SN: Tsg101: a novel tumor
susceptibility gene isolated by controlled homozygous functional
knockout of allelic loci in mammalian cells. Cell. 85:319–329.
1996. View Article : Google Scholar
|
|
19
|
Young TW, Rosen DG, Mei FC, et al:
Up-regulation of tumor susceptibility gene 101 conveys poor
prognosis through suppression of p21 expression in ovarian cancer.
Clin Cancer Res. 13:3848–3854. 2007. View Article : Google Scholar
|
|
20
|
Bashirova AA, Bleiber G, Qi Y, et al:
Consistent effects of TSG101 genetic variability on multiple
outcomes of exposure to human immunodeficiency virus type 1. J
Virol. 80:6757–6763. 2006. View Article : Google Scholar
|
|
21
|
Liu RT, Huang CC, You HL, et al:
Overexpression of tumor susceptibility gene TSG101 in human
papillary thyroid carcinomas. Oncogene. 21:4830–4837. 2002.
View Article : Google Scholar : PubMed/NCBI
|
|
22
|
Koon N, Schneider-Stock R, Sarlomo-Rikala
M, et al: Molecular targets for tumour progression in
gastrointestinal stromal tumours. Gut. 53:235–240. 2004. View Article : Google Scholar : PubMed/NCBI
|
|
23
|
Ma XR, Edmund Sim UH, Pauline B, et al:
Overexpression of WNT2 and TSG101 genes in colorectal carcinoma.
Trop Biomed. 25:46–57. 2008.PubMed/NCBI
|
|
24
|
Zhu G, Gilchrist R, Borley N, et al:
Reduction of TSG101 protein has a negative impact on tumor cell
growth. Int J Cancer. 109:541–547. 2004. View Article : Google Scholar
|
|
25
|
Li L, Liao J, Ruland J, et al: A
TSG101/MDM2 regulatory loop modulates MDM2 degradation and MDM2/p53
feedback control. Proc Natl Acad Sci USA. 98:1619–1624. 2001.
View Article : Google Scholar : PubMed/NCBI
|
|
26
|
Hawkins WG, DeMatteo RP, Jarnagin WR,
Ben-Porat L, Blumgart LH and Fong Y: Jaundice predicts advanced
disease and early mortality in patients with gallbladder cancer.
Ann Surg Oncol. 11:310–315. 2004. View Article : Google Scholar : PubMed/NCBI
|
|
27
|
Roa JC, Tapia O, Cakir A, Basturk O,
Dursun N, Akdemir D, Saka B, Losada H, Bagci P and Adsay NV:
Squamous cell and adenosquamous carcinomas of the gallbladder:
clinicopathological analysis of 34 cases identified in 606
carcinomas. Mod Pathol. 24:1069–1078. 2011. View Article : Google Scholar : PubMed/NCBI
|
|
28
|
Kondo M, Dono K, Sakon M, et al:
Adenosquamous carcinoma of the gallbladder. Hepatogastroenterology.
49:1230–1234. 2002.PubMed/NCBI
|
|
29
|
Muzio G, Maggiora M, Paiuzzi E, Oraldi M
and Canuto RA: Aldehyde dehydrogenases and cell proliferation. Free
Radic Biol Med. 52:735–746. 2012. View Article : Google Scholar : PubMed/NCBI
|
|
30
|
Zhao Y, You H, Liu F, et al:
Differentially expressed gene profiles between multidrug resistant
gastric adenocarcinoma cells and their parental cells. Cancer Lett.
185:211–218. 2002. View Article : Google Scholar
|
|
31
|
Shen H, Pan Y, Han Z, et al: Reversal of
multidrug resistance of gastric cancer cells by downregulation of
TSG101 with TSG101siRNA. Cancer Biol Ther. 3:561–565. 2004.
View Article : Google Scholar
|