Introduction
Gastric cancer (GC) is the fourth most common type
of malignancy worldwide, which results in 989,600 novel cases and
738,000 fatalities annually, specifically in Asian countries
(1). Recent advancements in
diagnosis and treatment modalities have been made, however, the
prognosis of GC patients remains poor. As current therapeutic
strategies are insufficient and do not achieve complete tumor
ablation, it is important to analyze the molecular mechanisms of GC
and identify novel biomarkers, as well as targets for therapeutic
approaches, which may improve the clinical outcome for GC
patients.
Collagen VI was initially identified as an
extracellular matrix protein. It forms a microfilament network and
binds to extracellular matrix proteins via its functional
subdomains, which is important for the organization of fibrillar
collagens and adhesion to the basement membrane (2). Collagen VI has recently attracted
interest due to its involvement in breast and ovarian cancers
(3–5). It is composed of three distinct
α-chains (α1, -2 and -3) and collagen VI α3 (COL6A3) encodes the α3
chain, which is markedly longer than the other two chains (6). In a previous study, COL6A3 was shown
to be upregulated in ovarian cancer (7), and Sherman-Baust et al
(5) identified that the expression
of COL6A3 was correlated with cisplatin resistance in ovarian
cancer cell lines. Furthermore, highly or moderately differentiated
ovarian tumors expressed lower levels of COL6A3 than poorly
differentiated tumors, which indicated that the expression of
COL6A3 was associated with the grade of the ovarian tumor (5). A recent exon array analysis study
demonstrated that an alternative long isoform of COL6A3 was
expressed, almost exclusively, in cancer samples, and may
potentially serve as a novel cancer biomarker (8). Currently, the majority of studies
relating to the oncogenic role of this gene focus on ovarian and
breast cancer, however, the expression pattern and the biological
functions of COL6A3 in human GC remain unknown.
In the present study, the authors investigated
whether the expression level of COL6A3 was altered in GC, and a
microarray meta-analysis was performed in order to assess the
functional characteristics and molecular mechanisms of COL6A3 in
GC.
Materials and methods
Gene expression patterns in GC
The Oncomine database (http://www.oncomine.org) was used to examine the
differences in the transcriptional profiles between GC tissues and
the adjacent normal tissues (9).
Only the datasets that contained cancer versus normal analysis at
the mRNA expression level were selected for analysis in the present
study. In total, four GeneChip datasets, consisting of 318 paired
GC and non-cancerous tissues, were selected according to the
criteria shown in Table I.
 | Table IOncomine datasets obtained for use in
the present study. |
Table I
Oncomine datasets obtained for use in
the present study.
Cell culture
Five human GC cell lines (AGS, HGC-27, BGC-823,
SGC-7901 and MGC80-3) and one immortalized gastric cell line
(GES-1) were purchased from Shanghai Institute of Cell Biology
(Shanghai, China). All cell lines were incubated in Dulbecco’s
modified Eagle’s medium (Gibco-BRL, Carlsbad, CA, USA) with 10%
fetal bovine serum (SAFC Biosciences Inc., Lenexa, KS, USA), 100
U/ml penicillin and 100 mg/ml streptomycin (Sigma-Aldrich, St.
Louis, MO, USA).
Quantitative polymerase chain reaction
(qPCR) analysis
TRIzol reagent (Invitrogen Life Technologies,
Carlsbad, CA, USA) was used to extract the total RNA from whole
cells, and reverse-transcription was conducted using a
TaqMan® Reverse Transcription kit (Applied Biosystems,
Foster City, CA, USA). The DNA was amplified using an
ABI® 7500 Real-Time PCR system (Applied Biosystems) and
SYBR Premix Ex Taq (Takara, Kusatsu, Japan). The ΔΔCt method was
used to calculate the relative RNA expression, which was normalized
to GAPDH expression. PCR was performed using the following primers:
forward, 5′-GAGACGCAGTGAGTGGGAAA-3′ and reverse,
5′-AGAGTCTTGTGCTGCTTGCT-3′ for COL6A3; and forward,
5′-CTCTCTGCTCCTCCTGTTCGAC-3′ and reverse, 5′-TGAGCGATGTGGCTCGGCT-3′
for GAPDH.
Co-expression analysis
The Oncomine database co-expression analysis tool
was used to conduct the co-expression analysis of the microarray
datasets. Using the co-expression score, the top 150 genes of each
dataset were selected. The genes that appeared in at least two of
the three datasets were defined as COL6A3 co-expressed genes.
Gene ontology (GO) and pathway enrichment
analysis
GO and pathway enrichment analysis were conducted to
examine COL6A3 co-expressed genes using the Database for
Annotation, Visualization and Integrated Discovery (DAVID;
http://david.abcc.ncifcrf.gov/). The
categories, GOTERM_BP_3, GOTERM_CC_2 and GOTERM_MF_3 were selected,
and the other options were set as defaults.
Construction of the gene interaction
network
The gene interaction network was constructed using a
gene expression pattern scanner (GePS: http://www.genomatix.de/) as described previously
(10).
Statistical analysis
The independent Student’s t test was used to analyze
the differences between two groups. Statistical analysis was
performed using SPSS software version 16.0 (SPSS, Chicago, IL,
USA). Data are presented as the means ± SD. P<0.05 was
considered to indicate a statistically significant difference.
Results
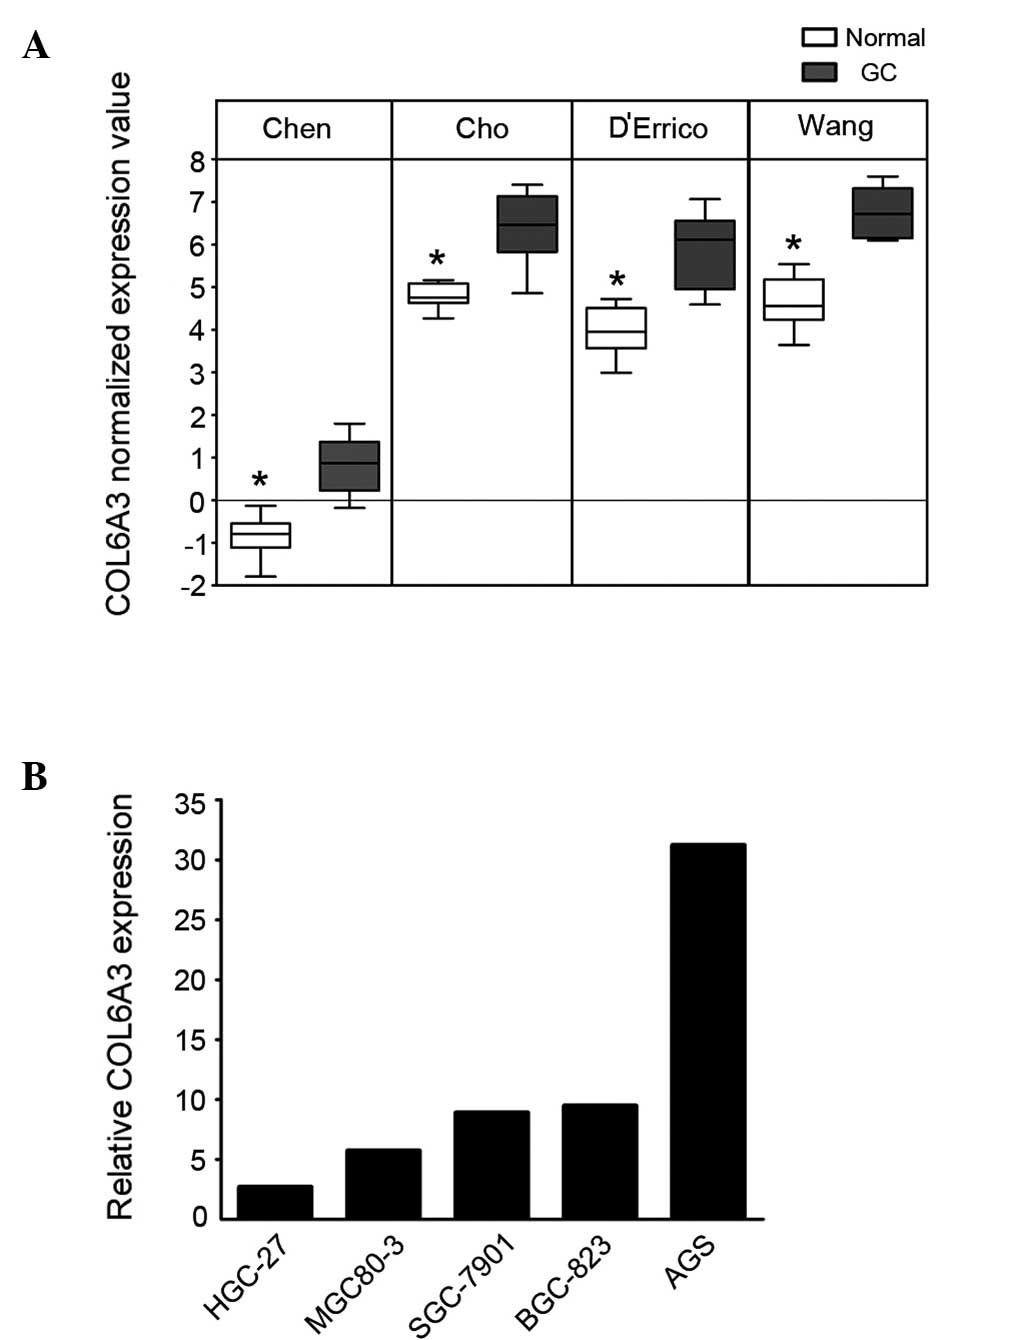
COL6A3 is commonly overexpressed in
GC
To determine the changes in the transcriptional
pattern of GC cells, microarray datasets from the studies by Chen
et al (11), Cho et
al (12), D’Errico et al
(13) and Wang et al
(14) were analyzed using the
Oncomine database. COL6A3 demonstrated a significant overexpression
in the GC cells (P=3.98×10⁻¹⁵; Fig. 1A). To confirm this finding, the
expression of COL6A3 in one immortalized gastric cell line (GES-1)
and five GC cell lines (AGS, HGC-27, BGC-823, SGC-7901, MGC80-3)
was analyzed using qPCR. The five GC cell lines exhibited ≥2.5-fold
overexpression of COL6A3 compared with that of GES-1 cells
(Fig. 1B).
Genes co-expressed with COL6A3
A previous study indicated that genes which are
co-expressed in different conditions may be functionally related or
co-regulated (15). Therefore, a
microarray co-expression analysis was conducted to identify the
genes that were co-expressed with COL6A3. The dataset from the
study by D’Errico et al (13) did not contain any co-expression
data, therefore, the other three datasets consisting of 249 paired
tissues were selected for inclusion in the co-expression analysis.
Using a cut-off of the top 150 genes, which were identified by the
co-expression score from each dataset, and with at least two
appearances on the co-expressed list, 62 genes were identified as
genes that were co-expressed with COL6A3 (Table II).
| Table IICollagen VI α3 co-expressed genes with
the cut-off for selection defined as an appearance in two
datasets. |
Table II
Collagen VI α3 co-expressed genes with
the cut-off for selection defined as an appearance in two
datasets.
| Gene | Gene name | No. of
appearances |
|---|
| COL6A3 | Collagen type VI
α3 | 3 |
| COL1A2 | Collagen type I
α2 | 3 |
| COL1A1 | Collagen type I
α1 | 3 |
| COL12A1 | Collagen type XII
α1 | 3 |
| THY1 | Thy-1 cell surface
antigen | 3 |
| THBS2 | Thrombospondin 2 | 3 |
| BGN | Biglycan | 3 |
| CTHRC1 | Collagen triple helix
repeat containing 1 | 3 |
| SULF1 | Sulfatase 1 | 3 |
| FAP | Fibroblast activation
protein-α | 3 |
| SFRP4 | Secreted
frizzled-related protein 4 | 3 |
| TIMP1 | Tissue inhibitor of
metallopeptidase 1 | 3 |
| WNT2 | Wingless-type mouse
mammary tumor virus integration site family member 2 | 3 |
| COL11A1 | Collagen type XI
α1 | 3 |
| BMP1 | Bone morphogenetic
protein 1 | 3 |
| SPOCK1 | Sparc/osteonectin
cwcv and kazal-like domains proteoglycan (testican) 1 | 3 |
| SERPINH1 | Serpin peptidase
inhibitor clade H (heat shock protein 47) member 1 (collagen
binding protein 1) | 2 |
| CPXM1 | Carboxypeptidase X
(M14 family) member 1 | 2 |
| INHBA | Inhibin β A | 2 |
| CDH11 | Cadherin 11, type 2,
OB-cadherin (osteoblast) | 2 |
| RAB31 | Member of the RAS
oncogene family | 2 |
| ANTXR1 | Anthrax toxin
receptor 1 | 2 |
| NID2 | Nidogen 2
(osteonidogen) | 2 |
| PDGFRB | Platelet-derived
growth factor receptor β polypeptide | 2 |
| COL4A2 | Collagen type IV
α2 | 2 |
| COL4A1 | Collagen type IV
α1 | 2 |
| TGFBI | Transforming growth
factor β-induced (68kDa) | 2 |
| PLAU | Plasminogen activator
urokinase | 2 |
| PRRX1 | Paired related
homeobox 1 | 2 |
| LOX | Lysyl oxidase | 2 |
| PLXDC2 | Plexin domain
containing 2 | 2 |
| LAMC1 | Laminin γ1 (formerly
LAMB2) | 2 |
| OLFML2B | Olfactomedin-like
2B | 2 |
| CLDN4 | Claudin 4 | 2 |
| FAM83D | Family with
sequence similarity 83, member D | 2 |
| ITGB5 | Integrin β5 | 2 |
| TNC | Tenascin C | 2 |
| SNAI2 | Snail family zinc
finger 2 | 2 |
| FRMD6 | FERM domain
containing 6 | 2 |
| COL6A1 | Collagen type VI
α1 | 2 |
| NUAK1 | NUAK family,
SNF1-like kinase 1 | 2 |
| HSPG2 | Heparan sulfate
proteoglycan 2 | 2 |
| NOTCH3 | Notch 3 | 2 |
| CD276 | Cluster of
differentiation 276 molecule | 2 |
| WNT5A | Wingless-type mouse
mammary tumor virus integration site family member 5A | 2 |
| ECM1 | Extracellular
matrix protein 1 | 2 |
| PDPN | Podoplanin | 2 |
| TNFAIP6 | Tumor necrosis
factor α-induced protein 6 | 2 |
| ADAM12 | A disintegrin and
metallo-peptidase domain 12 | 2 |
| GAS1 | Growth
arrest-specific 1 | 2 |
| THBS1 | Thrombospondin
1 | 2 |
| COL10A1 | Collagen type X
α1 | 2 |
| FNDC1 | Fibronectin type
III domain containing 1 | 2 |
| SPHK1 | Sphingosine kinase
1 | 2 |
| MMP11 | Matrix
metallopeptidase 11 (stromelysin 3) | 2 |
| CST1 | Cystatin SN | 2 |
| KRT80 | Keratin 80 | 2 |
| PMEPA1 | Prostate
transmembrane protein, androgen induced 1 | 2 |
| SPP1 | Secreted
phosphoprotein 1 | 2 |
| TNFRSF11B | Tumor necrosis
factor receptor superfamily, member 11b | 2 |
| IGF2BP3 | Insulin-like growth
factor 2 mRNA binding protein 3 | 2 |
| MFAP2 |
Microfibrillar-associated protein 2 | 2 |
| EHD2 | EH-domain
containing 2 | 2 |
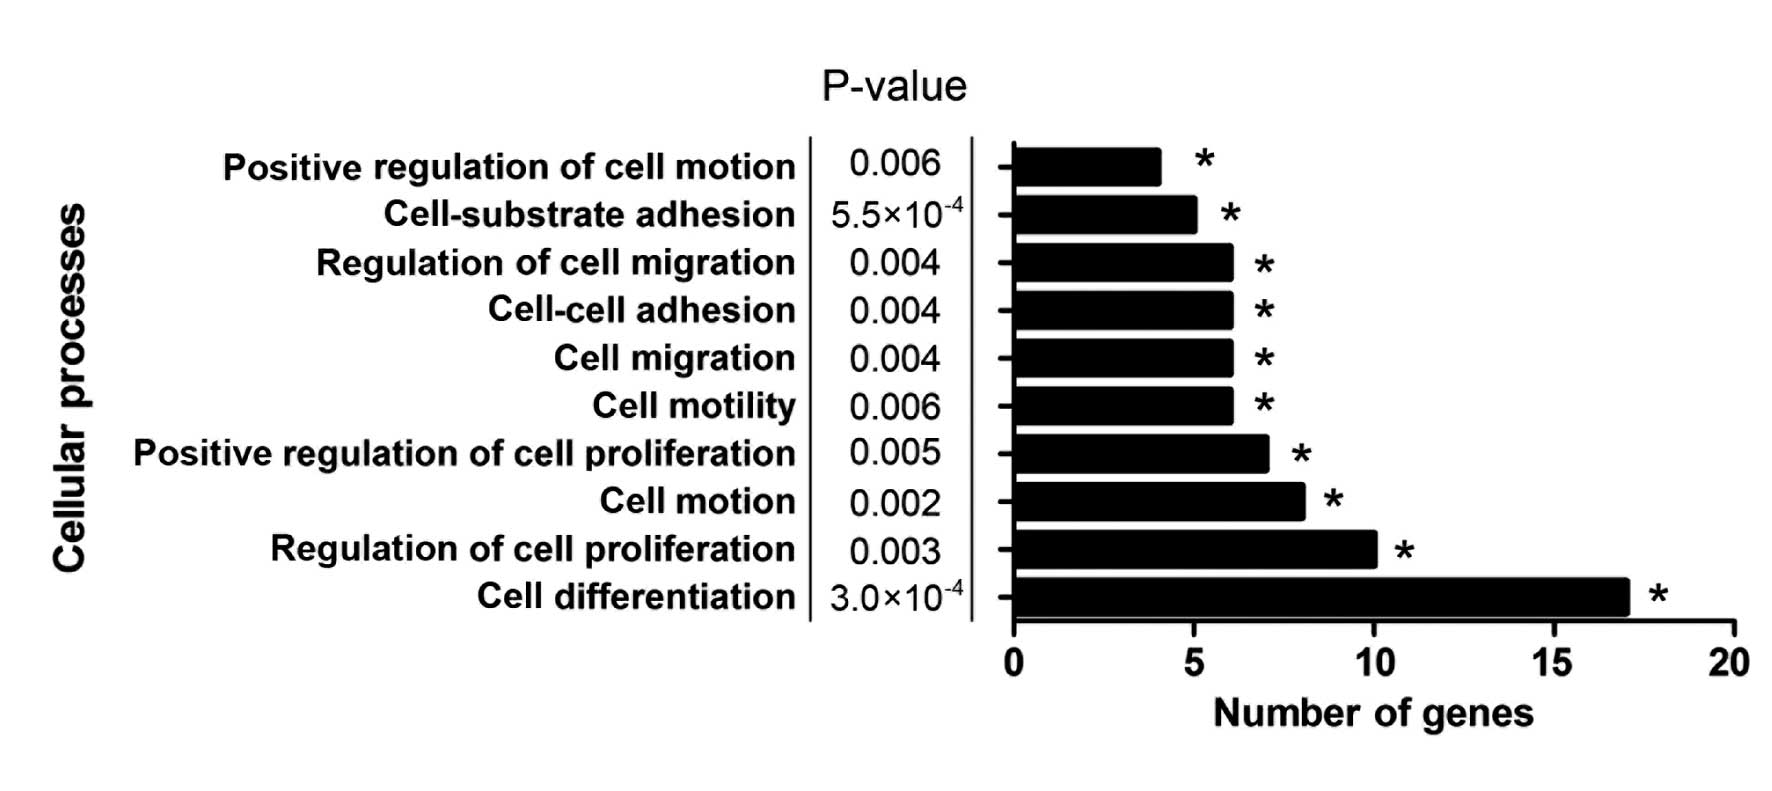
GO and pathway enrichment analysis of
COL6A3 co-expressed genes
GO and pathway enrichment analysis were conducted
using the DAVID functional annotation chart tool (16) to further analyze the underlying
mechanisms of COL6A3 and its co-expressed genes. In total, 36
biological process, seven cellular constituents, seven molecular
function terms and six Kyoto encyclopedia of genes and genomes
pathways were indicated to be significantly enriched (P<0.01;
Table III). The extracellular
matrix organization indicated the most marked enrichment among the
GO biological process terms. The predominant function of COL6A3 has
been identified to be the organization of matrix components, which
supported the reliability of the present analysis. Furthermore,
cell processes, such as cell differentiation, cell-substrate
adhesion, regulation of cell proliferation, regulation of cell
migration, cell motion and cell migration, which are considered to
be cancer-related biological processes, were enriched (Fig. 2). This result indicated that COL6A3
may have been involved in the biological processes that promote the
progression of GC.
| Table IIIGO and pathway enrichment analysis of
COL6A3 co-expressed genes. |
Table III
GO and pathway enrichment analysis of
COL6A3 co-expressed genes.
| Category | Term | Function | Count | P-value | Fold
enrichment | FDR |
|---|
| GOTERM _BP_3 | GO:0030198 | ECM
organization | 11 |
5.88×10⁻¹² | 26.86738026 |
8.02×10⁻⁹ |
| GO:0048731 | System
development | 29 |
2.30×10⁻⁹ | 3.161608227 |
3.13×10⁻⁶ |
| GO:0048513 | Organ
development | 24 |
2.54×10⁻⁸ | 3.507740409 |
3.47×10⁻⁵ |
| GO:0009653 | Anatomical
structure morphogenesis | 19 |
2.42×10⁻⁷ | 4.032045523 |
3.30×10⁻⁴ |
| GO:0009888 | Tissue
development | 14 |
9.88×10⁻⁷ | 5.347765641 |
1.35×10⁻³ |
| GO:0022603 | Regulation of
anatomical structure morphogenesis | 7 |
1.89×10⁻⁴ | 8.119324546 |
2.57×10⁻¹ |
| GO:0030154 | Cell
differentiation | 17 |
3.01×10⁻⁴ | 2.637947926 |
4.10×10⁻¹ |
| GO:0051093 | Negative regulation
of developmental process | 7 |
4.64×10⁻⁴ | 6.865374809 |
6.31×10⁻¹ |
| GO:0031589 | Cell-substrate
adhesion | 5 |
5.47×10⁻⁴ | 12.96014632 |
7.43×10⁻¹ |
| GO:0051239 | Regulation of
multicellular organismal process | 12 |
7.52×−4 | 3.253176537 | 1.02 |
| GO:0048519 | Negative regulation
of biological process | 17 |
9.44×10⁻⁴ | 2.383179224 | 1.28 |
| GO:0050793 | Regulation of
developmental process | 10 |
9.95×10⁻⁴ | 3.768825934 | 1.35 |
| GO:0060348 | Bone
development | 5 |
1.28×10⁻³ | 10.32597024 | 1.73 |
| GO:0009887 | Organ
morphogenesis | 9 |
1.33×10⁻³ | 4.053492573 | 1.80 |
| GO:0006928 | Cell motion | 8 |
2.20×10⁻³ | 4.278212512 | 2.96 |
| GO:0042127 | Regulation of cell
proliferation | 10 |
2.90×10⁻³ | 3.227685742 | 3.88 |
| GO:0032101 | Regulation of
response to external stimulus | 5 |
3.27×10⁻³ | 7.988014715 | 4.36 |
| GO:0002683 | Negative regulation
of immune system process | 4 |
4.02×10⁻³ | 12.24187315 | 5.34 |
| GO:0009611 | Response to
wounding | 8 |
4.05×10⁻³ | 3.834247063 | 5.39 |
| GO:0030334 | Regulation of cell
migration | 5 |
4.06×10⁻³ | 7.515351122 | 5.40 |
| GO:0016477 | Cell migration | 6 |
4.13×10⁻³ | 5.522149303 | 5.49 |
| GO:0016337 | Cell-cell
adhesion | 6 |
4.13×10⁻³ | 5.522149303 | 5.49 |
| GO:0050865 | Regulation of cell
activation | 5 |
4.60×10⁻³ | 7.257681941 | 6.08 |
| GO:0008284 | Positive regulation
of cell proliferation | 7 |
5.02×10⁻³ | 4.295005013 | 6.64 |
| GO:0009790 | Embryonic
development | 8 |
5.90×10⁻³ | 3.577730534 | 7.75 |
| GO:0007566 | Embryo
implantation | 3 |
5.94×10⁻³ | 25.40188679 | 7.80 |
| GO:0044259 | Multicellular
organismal macromolecule metabolic process | 3 |
6.33×10⁻³ | 24.58247109 | 8.30 |
| GO:0040012 | Regulation of
locomotion | 5 |
6.37×10⁻³ | 6.615074686 | 8.34 |
| GO:0051272 | Positive regulation
of cell motion | 4 |
6.39×10⁻³ | 10.36811706 | 8.36 |
| GO:0040017 | Positive regulation
of locomotion | 4 |
6.39×10⁻³ | 10.36811706 | 8.36 |
| GO:0048870 | Cell motility | 6 |
6.46×10⁻³ | 4.964538135 | 8.46 |
| GO:0051270 | Regulation of cell
motion | 5 |
6.48×10⁻³ | 6.580799687 | 8.49 |
| GO:0048523 | Negative regulation
of cellular process | 14 |
8.98×10⁻³ | 2.142327802 | 11.57 |
| GO:0050867 | Positive regulation
of cell activation | 4 |
9.00×10⁻³ | 9.153833078 | 11.59 |
| GO:0009792 | Embryonic
development ending in birth or egg hatching | 6 |
9.13×10⁻³ | 4.563213196 | 11.76 |
| GO:0032844 | Regulation of
homeostatic process | 4 |
9.67×10⁻³ | 8.912942734 | 12.41 |
| GOTERM_CC_3 | GO:0031012 | ECM | 26 |
2.51×10⁻²⁶ | 19.52139523 |
2.54×10⁻²³ |
| GO:0005578 | Proteinaceous
ECM | 25 |
1.40×10⁻²⁵ | 20.23702331 |
1.41×10⁻²² |
| GO:0044420 | ECM part | 15 |
8.00×10⁻¹⁸ | 33.20947414 |
8.10×10⁻¹⁵ |
| GO:0005581 | Collagen | 10 |
5.53×10⁻¹⁵ | 74.00968523 |
5.62×10⁻¹² |
| GO:0005604 | Basement
membrane | 6 |
1.13×10⁻⁵ | 19.92568449 |
1.14×10⁻² |
| GO:0005615 | Extracellular
space | 12 |
4.49×10⁻⁵ | 4.537820116 |
4.55×10⁻² |
| GO:0005886 | Plasma
membrane | 25 |
3.82×10⁻³ | 1.71454791 | 3.80 |
| GO:0031252 | Cell leading
edge | 3 |
9.65×10⁻² | 5.631171702 | 64.22 |
| GOTERM_MF_3 | GO:0019838 | Growth factor
binding | 6 |
3.98×10⁻⁵ | 15.21982507 |
3.80×10⁻² |
| GO:0005518 | Collagen
binding | 4 |
3.06×10⁻⁴ | 29.59410431 |
2.92×10⁻² |
| GO:0005102 | Receptor
binding | 11 |
1.21×10⁻³ | 3.306790436 | 1.15 |
| KEGG_PATHWAY | hsa04512 | ECM-receptor
interaction | 14 |
1.41×10⁻¹⁶ | 28.25 |
9.99×10⁻¹⁴ |
| hsa04510 | Focal adhesion | 14 |
1.52×10⁻¹¹ | 11.80597015 |
1.35×10−08 |
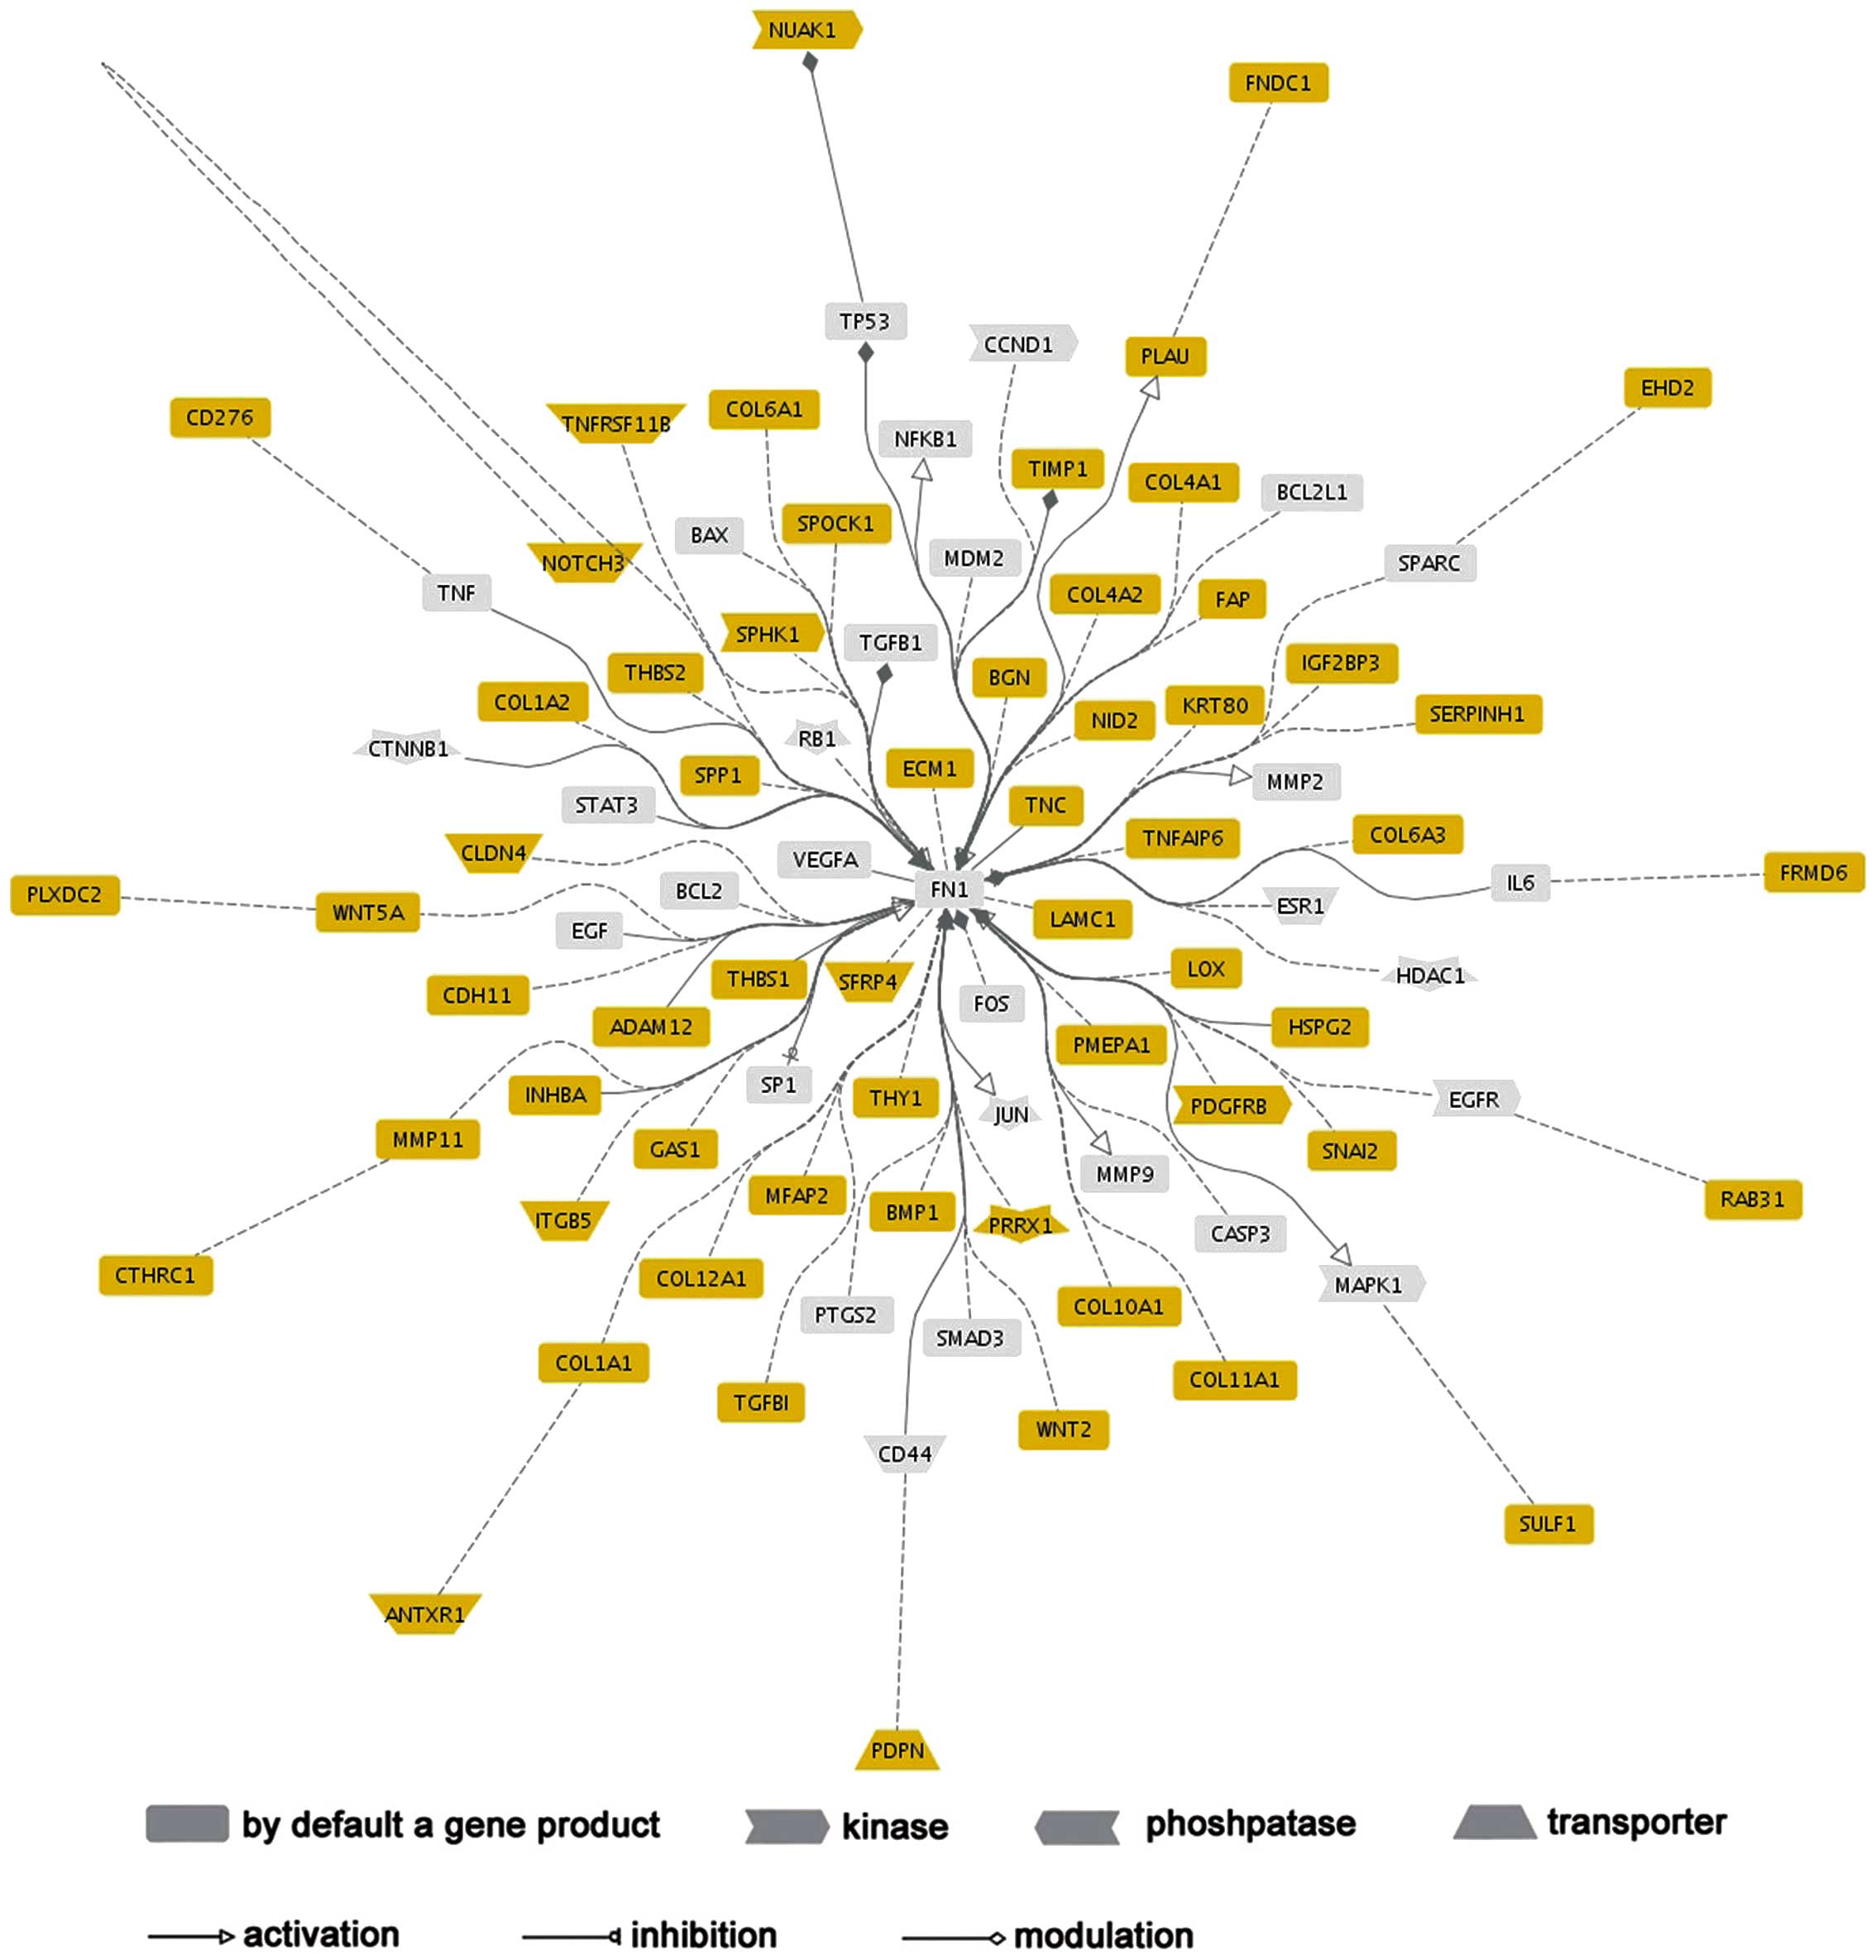
Network analysis of COL6A3
A network analysis was conducted using Genomatix
GePS to construct the functional connections of COL6A3 co-expressed
genes. FN1 was highlighted in this network, as it functionally
associated with 50 (81.9%) COL6A3 co-expressed genes, which
indicated that FN1 may act as a significant regulator in the
COL6A33 regulatory network (Fig.
3).
Discussion
COL6A3 is located on chromosome 2q37 and codes for
the α-3 chain, one of the three α-chains of type VI collagen. It is
hypothesized that COL6A3 accelerates cell anchoring and signaling
through its interaction with integrin (17) and disruption of this gene results in
muscular dystrophy (2). In addition
to integrin, COL6A3 interacts with other matrix components, such as
decorin, hyaluronan, heparan sulfate and NG2 proteoglycans
(18). Furthermore, COL6A3 may
promote neural crest cell migration and attachment, which is
significant in the later stages of neural crest development
(19).
Recently, COL6A3 has received increasing attention,
due to its abnormal expression and the occurrence of alternative
splicing in numerous types of cancer. Previous genome exon array
studies have identified cancer-specific alternative splicing of
exons 3, 4 and 6 of COL6A3 in colon, pancreatic, bladder and
prostate cancer (8,20). Furthermore, COL6A3 was identified to
be overexpressed in pancreatic (21) and ovarian cancer (7), which was associated with the poor
differentiation of tumor cells (5).
Although COL6A3 has been investigated in numerous other types of
cancer, its biological mechanisms and expression pattern in GC
remain unclear.
In the era of post-genomic medicine, microarray
meta-analysis has been demonstrated to be an effective strategy for
identifying gene expression changes in various types of cancer
(22,23). In the present study, a microarray
meta-analysis was performed to identify that COL6A3 was frequently
overexpressed in hepatocellular carcinoma tissues, indicating that
an increased expression of COL6A3 was associated with the
carcinogenesis of GC. The underlying mechanisms that result in the
increased expression of COL6A3 may relate to the transcriptional
regulation of transforming growth factor (TGF)-β (24), however, this requires further
investigation. To further define the biological mechanisms of
COL6A3, a co-expression analysis was conducted to investigate the
genes that are functionally related to, or co-regulated by, COL6A3.
This identified 62 co-expression genes for COL6A3, the majority of
which are involved in the processes of extracellular matrix
organization such as lysyl oxidase, collagen type IV α2,
TGF-β-induced and laminin γ1 (Table
II). The functional network analysis of these co-expression
genes was dominated by FN1, which demonstrated its predominant
functional connections with other genes. FN1 is an adhesive protein
of the extracellular matrix and it contains two apparently
identical subunits with a range of binding sites for cell surface
and extracellular ligands. It has been indicated that FN1 is
involved in various aspects of cancer-related biological processes,
such as cellular adhesion and migration. FN1 was identified to be
overexpressed in hepatocellular, gastrointestinal, head and neck
cancers (25,26), which indicated its involvement in
tumorigenesis. Furthermore, Waalkes demonstrated that
advanced-stage renal cancer patients exhibited increased FN1
expression when compared with patients exhibiting organ-confined
diseases (27). Thus, the present
study provided a mechanistic insight into the role of COL6A3 in
GC.
In conclusion, the present study indicated that
COL6A3 was regularly overexpressed in GC cells. A list of potential
partner genes of COL6A3 was generated, the majority of which are
involved in cancer-related processes, and a functional network of
COL6A3 was constructed, which provided promising results to enable
future studies to identify the precise role of COL6A3.
References
|
1
|
Jemal A, Bray F, Center MM, Ferlay J, Ward
E and Forman D: Global cancer statistics. CA Cancer J Clin.
61:69–90. 2011. View Article : Google Scholar
|
|
2
|
Bönnemann CG: The collagen VI-related
myopathies: muscle meets its matrix. Nat Rev Neurol. 7:379–390.
2011.PubMed/NCBI
|
|
3
|
Iyengar P, Espina V, Williams TW, et al:
Adipocyte-derived collagen VI affects early mammary tumor
progression in vivo, demonstrating a critical interaction in the
tumor/stroma microenvironment. J Clin Invest. 115:1163–1176. 2005.
View Article : Google Scholar
|
|
4
|
Schäffler A, Schölmerich J and Buechler C:
Mechanisms of disease: adipokines and breast cancer - endocrine and
paracrine mechanisms that connect adiposity and breast cancer. Nat
Clin Pract Endocrinol Metab. 3:345–354. 2007.
|
|
5
|
Sherman-Baust CA, Weeraratna AT, Rangel
LB, et al: Remodeling of the extracellular matrix through
overexpression of collagen VI contributes to cisplatin resistance
in ovarian cancer cells. Cancer Cell. 3:377–386. 2003. View Article : Google Scholar
|
|
6
|
Aumailley M, Mann K, von der Mark H and
Timpl R: Cell attachment properties of collagen type VI and
Arg-Gly-Asp dependent binding to its alpha 2(VI) and alpha 3(VI)
chains. Exp Cell Res. 181:463–474. 1989. View Article : Google Scholar
|
|
7
|
Ismail RS, Baldwin RL, Fang J, Browning D,
Karlan BY, Gasson JC and Chang DD: Differential gene expression
between normal and tumor-derived ovarian epithelial cells. Cancer
Res. 60:6744–6749. 2000.
|
|
8
|
Thorsen K, Sørensen KD, Brems-Eskildsen
AS, et al: Alternative splicing in colon, bladder, and prostate
cancer identified by exon array analysis. Mol Cell Proteomics.
7:1214–1224. 2008. View Article : Google Scholar
|
|
9
|
Rhodes DR, Yu J, Shanker K, et al:
Large-scale meta-analysis of cancer microarray data identifies
common transcriptional profiles of neoplastic transformation and
progression. Proc Natl Acad Sci USA. 101:9309–9314. 2004.
View Article : Google Scholar
|
|
10
|
Xing C, Zhou W, Ding S, et al: Reversing
effect of ring finger protein 43 inhibition on malignant phenotypes
of human hepatocellular carcinoma. Mol Cancer Ther. 12:94–103.
2013. View Article : Google Scholar
|
|
11
|
Chen X, Leung SY, Yuen ST, et al:
Variation in gene expression patterns in human gastric cancers. Mol
Biol Cell. 14:3208–3215. 2003. View Article : Google Scholar : PubMed/NCBI
|
|
12
|
Cho JY, Lim JY, Cheong JH, et al: Gene
expression signature-based prognostic risk score in gastric cancer.
Clin Cancer Res. 17:1850–1857. 2011. View Article : Google Scholar : PubMed/NCBI
|
|
13
|
D’Errico M, de Rinaldis E, Blasi MF, et
al: Genome-wide expression profile of sporadic gastric cancers with
microsatellite instability. Eur J Cancer. 45:461–469.
2009.PubMed/NCBI
|
|
14
|
Wang Q, Wen YG, Li DP, et al: Upregulated
INHBA expression is associated with poor survival in gastric
cancer. Med Oncol. 29:77–83. 2012. View Article : Google Scholar : PubMed/NCBI
|
|
15
|
Fierro AC, Vandenbussche F, Engelen K, Van
de Peer Y and Marchal K: Meta analysis of gene expression data
within and across species. Curr Genomics. 9:525–534. 2008.
View Article : Google Scholar
|
|
16
|
Huang da W, Sherman BT and Lempicki RA:
Systematic and integrative analysis of large gene lists using DAVID
bioinformatics resources. Nat Protoc. 4:44–57. 2009.PubMed/NCBI
|
|
17
|
Pfaff M, Aumailley M, Specks U, Knolle J,
Zerwes HG and Timpl R: Integrin and Arg-Gly-Asp dependence of cell
adhesion to the native and unfolded triple helix of collagen type
VI. Exp Cell Res. 206:167–176. 1993. View Article : Google Scholar : PubMed/NCBI
|
|
18
|
Burg MA, Tillet E, Timpl R and Stallcup
WB: Binding of the NG2 proteoglycan to type VI collagen and other
extracellular matrix molecules. J Biol Chem. 271:26110–26116. 1996.
View Article : Google Scholar : PubMed/NCBI
|
|
19
|
Perris R, Kuo HJ, Glanville RW and
Bronner-Fraser M: Collagen type VI in neural crest development:
distribution in situ and interaction with cells in vitro. Dev Dyn.
198:135–149. 1993. View Article : Google Scholar : PubMed/NCBI
|
|
20
|
Gardina PJ, Clark TA, Shimada B, et al:
Alternative splicing and differential gene expression in colon
cancer detected by a whole genome exon array. BMC Genomics.
7:3252006. View Article : Google Scholar : PubMed/NCBI
|
|
21
|
Arafat H, Lazar M, Salem K, et al:
Tumor-specific expression and alternative splicing of the COL6A3
gene in pancreatic cancer. Surgery. 150:306–315. 2011. View Article : Google Scholar : PubMed/NCBI
|
|
22
|
Smith DD, Saetrom P, Snøve O Jr, Lundberg
C, Rivas GE, Glackin C and Larson GP: Meta-analysis of breast
cancer microarray studies in conjunction with conserved
cis-elements suggest patterns for coordinate regulation. BMC
Bioinformatics. 9:632008. View Article : Google Scholar
|
|
23
|
Rybaczyk LA, Bashaw MJ, Pathak DR and
Huang K: An indicator of cancer: downregulation of monoamine
oxidase-A in multiple organs and species. BMC Genomics. 9:1342008.
View Article : Google Scholar
|
|
24
|
Verrecchia F, Chu ML and Mauviel A:
Identification of novel TGF-beta/Smad gene targets in dermal
fibroblasts using a combined cDNA microarray/promoter
transactivation approach. J Biol Chem. 276:17058–17062. 2001.
View Article : Google Scholar : PubMed/NCBI
|
|
25
|
Torbenson M, Wang J, Choti M, Ashfaq R,
Maitra A, Wilentz RE and Boitnott J: Hepatocellular carcinomas show
abnormal expression of fibronectin protein. Mod Pathol. 15:826–830.
2002. View Article : Google Scholar : PubMed/NCBI
|
|
26
|
Warawdekar UM, Zingde SM, Iyer KS,
Jagannath P, Mehta AR and Mehta NG: Elevated levels and fragmented
nature of cellular fibronectin in the plasma of gastrointestinal
and head and neck cancer patients. Clin Chim Acta. 372:83–93. 2006.
View Article : Google Scholar : PubMed/NCBI
|
|
27
|
Waalkes S, Atschekzei F, Kramer MW, et al:
Fibronectin 1 mRNA expression correlates with advanced disease in
renal cancer. BMC Cancer. 10:5032010. View Article : Google Scholar : PubMed/NCBI
|