Introduction
An estimated 386,300 new cases and 150,200
fatalities from bladder cancer (BC) occurred worldwide in 2008
(1). BC has a number of known risk
factors, including age, cigarette smoking, exposure to chemicals,
chronic infections or irritations and exposure to pelvic radiation.
However, numerous patients with BC have no history of exposure to
carcinogens (2). The identification
of genetic events during tumorigenesis may lead to an understanding
of the genetic mechanism underlying BC.
In total, ~75% of patients present with superficial
disease (Ta and T1) and 20% with T2 or higher disease. Overall, 70%
of treated tumors recur, with 30% of recurrent tumors progressing
to metastatic disease of the non-muscle-invasive lesions.
Approximately 10% of low-grade (LG) papillary tumors subsequently
develop muscle-invasive or metastatic cancer, whereas roughly a
third of high-grade (HG) tumors progress, if not already, to
muscle-invasive at the time of diagnosis (3). Therefore, the determination of the
ideal biomarkers for predicting progression to invasion or
metastatic disease is important.
The molecular and genetic changes in urothelial
carcinoma (UC) of the bladder are grouped into three processes: i)
Chromosomal alteration, which activates the initial carcinogenic
event; ii) tumor proliferation, due to a loss of cell-cycle
regulation and derangements in normal apoptotic turnover; and iii)
metastasis, which involves the initial tumor migration and other
processes, including angiogenesis and loss of cell adhesions
(4). Since studies have revealed
the association between genetic changes and BC, numerous genes have
been studied for their connection to BC (5–7). It is
known that p53 plays a key role in the regulation of the cell
cycle, and mutations in p53 result in chromosomal instability.
Alterations in the p53 gene are more frequently observed in
invasive HG tumors compared with LG tumors (6). The cyclin-dependent kinase inhibitors
p21 and p16 are correlated with an increased disease recurrence and
progression. Additionally, the genesis and/or progression of BC has
been shown to be a consequence of genetic instability, and
chromosomes 3, 7, 9 and 17 are frequently involved in uroepithelial
oncogenesis (8,9).
In the present study, cytogenetic methods and
fluorescence in situ hybridization (FISH) were used to
investigate the frequencies of chromosomal aberrations (CAs) and
alterations (amplifications and deletions) of the p53 and p16
genes, alone or in combination, in Turkish patients with BC. The
results were compared between cases of HGBC and LGBC.
Materials and methods
Patients
Between March 2009 and March 2010, following
approval of the study by the ethics committee of the Medical
Faculty of Çukurova University (Adana, Turkey), blood and tissue
samples were collected from 34 patients with BC. Written informed
consent was obtained from all patients. Tissue samples were removed
by transurethral resection or from radical cystectomy specimens,
and blood samples were drawn simultaneously during these surgical
procedures. A small piece of the tumor sample was obtained for
genetic study. The remainders of the tissue samples were evaluated
in the Department of Pathology, Çukurova University (Adana, Turkey)
by the same pathologist. Structural and numerical abnormalities of
chromosomes were detected in the blood and tissue samples from
patients with BC by cytogenetic methods. The blood samples from 34
healthy patients were collected and analyzed as the control group.
The p16 and p53 genes were also identified in the bladder tumor
samples using FISH. The numbers of CAs, including deletion,
amplification, fragility, chromosome break, chromatin break and
translocation, were compared among the patient and control groups.
The patients with BC were divided into two groups: LG and HG. This
was performed according to the histopathological type of tumors
present, based on World Health Organisation histological criteria
(10). Subsequently, the two groups
were compared according to age, body mass index (BMI), smoking
history, number of chromosomal abnormalities and differences in p16
and p53 genes. Finally, the values were assessed using statistical
methods.
Cytogenetic examination
The peripheral blood from 34 patients was obtained
for culture and FISH studies. The expression of folate-sensitive
fragile sites (FSs) and cytogenetic abnormalities (CAs) in each
sample was examined in the genetic laboratory of the Department of
Medical Biology and Genetics, Faculty of Medicine, Çukurova
University. A 0.3-ml blood sample was incubated at 37°C for 72 h in
two types of media; RPMI-1640 (Sigma-Aldrich, St. Louis, MO, USA)
and M199 without folic acid (Biological Industries Israel
Beit-Haemek, Ltd., Kibbutz Beit-Haemek, Israel). Standard
cytogenetic techniques were used for harvesting and slide
preparation. The slides were first stained only with Giemsa prior
to the examination to avoid missing any gaps. For a detailed
analysis of the FSs, a few slides were prepared by GTG-banding, and
50 metaphases were scored for each assay. A CA was defined when it
was present in 1% of the cells analyzed and in ≥50% of the
individuals studied (11). All gaps
and breaks were recorded and localized according to the
International System for Human Cytogenetic Nomenclature (1995)
(12). The classification of CAs
was carried out according to the nomenclature established in the
11th International Workshop on Human Gene Mapping (13).
Tumoral tissues
Bladder tumor samples were obtained from 32 patients
by transurethral resection or from radical cystectomy specimens.
All samples were mechanically minced and enzymatically
disaggregated by digestion with trypsin-EDTA (Biological Industries
Israel Beit-Haemek Ltd.) for 1 h. Following the digestion, BioAMF1
medium (Biological Industries Israel Beit-Haemek Ltd.) supplemented
with supplement, penicillin-streptomycin and gentamycin (all
Biological Industries Israel Beit-Haemek Ltd.) was used for
culture. A long-term cell culturing method was performed for
proliferation of tumor and normal cells. Once enough proliferation
(average, 10 days) had occurred, standard cytogenetic techniques
were used for harvesting and slide preparation. GTG-banding was
achieved by trypsin-Giemsa treatment. The karyotype was determined
by analyzing ≥25 metaphases from the normal and tumor bladder
epithelium cells for each individual patient. If there were not
enough metaphases observed, the slides were evaluated. For
eliminating inherited CAs, lymphocyte cultures were also performed
and 25 metaphases were counted for each patient.
Slide preparation and FISH analysis
Cytogenetic analysis of BC cells has remained
difficult as these cells have a risk of infection and limited
proliferative capacity in vitro, which precludes analysis by
metaphase cytogenetics. Therefore, interphase FISH was used to
study p53 and p16 genes in non-dividing cells. Standard cytogenetic
techniques were used for harvesting and preparation of slides for
FISH (14). To observe the p53 and
p16 genes, bladder tissues from 32 patients were examined by
interphase FISH. Poseidon Repeat-Free FISH Probe p16 (on chromosome
9p21/9q21) and Poseidon Repeat-Free FISH Probe p53 (on chromosome
17p13/SE 17) probes purchased from Kreatech Diagnostics (Amsterdam,
The Netherlands) were used.
Statistical analysis
Comparisons between groups were applied using
Student’s t-test and one-way analysis of variance for normally
distributed data. The Mann-Whitney U-test and Kruskal-Wallis test
were used to compare data that were not normally distributed. The
categorical variables between groups were analyzed using the
χ2 test. Results are presented as the mean ± standard
deviation and the median (range). P<0.05 was considered to
indicate a statistically significant difference. Statistical
analyses were performed using SPSS, version 18.0 (SPSS, Inc.,
Chicago, IL, USA).
Results
Demographic data of the patients
A total of 30 (88.2%) male and four (11.2%) female
patients with BC were recruited for the present study, with a mean
age of 60.6±14.2 years (range, 26–81 years). Histopathological
examinations revealed that 11 (32.3%) patients had LGUC, 22 (64.7%)
patients had HGUC and one (3%) patient had carcinoma in situ
(CIS). The patient with CIS was added to the HG-tumor group. The
mean values of age, BMI and smoking time for the LG-cancer group
were 58.9±18.51 years (range, 26–81 years), 25.5±3.51
kg/m2 (range, 22.2–32.5 kg/m2) and 20.6±15.8
packs/year (range, 0–40 packs/year), respectively. These same
parameters were calculated for the HG-cancer group as 61.5±12.03
years (range, 43–81 years), 28.1±4.73 kg/m2 (range,
20.5–37.8 kg/m2) and 25.5±16.94 packs/year (range, 0–60
packs/year) (Table I). There were
no statistically significant differences between the patients with
LG-UC or HG-cancer with regard to age, BMI and smoking time
(P=0.971, P=0.106 and P=0.561).
 | Table IDemographic data, p16 and p53
statuses, and blood and tissue culture results of the patients. |
Table I
Demographic data, p16 and p53
statuses, and blood and tissue culture results of the patients.
| P no. | Agea/gender | G | S | Tobacco
useb | p16 | p53 | RPMI | M199 | Tissue |
|---|
| P1 | 76/M | H | T3b | 20 | 22 del | 5 amp
20 del | gap(3p21) | 9qh+ ×3;fra(5q31);
chbr(14q?);hsr(2q?)x2;45? | 47,XY,+2×2;
45,XY,−1;92,XXYY |
| P2 | 57/M | L | T1 | 40 | 2 amp
4 del | 6 amp |
92,XXYYx3;fra(1q32);fra(6p21);
47,XY,+21;9qh+ ×2 |
92,XXYYx4;fra(7q?);45,XY,izo(Xq/p),−21 |
47,XY,+21;42,XY,−2,−11,−12,−22 |
| P3 | 61/M | H | T2a | 45 | 10 del | 15 del |
47,XX,+3p,+ace;45,XX,−14;44, X,−Y, −8;
45,XY,−16; 44,X,−Y,−18,−13,+12 |
45,XY,−16;45,XY,−8;chtb(1q11);
del(10)(q24-qter); 45,X–Y;chrb(2q31);
del(17)(q11-qter);45,XY,−22 |
43,Y,−11,−17,−X;45,XY,−19;45,X,−Y;
44,X,t(14;18)(p11;p11); 45,XY,−13 |
| P4 | 53/F | H | T1 | 0 | 16 del | 18 del | 9qh+ ×54
48,XX,+4,+21;45,XX−10; 46,XX,?15p+; inv(13)(p13;q14) | 9qh+
×2;44,XX,−12,−21;chbr(4q?); fra(Xq26); 15p+x52; 45,X,−X; 9qh+x2;
15p+,fra(3p25)x2;15p +,chtbr(3p21)x2; fra(12p13); fra(3p21) |
46,XX,+17,−20,9qh+;gap(6q15); gap(5q31)
×2; del(3)(p23-pter) |
| P5 | 77/M | L | T1 | 0 | 3 del | 3 del | no cultered | no cultered | no cultered |
| P6 | 81/M | L | T1 | 2 | 10 del | 13 del | 9qh+
×2;fra(4q33);43,X,−1,−10,−Y;45, XY,−17; 44,XY,−21,−22;43,Y,9qh+,
−22[2],−X | 92,XXYYx2;9qh+
×2;45,X,−Yx2;45,XY,−20; 44,XY,−3,−18;del(5)(p14-pter),del(X)
(p21-pter); chtbr(2q23);chtbr(3p21.3), chtbr(5p13) | no cultered |
| P7 | 42/M | L | T1 | 25 | 5 del | 5 del | 45,X-Y ×2;45,XY, −10;
del(9)(q12-qter) |
del(7)(q11–q12);del(3)(p25-pter);del(5)(q13–q15);
45,XY,−22;chtb(3q26.2);chtb(12q13) | 45,X,−Y |
| P8 | 73/M | H | T3b | 30 | 16 del | 10 del
3 amp |
fra(1p36);del(1)(q41-qter);45,XY,−17;
hsr(3q11–q13); 45,XY,−3 | far(Xp22.1);
t(14;22)(q32;q11.2);45,XY, del(17) (q21-qter),−19 | 47,XYY;
47,XX,+ace |
| P9 | 73/M | H | T1 | 60 | 9 del | 12 del | 92,XXYY |
45,XY,−22×2;45,XY,gap(1q21)x2,−18;del(13)
(q32-qter);9qh+ |
45,XY,−17;44,XY,−12,−20;
45,X,−Y;chtb(2p15) |
| P10 | 53/M | H | T4a | 40 | 18 del | 10 del | 45,XY,−21;
44,XY,−5,−17 | 45,XY, chtb(5q15),
−18 | 92, XXYY |
| P11 | 38/M | L | T1 | 10 | 9 del | 12 del | 46,XYY,−22; 45,XY,−D
47XY, (?); 45,XY,−14 | 46,XY, fra(1p36.1);
45,XY, −22; 47,XXY; chbr(9q32); del(3)(p13–p14) |
chtb(3q26.2);chtb(12q13) |
| P12 | 79/M | L | Ta | 0 | 2 del | 5 del | 46,XY,−10, +3 | 46,XY,fra(3p25);
45,XY,−3 | 45,XX,−21 |
| P13 | 74/F | H | T1 | 32 | 8 del | 5 del | 45,XX,−12 |
45,XX,−11×2;48,XX,+15,+16[2],−12;45,XX,−8;
45,XX,−4,−10;43,XX,+15,−8,−10,−19,−21 |
92,XXXX;92,XXYY;47,XY,+14 |
| P14 | 50/M | CIS | Tis | 30 | 23 del | 18 del | 44,XY,−17,−20;
45,XY,−22 |
45,XY,−8;47,XY,+mar;chtb(3p21.2);
chtb(11q13.4) | no cultered |
| P15 | 26/M | L | Ta | 20 | 15 del | 22 del | 45,XY,−22;
45,XY,−8;45,XY,−10; chtb(5q33) |
45X,−Y;47,XY,+mar;44,XY,−21,−22;45,XY,−19 |
45,X,−Yx6;45,X,+4q+,−Y; 43,X,−6,
−8,−Y;43,X,−18,−20,−Y; 92,XXYY |
| P16 | 81/M | H | T1 | 0 | 8 del | 10 del | 45,XY,−22 ×2;
47,XY, +mar |
45,XY,gap(6q23),−14;fra(5q31);fra(2q35);
45,XY, gap(4q27),−Y; 47,XY,+4;45,XY;fra(Xq13), −22; fra(5q31);
fra(12q22); fra(Xq26); 45,XY,−15; 45,XY,−22;43,X,−Y,−7,−18;
fra(5q31) |
del(X)(q21-qter);fra(12q24); del(9)
(q22-qter) |
| P17 | 51/M | L | T1 | 20 | 9 del | 6 del | Yq+;
chrb(4q31) |
47,XY,+21;del(14)(q11.2-pter);fra(11q23);45,XY,−19 | no cultered |
| P18 | 56/M | L | T1 | 35 | 4 del | 3 del |
44,XY,−18,−21;43,XY,−15,−18,−19;45,
XY,−21; chrb(8q22);inv(9)(p11;q12)x3; del(2)(p23-pter) |
del(5)(q31-qter);45,X,−8,−9,−Y,+21;47,XY,?+(p);
45,XY,del(1)(p32-pter),−19;del(1)(p24-pter); chrb(8q23);
45,XY,−19 | no cultered |
| P19 | 44/M | H | T3b | 0 | 9 del
3 amp | 6 del
8 amp | t(2;5)(p25;q14);
gap(2q23); gap(2q35); gap(4q31.3), gap(5q31); gap(1q36.1);
gap(5q31) |
45,XY,t(13;22)(p11;p11);45,XY,del(9)(q22-qter),−21;
del(2)(p24-pter);t(12;17)(p13;q12);45,XY,−8; 45,XX, −21×2 | no cultered |
| P20 | 60/F | H | T2a | 0 | 3 del | 2 del |
47,XX,+mar;del(1)(q32-qter);chtb (2q32.2);
45,XX,−22; chtb(4q31) |
t(3;12)(p26;q15);del(10)(q23-qter);
47,XXX; del(3)(q11-qter); 47,XX,+ace |
15p+x10;47,XXX,15p+;mar(10<);
chtb(12q14) |
| P21 | 55/M | H | T1 | 25 | 16 del | 10 del |
45,XY,−22;44,XY,−13,−22;44,XY,−7,
−22;45,XY,−13; 45,XY,−16 |
t(10;14)(q26;q13);47,XY,+15;del(2)
(p13-pter);44, XY,+21,−13 |
92,XXYYx13;92,XXYY,t(19;19) (q13.4;q13.4),
t(21;22)(p13;p13); 45, XY,−14; 92,XXYY, t(21;22)XY,
−(p13;p13),t(7;15)(p22;q26);45,22; 43,XYY,−2,−4,−8,−15;45,XY,−12;
44,XY,−4,−14 |
| P22 | 65/M | H | T4 | 15 | 12 del | 16 del |
fra(2q21);chtb(19q13);44,XY,chbr
(2q31),−2×2 |
47,XY,+ace;48,XY,+1,+19,+22;chtb(1q21)(q32) |
69,XXYx2;92,XXYYx2;45,XY, −20;chtb(2p15);
45,X,−Y |
| P23 | 65/M | L | T1 | 40 | no tissue | no tissue | 46,XY |
45,XY,−14;45,XY,−8;chtb(5q33) | no cultered |
| P24 | 49/M | H | T1 | 30 | no tissue | no tissue | 16qh+ ×14 |
47,XY,+ace;fra(9q32) | no cultered |
| P25 | 46/M | H | T2a | 30 | 12 del | 7 del | no cultered | 46,XY | 46,XY |
| P26 | 76/M | L | T1 | 35 | 0 | 2 del | 46,XY | 45,XY,−17×7 | no cultered |
| P27 | 72/M | H | T4a | 45 | 17 del | 14 del | 45.X,−Y;chbt
(5q33) |
45,XY,−8,11p+;47,XY,+21;fra(1q32)x2;
fra(1q42); fra(1q22) | no cultered |
| P28 | 72/M | H | T3b | 20 | 21 del | 18 del |
47,XY,+ace;fra(2q33);fra(2q31);fra
(3p21);fra(6p21)x2; fra (1q21)x4;22p+x4 |
45,X,−Y;46,XY,−11,+mar,del(11)(q?);
fra(6q23), fra(12q22); fra(2p23) | no cultered |
| P29 | 49/M | H | T1 | 35 | 14 del | 8 del | 45,XY,−22;
42,? |
45,XY,−9;45,XY,−10;chtb(5q33) | 44,XY,−3,−21 |
| P30 | 79/F | H | T1 | 0 | 9 del
3 amp | 5 del
4 amp | inv(9)(p11;q13)
×50;45,X ×40; t(7;14)(p15;q24) | inv(9)(p11;q13)
×50;45,X ×40; chtb(16q22) | no cultered |
| P31 | 43/M | H | T1 | 20 | 0 | 0 |
45,XY,−10;43.X,−21,−Y;45,XY,−21;
45.X,−Y |
45,XY,−20;45,X,−Yx2;45,XY,−21 | no cultered |
| P32 | 69/M | H | T2a | 30 | 13 del | 12 del | 46,XY | 46,XY | no cultered |
| P33 | 63/M | H | T2a | 45 | 16 del | 21 del | chtb(17p11); hsr
(2q22) ×3 | no cultered | no cultered |
| P34 | 54/M | H | T3a | 35 | 12 del | 15 del | 46,XY | no cultered | no cultered |
According to the tumor-node-metastasis
classification, there were three (8.8%) patients in the Ta stage,
17 (50%) in T1, five (14.7%) in T2a, one (2.9%) in T3a, four
(11.8%) in T3b, three (8.8%) in T4a and one (2.9%) in Tis
stage.
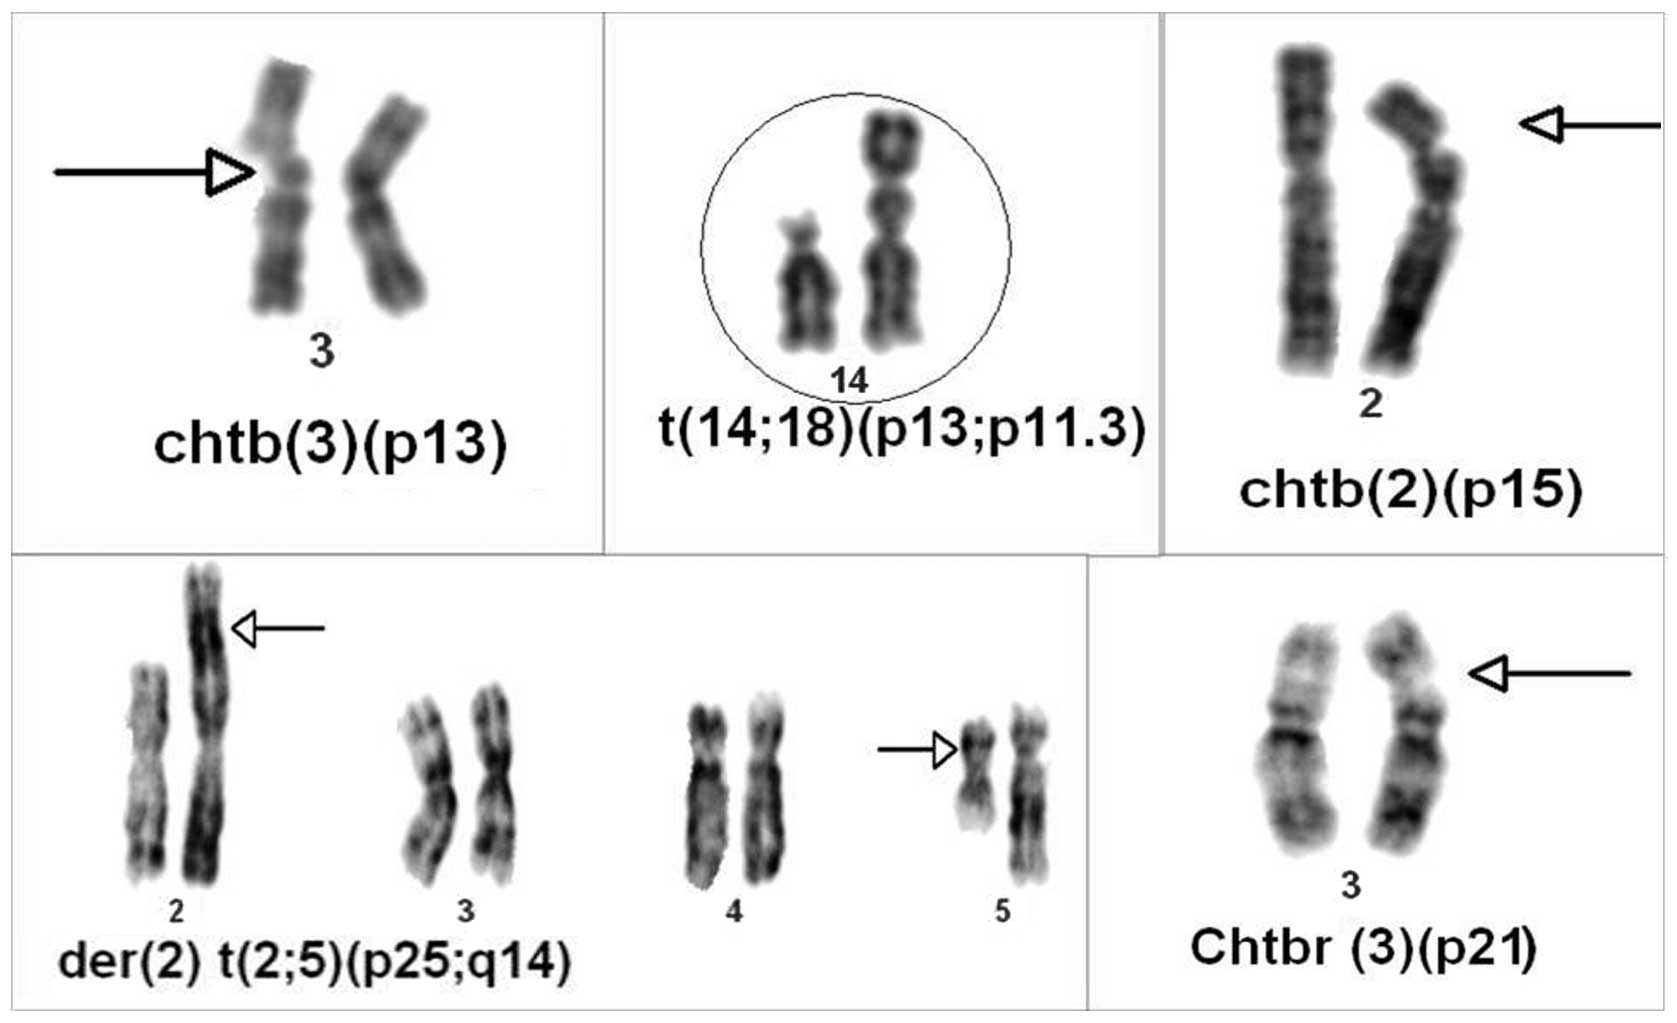
Cytogenetic findings
CAs were identified in 576 (24.6%) of the 2,344
cells analyzed in peripheral blood [363 (15.5%) and 213 (9.1%) of
the cells had structural and numerical aberrations, respectively],
and 62 (19.5%) of the 318 cells analyzed in tumoral tissues [24
(7.5%) and 38 (11.9%) of the cells had structural and numerical
aberrations, respectively]. Structural aberrations predominated and
usually consisted of deletions, translocations, breaks and
fragilities in various chromosomes. In particular, deletions in
1p24-pter, 1p32-pter, 1q41-qter, 1q32-qter, 2p13-pter, 2p23-pter,
2p24-pter, 3p13-p14, 3p23-pter, 3p25-pter, 3q11-qter, 5p14-pter,
5q13-q15, 5q31-qter, 7q11-q12, 9q12-qter, 9q22-qterx2, 10q23-qter,
10q24-qter, 11q?, 13q32-qter, 14q11.2-pter, 17q11-qter, 17q21-qter
and Xp21-pterx2; translocations between t(2;5)(p25;q14),
t(3;12)(p26;q15), t(7;15)(p22;q26), t(7;14)(p15;q24),
t(10;14)(q26;q13), t(12;17)(p13;q12), t(13;22)(p11;p11),
t(14;22)(q32;q11.2), t(19;19)(q13.4;q13.4) and t(21;22)(p13;p13)
×2; and inversions in izo(Xq/p) and inv(13)(p13;q14) were more frequently
observed. In patient 30, inversion of chromosome 9 [inv(9)(p11;q13)] was found in the blood
(Table I, Fig. 1). Autosomal monosomies were observed
as common findings (chromosomes X, Y, 22, 21, 17 and 8; and
trisomies 21, Y, 4 and 15). In the control group, chromosomal
aberrations were only found in 33 (2.6%) of 1,250 analyzed cells.
The mean number of chromosomal abnormalities in patients with BC
compared with the healthy control group was 20±36.2 (range, 0–182)
and 1.3±1.6 (range, 0–5), respectively, and the difference between
these values was significant (P=0.0001). Also, chromosomal
abnormalities were overviewed and compared between the two groups
(HG and LG) and almost all of the structural abnormalities found at
1q21, 1q32, 3p21 and 5q31 were detected in patients with HG tumors.
Other structural abnormalities were found not only in patients with
HG tumors but also in patients with LG tumors.
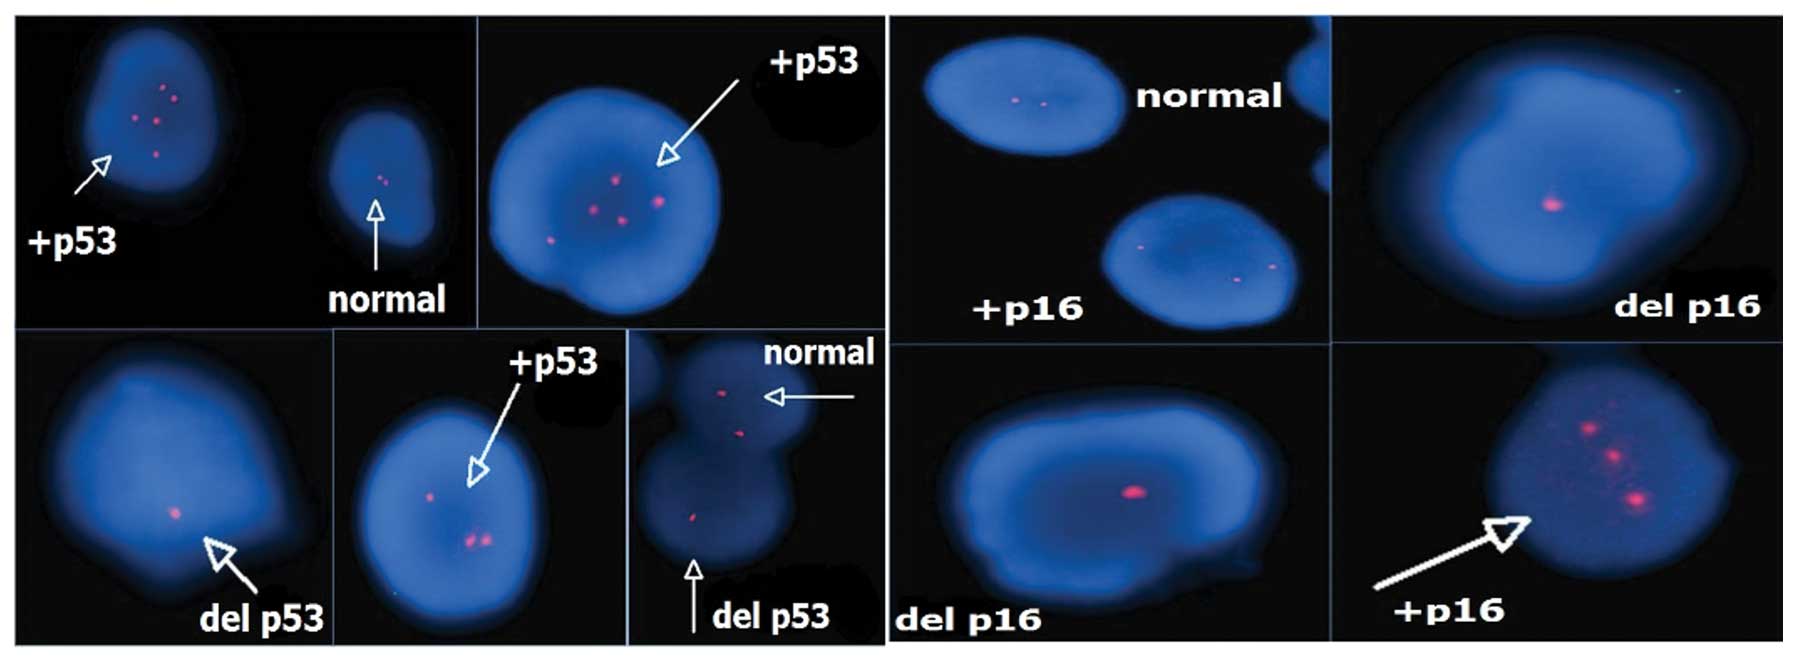
FISH findings
A total of 32 patients with multiple copies of the
p53 and p16 signals were identified by an interphase FISH screening
program using the Poseidon probe. A genetic alteration
(amplification and mostly deletion) of p16 was observed in
6.30±4.47 cells (range, 0–60 cells) in the LG group and in
13.8±5.65 cells (range, 0–23 cells) in the HG group, and the
difference was significant (P=0.002). Similarly, an alteration
(amplification and mostly deletion) of p53 was detected in 7.7±6.21
cells (range, 0–23 cells) in the LG group and 12.4±5.99 cells
(range, 0–25 cells) in the HG group, and these differences were
also significant (P=0.039). When the cut-off value of 10 altered
cells was considered, 19 patients had a positive result for p16 and
17 of these 19 patients had a HG tumor [odds ratio, 13.6; 95%
confidence interval (CI), 2.2–85.8]. In addition, 19 patients had a
positive result with the same cut-off value for p53, and 16 of
these 19 patients had a HG tumor (odds ratio, 6.22; 95% CI,
1.2–32.2) (Table I, Fig. 2).
Although the number of chromosomal abnormalities was
higher in the HG group compared with the LG group [23.26±43.19
(range, 0–182) vs. 12.5±4.89 (range, 4–18)], this difference was
not significant (P=0.714). However, when the changes of the p16 and
p53 genes specifically are considered, these differences were
significant (P=0.002 and P=0.039) (Table I).
When all patients were considered, the majority of
structural abnormalities were observed on chromosomes 1, 2, 3, 5
and 9, and the majority of numerical abnormalities were observed on
chromosomes 8, 17, 21, 22, X and Y. The regions of 1p24–36, 1q21,
1q32, 2q31, 3p21, 3p25–26, 4q31, 5q31, 5q33, 6p21 and 9p-q were
detected as being the most affected areas (Table I).
Discussion
In the present study, the risk factors of age, BMI
and smoking time were compared between LGBC and HGBC patient
groups. There were no statistically significant differences between
the two groups in terms of these factors. Associations between HGBC
and older age and longer smoking time were predicted, but no
significant differences were found. This may be due to the small
study population.
BC is a multistep and complex genetic process and
mainly presents as one of two distinct tumor entities: Genetically
stable LG tumors and genetically unstable HG tumors (15). While LG tumors are less aggressive,
HG tumors can be highly aggressive (6). In the present study, the mean number
of chromosomal abnormalities in patients with BC was significantly
higher compared with the control group (P=0.0001). In addition,
chromosomal abnormalities were detected more frequently in HG
tumors compared with LG tumors, but the difference was not
significant (P=0.714). Chromosomal abnormalities are more
frequently detected in higher-stage than lower-stage BC (16). This means that genetic changes are
necessary for the development of cancer and that there is a linear
correlation between the aggressiveness of the tumor and the genetic
aberrations present.
The 1p24, 1p36, 1q21 and 1q32 regions on chromosome
1 were identified as being the most affected areas in all patients
with BC. However, the 1q21 and 1q32 regions were found to be
affected more prominently in patients with HGBC compared with LGBC
(Table II). A study by Tommasi
et al (17) isolated the
NORE1 gene at 1q32.1 that is homologous to the tumor suppressor
gene RASSF1A, and advocated that this gene may be involved with the
signal transmission of Ras or Ras-like proteins. Caramazza et
al (18) reported that specific
genes located at 1q21 were associated with myeloproliferative
neoplasms, and that this region may contain oncogenes or tumor
suppressor genes. According to the results of the present study,
the 1q21 and 1q32 regions may contain certain oncogenes or tumor
suppressor genes that play a significant role in the development of
invasive BC.
| Table IIComparison of structural and
numerical abnormalities for each chromosome in low and high-grade
bladder cancers. |
Table II
Comparison of structural and
numerical abnormalities for each chromosome in low and high-grade
bladder cancers.
| Chrom. no. | Structural
abnormalities | Numerical
abnormalities |
|---|
|
|
|---|
| Location
(ratio) | Low grade | High grade |
|---|
|
|
|
|---|
| Low grade | High grade | n | Ratio | n | Ratio |
|---|
| 1 | 1p24(1/50),
1p32(1/50), 1p36.1(1/50), 1q32 (1/27) | 1p36(1/50),
1q11(1/50), 1q21(7/150), 1q22(1/100), 1q32(4/174), 1q36.1(1/50),
1q41(1/50), 1q42(1/100) | 1 | (1/32) | 2 | (2/69) |
| 2 | 2p23 (1/50),
2q23(1/50) | 2p13(1/50),
2p15(2/80), 2p23(1/50), 2p24(1/50), 2p25(1/50), 2q21(1/50),
2q22(3/100), 2q23(1/50), 2q31(3/150), 2q32.2(1/24), 2q33(1/50),
2q35(2/105), 2q?(2/50) | 1 | (1/12) | 4 | (4/105) |
| 3 | 3p13(1/50),
3p21.3(1/50), 3p25(2/100), 3q26.2(2/60) | 3p21(6/261),
3p23(1/50), 3p25(2/52), 3p26(1/30), 3q11(1/50),3q11(1/30),
+3p(1/50) | 3 | (3/103) | 2 | (2/60) |
| 4 | 4q31(1/6),
4q33(1/32), +4q(1/14) | 4q27(1/55),
4q31.3(2/74), 4q(1/52) | 0 | - | 5 | (5/234) |
| 5 | 5p13(1/50),
5p14(1/50), 5q13(1/50), 5q31(1/50), 5q33(2/63) | 5q15(1/10),
5q31(8/365), 5q33(2/35) | 0 | - | 1 | (1/10) |
| 6 | 6p21(1/27) | 6p21(2/50),
6q15(1/50), 6q23(2/105) | 1 | (1/14) | 0 | (0/0) |
| 7 | 7q11(1/50),
7q?(1/32) | 7p15(1/50),
7p22(1/36) | 0 | - | 2 | (2/105) |
| 8 | 8q23(1/50),
8q22(1/50) | | 4 | (4/127) | 8 | (8/449) |
| 9 | 9p11(3/50),
9q12(1/50), 9q32(1/50), 9qh+(6/109) | 9p11(100/100),
9q22(2/60), 9q32(1/60), 9qh+(64/358) | 1 | (1/50) | 1 | (1/10) |
| 10 | | 10q23(1/30),
10q24(1/50), 10q26(1/50) | 4 | (4/138) | 4 | (4/170) |
| 11 | 11q23(1/22) | 11q?(1/50),
11q13.4(1/57) | 1 | (1/12) | 4 | (4/123) |
| 12 | 12q13(2/60) | 12p13(2/102),
12q14.1(1/50), 12q22(2/105), 12q24(1/10) | 1 | (1/12) | 6 | (6/257) |
| 13 | | 13p13(1/54),
13q32(1/52) | 0 | - | 5 | (5/220) |
| 14 | 14q11.2(1/22) | 14q32(1/50),
14q?(1/50) | 2 | (2/40) | 5 | (5/194) |
| 15 | | 15p+(68/218) | 1 | (1/50) | 5 | (5/247) |
| 16 | | 16q22(1/50),
16qh+(14/14) | 0 | - | 4 | (4/203) |
| 17 | | 17p11(2/150),
17q21(1/25) | 8 | (8/39) | 6 | (6/208) |
| 18 | | | 4 | (4/164) | 4 | (4/167) |
| 19 | | 19q13(1/50) | 5 | (5/205) | 4 | (4/148) |
| 20 | | | 2 | (2/64) | 4 | (4/158) |
| 21 | | | 9 | (9/268) | 10 | (10/429) |
| 22 | | 22p+(4/50) | 8 | (8/292) | 15 | (15/526) |
| X | Xp21(1/50),
Xq/p(1/32) | Xp22.1(1/50),
Xq13(1/55), Xq21(1/10), Xq26(2/107) | 2 | (2/82) | 84 | (84/202) |
| Y | Yq+(1/16) | | 17 | (17/250) | 8 | (8/382) |
Specific alterations were found at 3p21, 3p25 and
3p26 in the patients of the present study. When these findings were
compared between patients with HG and LG tumors, the 3p21 loci was
dominantly altered in the HG group (Table II). There are a number of reported
genes at 3q21 that are associated with either genitourinary or
other tumors in the literature. The GPX1 gene was reported as a
selenium-dependent detoxifying enzyme gene located at chromosome
3p21, and a study by Ichimura et al (19) showed that the GPX1 Pro/Leu genotype
was associated with an increased risk of BC and may also be
associated with the development of high-stage tumors. The TU3A
gene, located on 3p21.2, was reported as a candidate tumor
suppressor gene in renal cell carcinoma (RCC). Additionally,
Awakura et al (20)
advocated that this gene is involved in primary cancers of the
bladder and testis. The histone methyltransferase gene SETD2/HYPB,
located at 3p21.31, was identified as a novel tumor suppressor gene
in RCC (21). The RASSF1 gene,
located at 3p21.3, is silenced in a variety of human cancers,
including lung, bladder, prostate and kidney cancers (22). Jarmalaite et al (23) studied promoter hypermethylation of
the p16, RARβ, RASSF1A, DAPK and MGMT genes in patients with BC,
and hypermethylation of the RASSF1A gene was more frequently
detected in muscle-invasive tumors compared with non-invasive
tumors. A high frequency of RASSF1A methylation, or the
inactivation of RASSF1A, was correlated with an advanced tumor
stage and poor prognosis in cases of BC, and hypermethylation of
the RASSF1A gene was detected in urine samples with high
specificity (24). In conclusion,
the 3p21 gene location contains numerous cancer-related genes, and
certain genes may be candidates for a panel of markers for BC.
The regions of 5q31 and 5q33 on chromosome 5 were
also detected as highly affected areas in the present study, and
5q31 was more frequently altered in patients with a HG tumor rather
than LG tumor (Table II). Specific
studies have previously reported that in a variety of cancers,
certain tumor suppressor genes were located to region 5q31.
Dallasso et al (25)
reported that protocadherin genes that are located to region 5q31
could be tumor suppressor genes in Wilms’ tumor. An association
between the sprouty homolog 4 gene at 5q31 and testicular cancer
was shown in a study by Kanetsky et al (26). These results indicate that the 5q31
gene location requires further study to elucidate its role in
BC.
It is known that the p16 gene, located at 9p21,
regulates the cell cycle and prevents abnormal cell proliferation.
Statistically significant alterations in p16 were detected in HGBC
in the present study. The alteration of p16 is concluded to be
strongly correlated with the advanced tumor grade. In a previous
study, the validity of p16 expression was evaluated in urine
cytological and histological samples, and the study reported that a
high incidence of p16 overexpression in HGUC was noted in
cytological samples and that immunocytological analysis of p16 is a
useful method for detecting UC and the tumor infiltrating potential
(27). In another study,
investigators researched the genetic alterations of the p16 and p14
genes in BC, and they did not find any association between tumor
grade/stage and p16 alterations. However, the deletion of the p14
gene was more frequently observed in poorly differentiated tumors.
This study also noted that p16 plays a role in early tumorigenesis
(28). Conversely, in the present
study it was found that the p16 gene was more frequently altered in
patients with HGBC. Krüger et al (29) assessed the prognostic effect of p16
alterations in patients with T1 stage BC and concluded that there
is a significant correlation between the status of p16 and
progression-free survival. However, they did not find any
significant correlations between p16 status and the tumor grade.
The latter finding does not agree with the data of the present
study. Currently, there is no consensus regarding p16 status
associating to tumor grade, stage and prognosis.
Alterations in the p53 tumor suppressor gene are
correlated with a number of varied malignancies. The association
between p53 changes and a higher cancer grade, stage, recurrence,
progression and mortality has been shown in a number of studies
(30,31). Despite these studies, there is
conflicting data regarding the p53 status. Malats et al
(32) overviewed 168 publications
from 117 studies and reported that changes in p53 are weakly
predictive of recurrence, progression and mortality in BC. In the
present study, alterations of p53 were more frequently observed in
HGBC rather than LGBC. This difference was statistically
significant. Furthermore, this result was similar to that of the
p16 gene. Depending on the frequency of p53 alterations in HGBC,
the expression of p53 in combination with other markers has also
been researched. Shariat et al (33) studied four cell cycle regulators
(p53, pRb, p21 and p27) in patients with locally advanced BC and
advocated that the combination of multiple molecular markers was
more informative than examining a single molecular marker. These
results indicate that the study of the p53 and p16 genes has had
predictive value in the clinic.
Currently used prognostic markers may be inadequate
for effective treatment decisions. In the literature, there are
numerous studies focused on determining prognostic markers.
Although there is currently no consensus about molecular markers
for BC, certain genes have been frequently detected in research. In
the present study, alterations of p16 and p53 were more frequently
detected in HG-cancer patients, and these genes may have predictive
values for BC. Aside from these genes, novel chromosomal locations
were searched for that may be responsible for the progression of
BC. Chromosomal abnormalities of two patient groups were overviewed
and compared. Almost all structural abnormalities were detected in
the 1q21, 1q32, 3p21 and 5q31 regions in patients with HG tumors.
Other structural abnormalities were found not only in patients with
HG tumors, but also in patients with LG tumors. Based on this
result, it was predicted that these regions may have a significant
role in the progression of BC. Aberrations in these areas may be
observed as a late event in BC pathogenesis and certain tumor
suppressor genes or oncogenes may be located in these regions.
Numerous studies have advocated that the decision of
BC management should not be made according to only one prognostic
marker. In the present study, the p16 and p53 genes were assessed
in patients with BC and it was revealed that these genes were
altered more prominently in patients with HG tumors compared with
patients with LG tumors, and this difference was statistically
significant. In addition to these genes, the structural and
numerical abnormalities of chromosomes were also assessed in blood
and tissue samples. Certain structural abnormalities were mostly
detected in the chromosomal regions of 1q21, 1q32, 3p21 and 5q31 in
patients with HG tumors rather than LG tumors. These areas must be
further studied to find candidate genes for a panel of BC
markers.
References
|
1
|
Jemal A, Bray F, Center MM, Ferlay J, Ward
E and Forman D: Global cancer statistics. CA Cancer J Clin.
61:69–90. 2011.
|
|
2
|
Jacobs BL, Lee CT and Montie JE: Bladder
cancer in 2010: how far have we come? CA Cancer J Clin. 60:244–272.
2010.
|
|
3
|
Sullivan PS, Chan JB, Levin MR and Rao J:
Urine cytology and adjunct markers for detection and surveillance
of bladder cancer. Am J Trans Res. 2:412–440. 2010.
|
|
4
|
Vrooman OP and Witjes JA: Molecular
markers for detection, surveillance and prognostication of bladder
cancer. Int J Urol. 16:234–243. 2009.
|
|
5
|
Habuchi T, Marberger M, Droller MJ, et al:
Prognostic markers for bladder cancer: International Consensus
Panel on bladder tumor markers. Urology. 66(Suppl 1): 64–74.
2005.
|
|
6
|
Proctor I, Stoeber K and Williams GH:
Biomarkers in bladder cancer. Histopathology. 57:1–13. 2010.
|
|
7
|
Lin HH, Ke HL, Huang SP, Wu WJ, Chen YK
and Chang LL: Increase sensitivity in detecting superficial, low
grade bladder cancer by combination analysis of hypermethylation of
E-cadherin, p16, p14, RASSF1A genes in urine. Urol Oncol.
28:597–602. 2010.
|
|
8
|
Knowles MA: The genetics of transitional
cell carcinoma: progress and potential clinical application. BJU
Int. 84:412–427. 1999.
|
|
9
|
Cianciulli AM, Leonardo C, Guadagni F, et
al: Genetic instability in superficial bladder cancer and adjacent
mucosa: an interphase cytogenetic study. Hum Pathol. 34:214–221.
2003.
|
|
10
|
Eble JN, Sauter G, Epstein JI and
Sesterhenn I: WHO Classification of Tumours Pathology and Genetics
of Tumours of the Urinary System and Male Genital Organs. IARC
Press; Lyon: pp. 90–91. 2004
|
|
11
|
Fundia AF and Larripa IB: Coincidence in
fragile site expression with fluorodeoxyuridine and
bromodeoxyuridine. Cancer Genet Cytogenet. 41:41–48. 1989.
|
|
12
|
Mitelman F: ISCN: An International System
for Human Cytogenetics Nomenclature. S Karger; Basel: 1995
|
|
13
|
McAlpine PJ, Shows TB, Boucheli C, Huebner
M and Anderson WA: The 1991 catalog of mapped genes and report of
the nomenclature committee, Human Gene Mapping 11. Cytogenet Cell
Genet. 58:5–102. 1991.
|
|
14
|
Trask B and Pinkel D: Fluorescence in situ
hybridization with DNA probes. Methods Cell Biol. 33:383–400.
1990.
|
|
15
|
Junker K, van Oers JM, Zwarthoff EC, Kania
I, Schubert J and Hartmann A: Fibroblast growth factor receptor 3
mutations in bladder tumors correlate with low frequency of
chromosome alterations. Neoplasia. 10:1–7. 2008.
|
|
16
|
Wolff DJ: The genetics of bladder cancer:
a cytogeneticist’s perspective. Cytogenet Genome Res. 118:177–181.
2007.
|
|
17
|
Tommasi S, Dammann R, Jin SG, Zhang XF,
Avruch J and Pfeifer GP: RASSF3 and NORE1: identification and
cloning of two human homologues of the putative tumor suppressor
gene RASSF1. Oncogene. 18: 21:2713–2720. 2002.
|
|
18
|
Caramazza D, Hussein K, Siragusa S, et al:
Chromosome 1 abnormalities in myeloid malignancies: a literature
survey and karyotype-phenotype associations. Eur J Haematol.
84:191–200. 2010.
|
|
19
|
Ichimura Y, Habuchi T, Tsuchiya N, et al:
Increased risk of bladder cancer associated with a glutathione
peroxidase 1 codon 198 variant. J Urol. 172:728–732. 2004.
|
|
20
|
Awakura Y, Nakamura E, Ito N, Kamoto T and
Ogawa O: Methylation-associated silencing of TU3A in human cancers.
Int J Oncol. 33:893–899. 2008.
|
|
21
|
Duns G, van den Berg E, van Duivenbode I,
et al: Histone methyltransferase gene SETD2 is a novel tumor
suppressor gene in clear cell renal cell carcinoma. Cancer Res. 1:
70:4287–4291. 2010.
|
|
22
|
Angeloni D: Molecular analysis of
deletions in human chromosome 3p21 and the role of resident cancer
genes in disease. Brief Funct Genomic Proteomic. 6:19–39. 2007.
|
|
23
|
Jarmalaite S, Jankevicius F, Kurgonaite K,
Suziedelis K, Mutanen P and Husgafvel-Pursiainen K: Promoter
hypermethylation in tumour suppressor genes shows association with
stage, grade and invasiveness of bladder cancer. Oncology.
75:145–151. 2008.
|
|
24
|
Dammann R, Schagdarsurengin U, Seidel C,
et al: The tumor suppressor RASSF1A in human carcinogenesis: an
update. Histol Histopathol. 20:645–663. 2005.
|
|
25
|
Dallosso AR, Hancock AL, Szemes M, et al:
Frequent long-range epigenetic silencing of protocadherin gene
clusters on chromosome 5q31 in Wilms’ tumor. PLoS Genet.
5:10007452009.
|
|
26
|
Kanetsky PA, Mitra N, Vardhanabhuti S, et
al: Common variation in KITLG and at 5q31.3 predisposes to
testicular germ cell cancer. Nat Genet. 41:811–815. 2009.
|
|
27
|
Nakazawa K, Murata S, Yuminamochi T, et
al: p16(INK4a) expression analysis as an ancillary tool for
cytologic diagnosis of urothelial carcinoma. Am J Clin Pathol.
132:776–784. 2009.
|
|
28
|
Chang LL, Yeh WT, Yang SY, Wu WJ and Huang
CH: Genetic alterations of p16INK4a and p14ARF genes in human
bladder cancer. J Urol. 170:595–600. 2003.
|
|
29
|
Krüger S, Mahnken A, Kausch I and Feller
AC: P16 immunoreactivity is an independent predictor of tumor
progression in minimally invasive urothelial bladder carcinoma. Eur
Urol. 47:463–467. 2005.
|
|
30
|
Moonen PM, van Balken-Ory B, Kiemeney LA,
Schalken JA and Witjes JA: Prognostic value of p53 for high risk
superficial bladder cancer with long-term followup. J Urol.
177:80–83. 2007.
|
|
31
|
Smith ND, Rubenstein JN, Eggener SE and
Kozlowski JM: The p53 tumor suppressor gene and nuclear protein:
basic science review and relevance in the management of bladder
cancer. J Urol. 169:1219–1228. 2003.
|
|
32
|
Malats N, Bustos A, Nascimento CM, et al:
P53 as a prognostic marker for bladder cancer: a meta-analysis and
review. Lancet Oncol. 6:678–686. 2005.
|
|
33
|
Shariat SF, Chade DC, Karakiewicz PI, et
al: Combination of multiple molecular markers can improve
prognostication in patients with locally advanced and lymph node
positive bladder cancer. J Urol. 183:68–75. 2010.
|