Introduction
Diffusion-weighted magnetic resonance imaging (MRI)
has been increasingly performed for clinical purposes, including
the detection of tumors and cerebrovascular diseases. The apparent
diffusion coefficient (ADC) value, which is calculated based on
diffusion-weighted imaging (DWI) using several b values, is useful
for discriminating whether the lesion is benign or malignant and
determining the therapeutic effect of a tumor. Recently,
popularized 3 Tesla (3T) MRI devices have shown a performance
advantage when calculating accurate ADC values. Several clinical
studies have revealed that ADC values from 3T MRI have the
diagnostic value as a quantitative parameter (1–8).
However, to the best of our knowledge, there are no reports of an
ADC phantom for 3T MRI. With regard to ADC phantoms for 1.5T MRI,
Tamura et al (9) reported a
phantom that used gelatin and sucrose. While Matsuya et al
(10) reported a phantom using
polyethylene glycol for 1.5T MRI, and created empirical formulas to
calculate polyethylene glycol concentration, which provide
arbitrary ADC values at any temperature measurement. In principle,
the ADC value of a phantom differs due to its temperature. In the
present study, an ADC phantom was developed using sucrose for 3T
MRI, which produces arbitrary ADC values due to a range of phantom
temperatures (28–39°C), which includes the physiological body
temperature. This is the first temperature-controlled ADC phantom
for 3T MRI, which mimics the ADC values of the normal and tumor
tissues of the human body. In addition, the developed empirical
formula enables the calculation of a sucrose concentration that
provides arbitrary ADC values at any phantom temperature.
Materials and methods
Sucrose phantoms
To create the sucrose phantoms, sucrose (S0389-500G;
Sigma-Aldrich, St. Louis, MO, USA), NaN3 (28-1789-5;
Sigma-Aldrich, Tokyo, Japan), as an antiseptic, and distilled water
were heated and stirred until dissolved. The solution was cooled
and the final concentrations of sucrose and NaN3 were
adjusted to 0.2, 0.4, 0.6, 0.8, 1.0 and 1.2 M, and 0.03% (w/w),
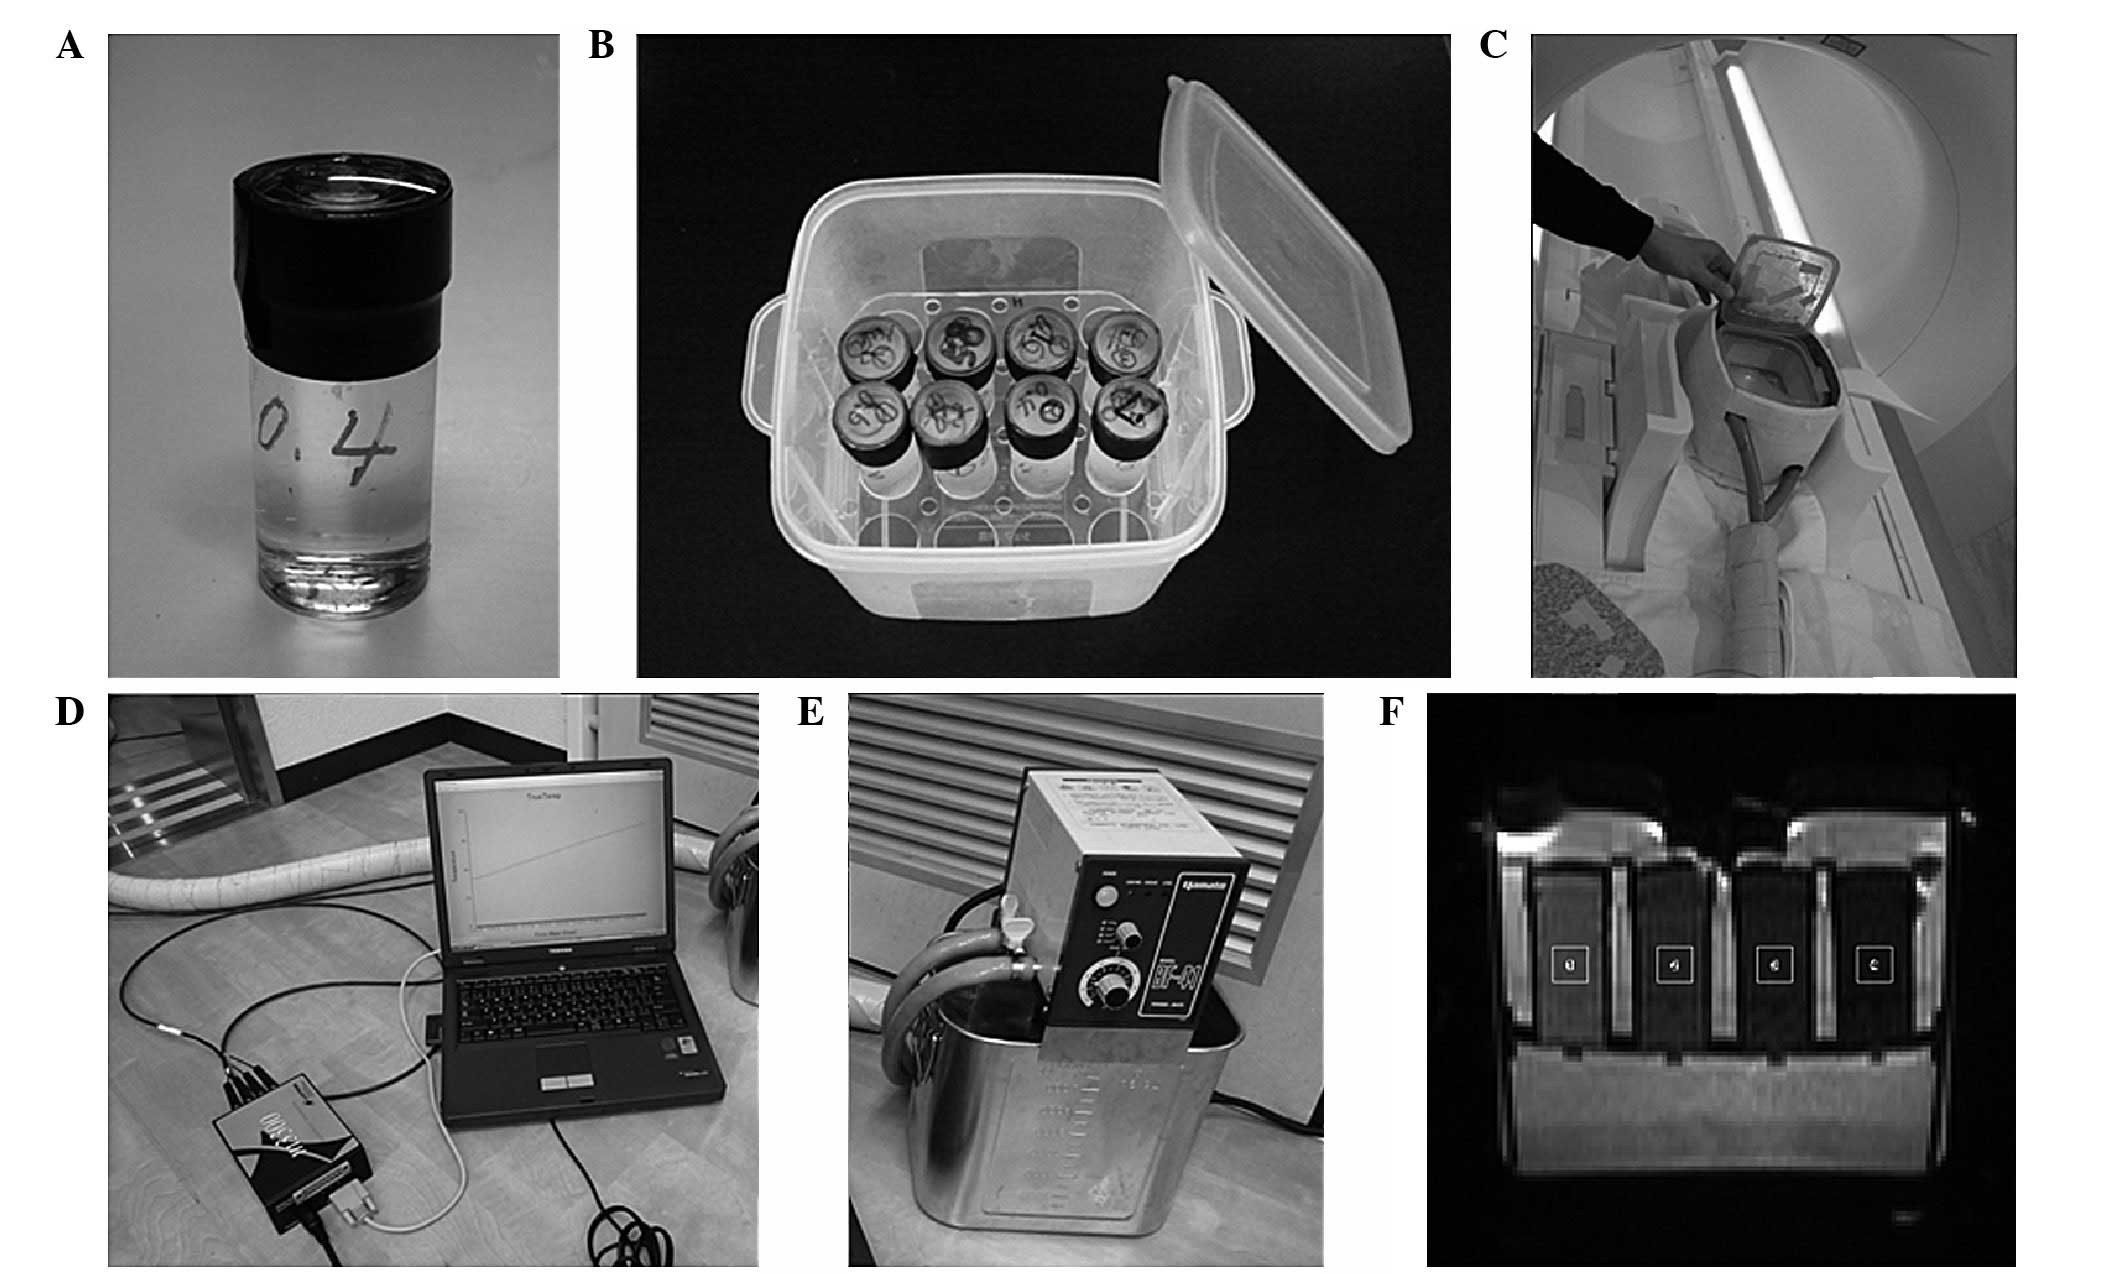
respectively. These solutions were then filled into phantom cases
(No1-4628-11; As One Co., Osaka, Japan; Fig. 1A) as sucrose phantoms.
Preparation for the MRI of sucrose
phantoms
Sucrose phantoms were placed into a container filled
with 0.9 M sucrose solution and 0.03% (w/w) NaN3. The
container was able to hold a maximum of 16 phantoms (Fig. 1B).
Heating system
The phantom case container was enclosed in a heating
box (Fig. 1C) made of
Styrofoam that was produced in-house (Department of Radiological
Technology, Graduate School of Health Sciences, Okayama University,
Okayama, Japan). The container was heated in the gantry of an MRI
scanner via a tube that was connected to a circulating
temperature-regulated water bath (Thermo-Mate BF-41; Yamato
Scientific Co., Ltd., Tokyo, Japan; Fig. 1D), to maintain the desired phantom
temperature during the MRI.
Real-time phantom temperature
monitoring
Optical fiber thermometers (Fluoroptic™ thermometer
m600; Luxtron Co., Mountain View, CA, USA; Fig. 1E) were placed into the phantoms. The
phantom temperature was monitored every 30 sec during the MRI to
ensure a constant temperature.
MRI
A clinical 3T MRI unit (Magnetom Skyra; Siemens,
Erlangen, Germany) with a head coil was used for the MRI. DW images
were acquired by a three-scan trace, in the phase-encoding, readout
and slice-selective directions, via a single-shot echo-planar
imaging sequence. The scan parameters were set as follows: 8,000
msec of relation time; 100 msec of echo time; 220×220-mm field of
view; 160×112 matrix; b values of 0, 300, 600, 900, 1200, 1500,
1800, 2100, 2400, 2700 and 3000 sec/mm2; a thickness of
5 mm; one excitation number; 26.2-msec diffusion gradient pulse
duration (δ); and 47.1-msec diffusion time (Δ), which was the
interval between the onset of the diffusion gradient pulses. Each
DW image of a maximum of four phantoms was obtained at each ~1°C
interval to cover the physiological body temperature within the
range of 28–39°C.
Accurate measurement of ADC values
The region of interest (ROI; Fig. 1F) was 7.27 mm2 at the
position of the thermometer on each phantom DW image. The average
signal intensity in each ROI was obtained using Image-J software
(National Institutes of Health, Bethesda, MD, USA). The logarithms
of these signal intensities were plotted as a function of the 11 b
values of 0, 300, 600, 900, 1200, 1500, 1800, 2100, 2400, 2700 and
3000 sec/mm2. The slope of the regression line, which is
defined as the ADC value, and its R2 value were obtained
by the least-squares method. The 10 sets of ADC values and their
R2 values were obtained for each set of data, from 11 DW
images using 11 b values to two DW images using two b values, in
order of decreasing b value. We used 10 sets of DW images using the
following combination of b values; 0, 300, 600, 900, 1200, 1500,
1800, 2100, 2400, 2700 and 3000; 0, 300, 600, 900, 1200, 1500,
1800, 2100, 2400 and 2700; 0, 300, 600, 900, 1200, 1500, 1800, 2100
and 2400; 0, 300, 600, 900, 1200, 1500, 1800 and 2100; 0, 300, 600,
900, 1200, 1500 and 1800 / 0, 300, 600, 900, 1200 and 1500; 0, 300,
600, 900 and 1200; 0, 300, 600 and 900; 0, 300 and 600; 0 and 300.
When the R2 values exceeded 0.99 according to a decrease
in b value, the ADC values from its set of b values was determined
to be accurate; specifically, the b value used was within the range
that the signal intensities remained above the noise, and where the
slope of the logarithms of the signal intensities versus b values
became linear. These accurate ADC values were used to create the
following empirical formula.
Empirical formula for calculating phantom
ADC values
ADC values of the phantoms were plotted as a
function of the temperature from 28–39°C at 1°C intervals for each
sucrose concentration of 0, 0.2, 0.4, 0.6, 0.8, 1.0 and 1.2 M. The
linear equations were determined for each sucrose concentration
based on a first-order approximation of the correlation between the
ADC values and the phantom temperature. The first-order
coefficients and intercepts of the seven linear equations were also
plotted as a function of the sucrose concentrations. Subsequently,
two formulas were created; one based on the fourth-order
approximation of the correlation between the first-order
coefficients and sucrose concentrations, with the other based on
the fourth-order approximation of the correlation between the
intercepts and sucrose concentrations. Using these two formulas, an
empirical formula was developed for calculating ADC values of
phantoms that were made of arbitrary sucrose concentrations at
arbitrary phantom temperatures.
Validation of the accuracy of the
empirical formula
To validate the accuracy of the empirical formula,
new phantoms were produced using sucrose concentrations of 0.2,
0.4, 0.6, 0.8, 1.0 and 1.2 M. Three phantoms were made of each
concentration and all sucrose concentrations were used three times
independently. The mean ADC values were obtained at each
concentration. The ADC values of these verification phantoms were
measured at phantom temperatures ranging from 28–39°C at 1°C
intervals. The experimental mean ADC values of these verification
phantoms were compared with the ADC values calculated using the
empirical formula by substituting the sucrose concentrations and
phantom temperatures at measurement. The correlation between the
ADC values calculated using the empirical formula and the range of
the standard deviations (SDs) of the experimental ADC values of the
verification phantoms were then validated.
Results
Calculation accuracy of ADC values
For each concentration and temperature of the
sucrose phantoms, the ADC values were calculated. The 10 sets of
ADC values and their R2 values were obtained by the
least-squares method for each set of data from 11 DW images using
11 b values to two DW images using two b values in order of
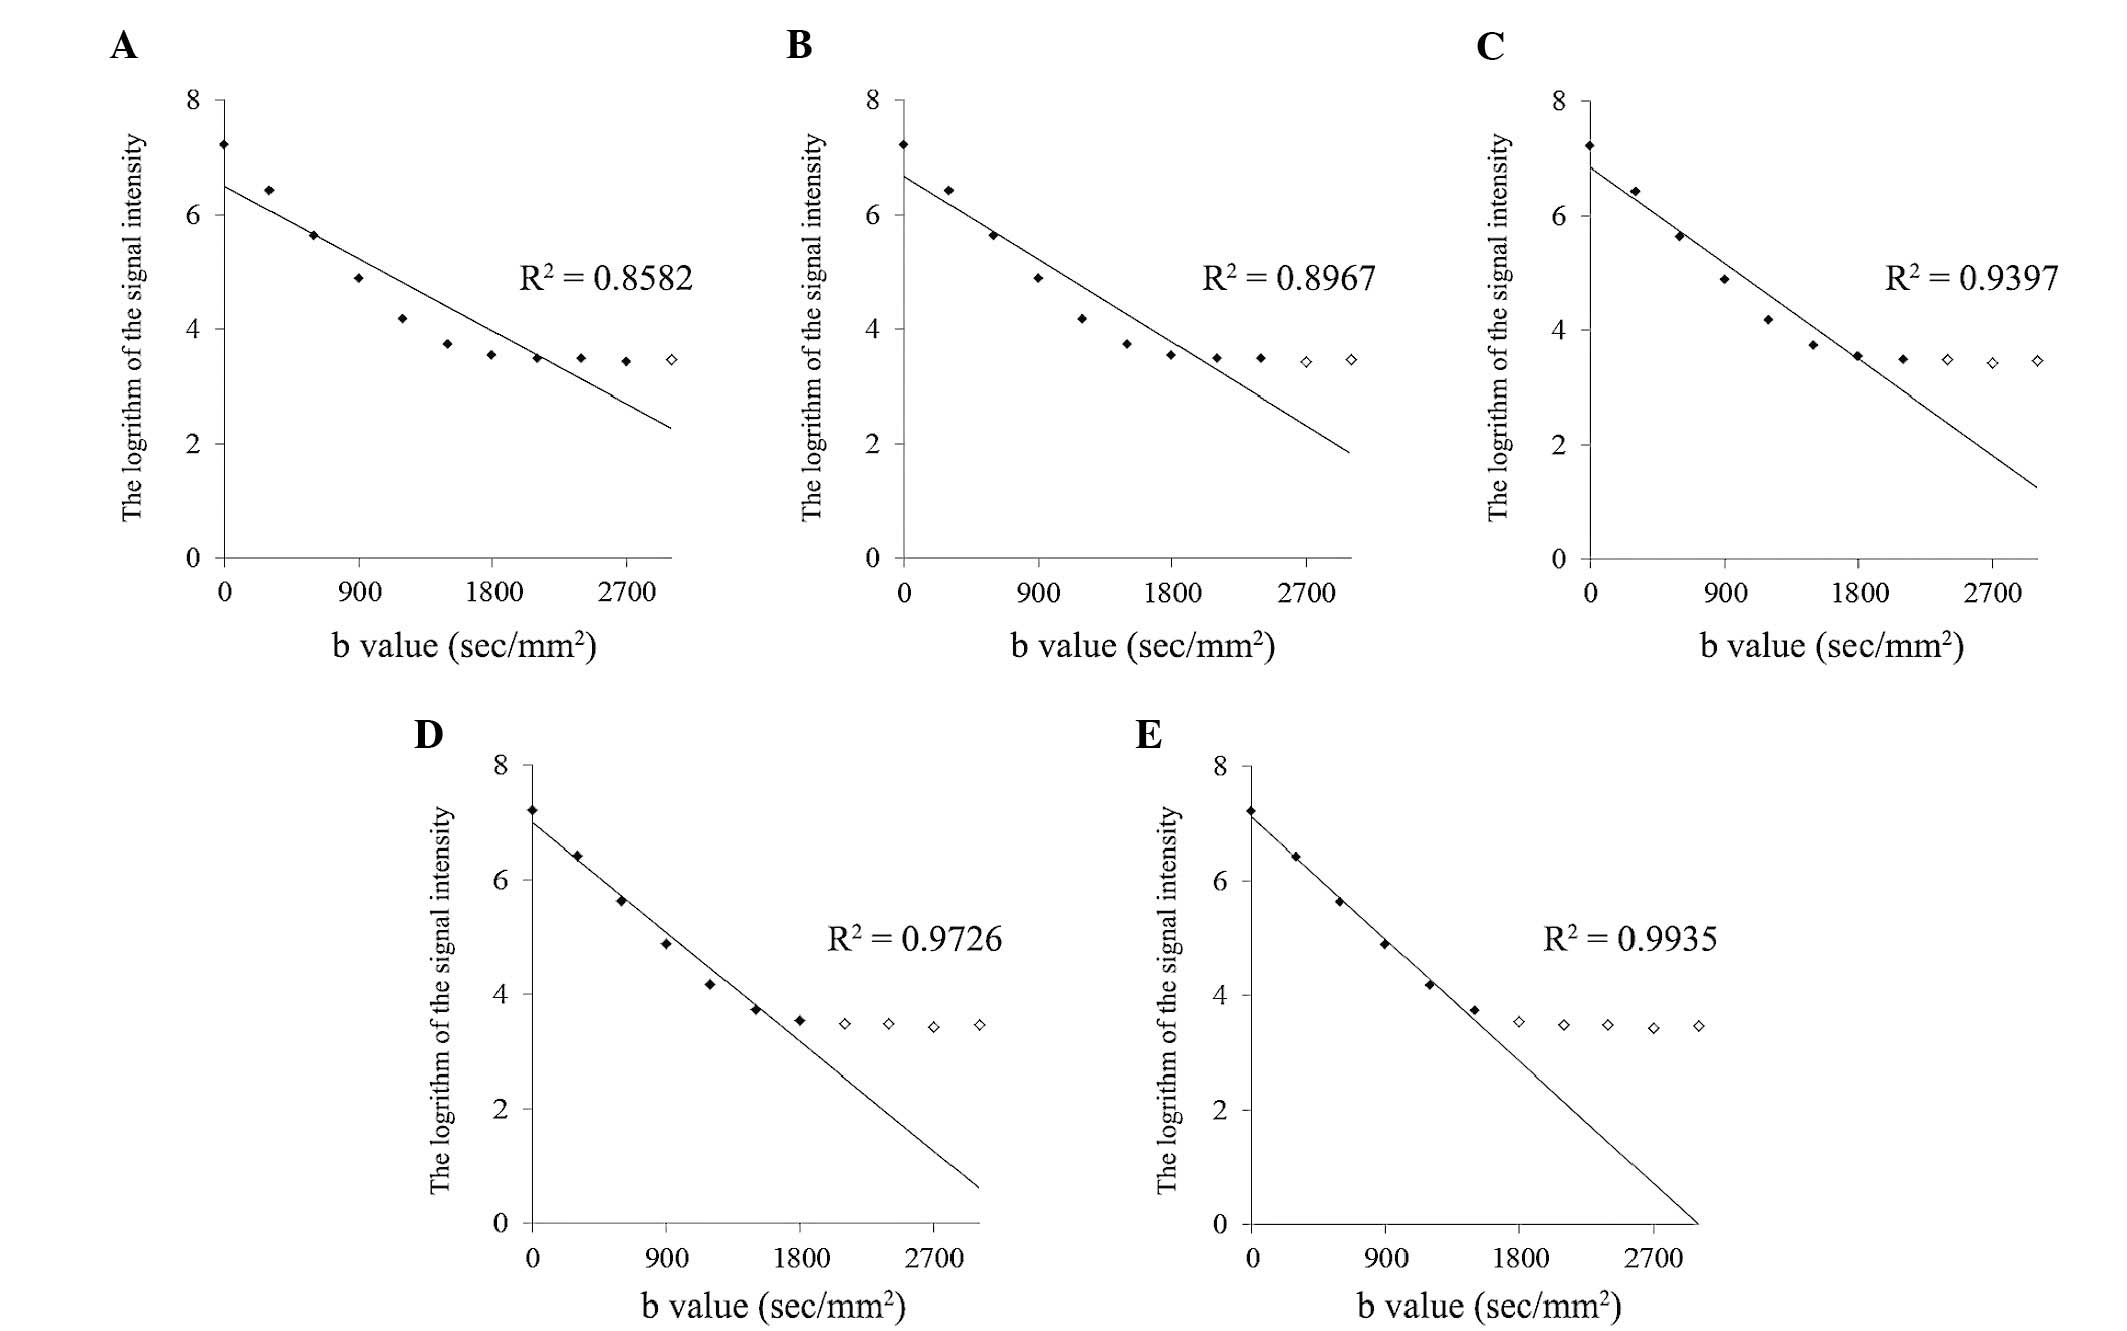
decreasing b value. As an example, Fig.
2 indicates the procedure to calculate the ADC value of a 0.2 M
phantom at a temperature of 37.09°C. Among 10 sets of ADC values
and their R2 values, when the maximum b value decreased
to 1,500 sec/mm2 (Fig.
2E), the R2 value obtained for the set of data from
six DW images using six b values exceeded 0.99 to become 0.9935.
According to the slope calculation using this set, the ADC value of
the 0.2 M phantom became 3.72×10⁻³, which was confirmed
to be accurate. Finally, the ADC values were selected for all
concentrations and temperatures, as shown in Fig. 3A.
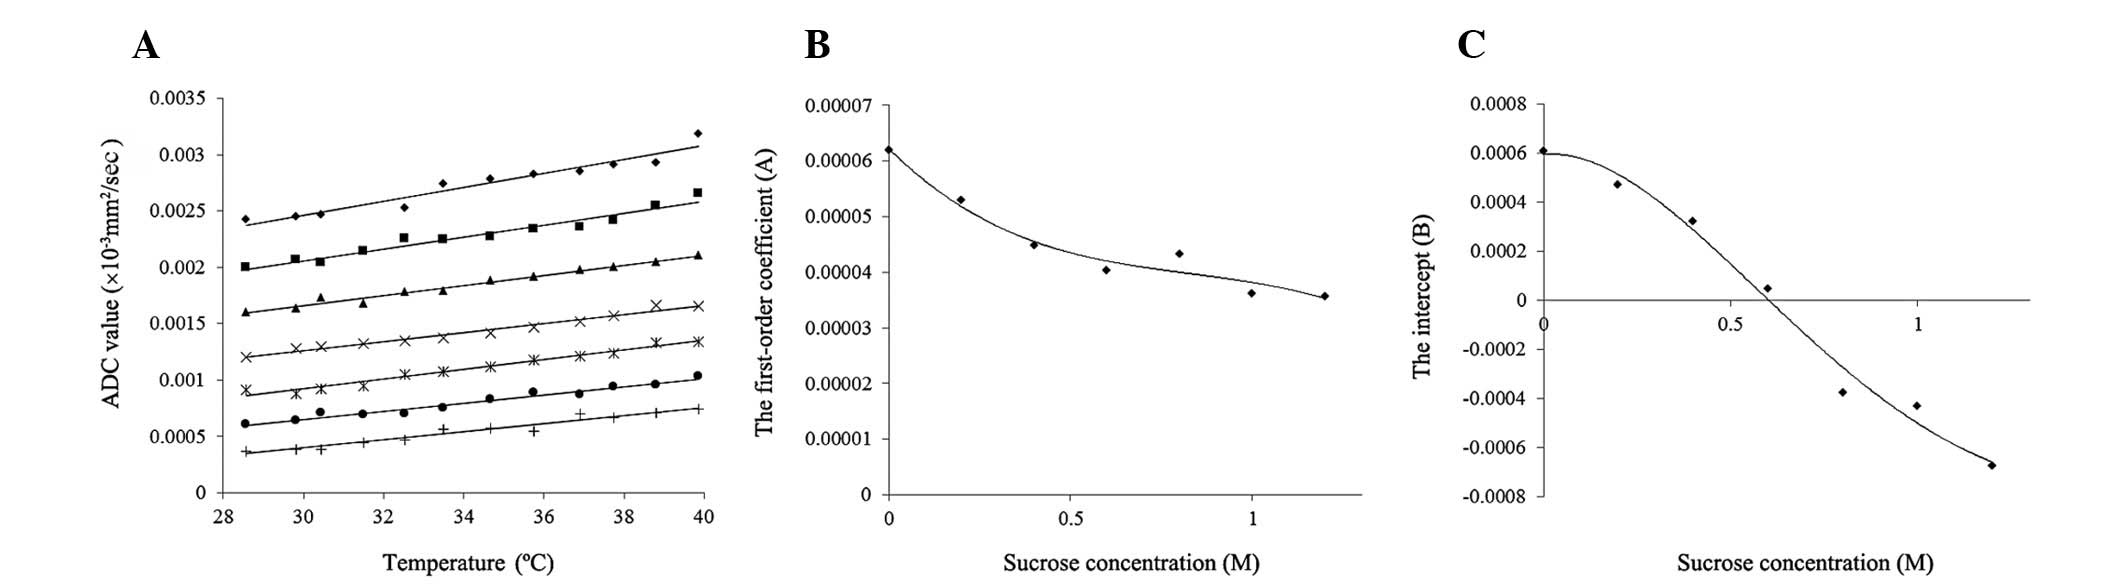 | Figure 3The ADC values of the phantoms and the
development of an empirical formula to calculate the ADC values.
(A) The change of ADC values by temperature. The vertical axis
indicates the ADC values and the horizontal axis indicates the
phantom temperature. Sucrose phantom concentrations of ⋄, 0; ■,
0.2; ▲, 0.4; ×, 0.6; *, 0.8; ●, 1.0; and +, 1.2 M. Each straight
line indicates a first-order approximation of the correlation
between the ADC values and the phantom temperature for each sucrose
concentration. The (B) first-order coefficients and (C) intercepts
of these linear equations are plotted. Each R2 value for
the first-order approximation was within the range of
0.9379–0.9801. (B) The correlations between the sucrose
concentrations and the first-order coefficients of linear equations
from the first-order approximation. Black diamonds indicate
first-order coefficients, while the curved line indicates the
fourth-order approximation, with R2=0.9638. (C) The
correlations between sucrose concentrations and the intercepts of
the linear equations from the first-order approximation. Black
diamonds indicate intercepts, while the curved line indicates the
fourth-order approximation, with R2=0.9862. ADC,
apparent diffusion coefficient. |
Change in the ADC value of sucrose
phantoms by temperature
The ADC values of the 0, 0.2, 0.4, 0.6, 0.8, 1.0 and
1.2 M phantoms are plotted in Fig.
3A as a function of temperature. The ADC values of the phantoms
of each sucrose concentration increased with increasing phantom
temperature. The increasing rate of the ADC value per 1°C increased
as the sucrose concentration decreased.
Development of an empirical formula to
calculate ADC values
Seven linear equations were developed based on a
first-order approximation of the correlation between the ADC values
and phantom temperature (t) for each sucrose concentration (s), as
shown in Fig. 3A. The values of
these R2 were within the range of 0.9379–0.9801. The
first-order coefficients (A) and intercepts (B) of the seven linear
equations were plotted as a function of sucrose concentrations (s),
as shown in Fig. 3B and C,
respectively. Each formula was developed based on a fourth-order
approximation of the correlation between the first-order
coefficients or intercepts and sucrose concentrations. The
R2 values were 0.9638 and 0.9862, respectively. Using
these relational formulas, an empirical formula was developed for
calculating the ADC values of phantoms consisting of an arbitrary
sucrose concentration (s) at arbitrary phantom temperature (t), as
follows: ADC value (x10−3 mm2/sec) = At + B,
where A = a1s4 − a2s3 +
a3s2 − a4s + a5
(a1=8.96519842127907×10⁻⁷,
a2=2.94479295800953×10⁻⁵,
a3=6.94789261608819×10⁻⁵,
a4=6.5038339758676×10⁻⁵ and
a5=6.22597789270809×10⁻⁵) and B =
−b1s4 + b2s3
−b3s2 + b4s + b5
(b1=5.75284527700504×10⁻⁴,
b2=2.48741270074326×10⁻³,
b3=3.12590711150129×10⁻³,
b4=1.19937338765919×10⁻⁴ and
b5=5.94518521028771×10⁻⁴).
Validation of the accuracy of the
empirical formula
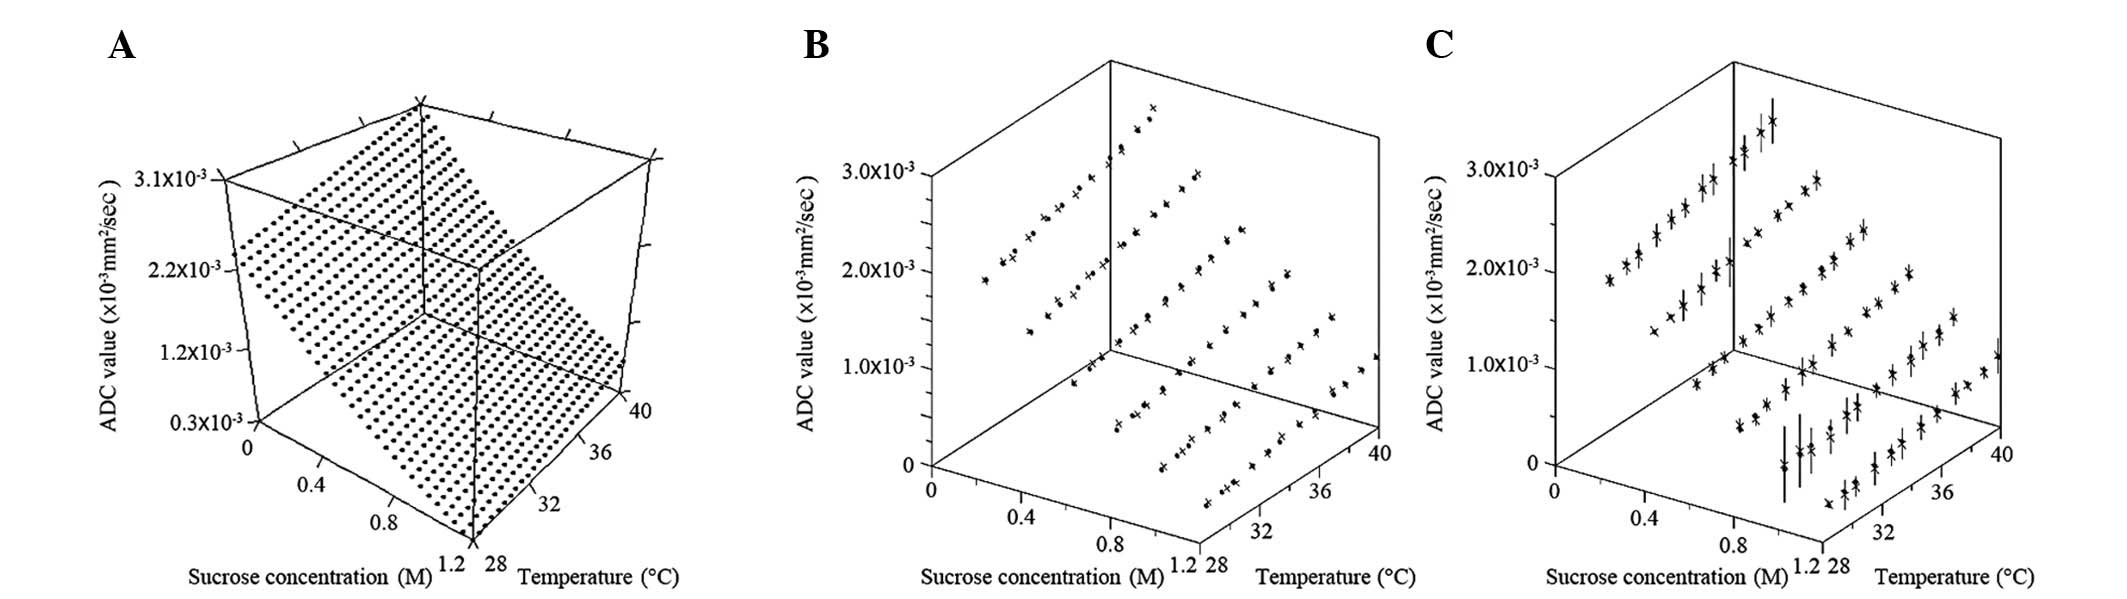
Fig. 4A indicates
the calculated ADC values using the empirical formula shown as the
three-dimensional graph with the correlation among ADC values,
sucrose concentration and phantom temperature. The ADC values
decreased according to an increase in sucrose concentration and
decrease in phantom temperature. Fig.
4B indicates the correlation between the ADC values, which have
been used to make the empirical formula, and the ADC values
calculated using the empirical formula. The formula appears to
mimic well all the ADC values that were initially used to create
it. Fig. 4C indicates the
correlation between the ADC values measured using the verification
phantoms and the ADC values calculated using the empirical formula.
In total, 66.67% of the calculated ADC values were less than one SD
away from the mean of the measured ADC values of verification
phantoms; 97.22% of the calculated ADC values were less than two
SDs away from the mean; and 100% of calculated ADC values were less
than three SDs away from the mean.
Discussion
To the best of our knowledge, this is the first
study to report ADC phantoms for DW images with 3T MRI. ADC
phantoms were produced for 3T MRI using sucrose, and an empirical
formula was developed to calculate ADC values between
0.33–3.02×10⁻³ at arbitrary sucrose concentrations
between 0–1.2 M and arbitrary phantom temperatures between 28–39°C,
including the physiological temperature of 37°C to mimic the normal
and tumor tissue of the human body.
Sucrose, a large molecule with the formula of
C12H22O11, is a safe and
inexpensive material, with a concentration that can be easily
controlled. The diffusion coefficient of the material (D) was
associated with the temperature (t), the viscosity of the medium
(η), and the radius of the diffusion molecule (r) using the
Stokes-Einstein equation (11): D =
kt/6πηr, where k is the Boltzmann constant (1.3805×10⁻²³
J K−1). Therefore, sucrose with a large molecular size
of 0.9 nm in diameter was selected as the material for the phantoms
to decrease the ADC values (12).
According to the Stokes-Einstein equation, ADC
values are affected by the temperature of the objects in question.
As the ADC values used in clinical MRI diagnosis are measured for
the human body at 37°C, ADC phantoms that mimic human body tissue
should be comparable. Sasaki et al (13) measured the ADC values of
bio-phantoms using human Burkitt’s lymphoma cells at 37°C; however,
the majority of in vitro studies have performed the ADC
measurement at a lower temperature (14–16).
Tamura et al (9) reported an
ADC phantom using 10–50% (wt/wt) sucrose for 1.5T MRI, which covers
the range of ADC values between 0.2 and 1.8×10⁻³
mm2/sec for temperatures between 6 and 20°C. In the
pre-examination of the present study, the ADC values were measured
at temperatures between 6–39°C. The R2 values of the
first-order approximation of the correlation between the ADC values
and phantom temperature were low for phantoms of high sucrose
concentration at temperatures of <27°C. Therefore, the
temperature range of 28–39°C was used to create the empirical
formula.
This empirical formula covered ADC values from
0.672.47×10−3 mm2/sec at a physiological
temperature of 37°C. The ADC values of the phantoms almost covered
the ADC values of the normal and tumor tissues of the human body
that are measured clinically by 3T MRI, as summarized in Table I (1,3,5–8,17–19).
Table I indicates the sucrose
concentration of the ADC phantoms at 37°C, which mimic each tissue
of the human body using the empirical formula.
 | Table ISucrose concentration mimicking ADC
values of human body. |
Table I
Sucrose concentration mimicking ADC
values of human body.
| Regions (ref) | Mean ADC values,
×10−3 mm2/sec | Sucrose
concentration, M |
|---|
| Lesions |
| Brain |
| Lymphoma (6) | 0.62b | ~1.2 |
| Head and neck |
| Squamous cell
carcinoma (1) | 1.10 | 0.86 |
| Thyroid gland |
| Malignant tumor
(19) | 0.81c | 1.07 |
| Benign tumor
(19) | 1.55c | 0.61 |
| Pancreas |
| Neoplastic cystic
lesion (7) | 2.60b | 0.13 |
| Mucinous cystic
lesion (7) | 2.60b | 0.13 |
| Uterine cervix |
| Malignant tumor
(3) | 0.88b | 1.02 |
| Ovary |
| Malignant tumor
(8) | 1.04a | 0.91 |
| Benign tumor
(8) | 1.15a | 0.84 |
| Prostate |
| Peripheral zone
tissue |
| Malignant tumor
(17) | 0.85d | 1.04 |
| Benign tumor
(17) |
1.17d | 0.82 |
| Transition zone
tissue |
| Malignant tumor
(17) |
0.84d | 1.05 |
| Benign tumor
(17) |
1.08d | 0.88 |
| Normal tissues |
| Brain |
| White matter
(18) |
0.76b | 1.11 |
| Gray matter
(18) |
0.78b | 1.10 |
| Muscle |
| Gluteus (3) |
1.24a | 0.78 |
| Prostate |
| Central gland
(17) |
1.19d | 0.81 |
| Peripheral gland
(17) |
1.54d | 0.61 |
| Tyroid tissue
(19) |
1.32c | 0.73 |
One limitation of this study was that the sucrose
phantoms produced ADC values due to changes in free diffusion
alone. The actual in vivo diffusion in the human body is
affected not only by the change of free diffusion, but also various
factors, including perfusion and the change of restricted
diffusion, due to cellular membrane structures and cell density
(20–26). This new ADC phantom and empirical
formula for 3T MRI has the potential to be used in a number of
applications.
Acknowledgements
The authors would like to thank the staff members of
the Department of Radiology and Central Division of Radiology of
Okayama University Hospital (Okayama, Japan) for their support of
this study. This study was partially supported by a Grant-in-Aid
for Scientific Research [grant no. C (22591335)] from the Ministry
of Health, Labour and Welfare of Japan (Tokyo, Japan).
References
|
1
|
Srinivasan A, Dvorak R, Rohrer S and
Mukherji SK: Initial experience of 3-tesla apparent diffusion
coefficient values in characterizing squamous cell carcinomas of
the head and neck. Acta Radiol. 49:1079–1084. 2008.
|
|
2
|
Jung SH, Heo SH, Kim JW, et al: Predicting
response to neoadjuvant chemoradiation therapy in locally advanced
rectal cancer: diffusion-weighted 3 Tesla MR imaging. J Magn Reson
Imaging. 35:110–116. 2012.
|
|
3
|
Kim HS, Kim CK, Park BK, Huh SJ and Kim B:
Evaluation of therapeutic response to concurrent chemoradiotherapy
in patients with cervical cancer using diffusion-weighted MR
imaging. J Magn Reson Imaging. 37:187–193. 2013.
|
|
4
|
Jensen LR, Garzon B, Heldahl MG, et al:
Diffusion-weighted and dynamic contrast-enhanced MRI in evaluation
of early treatment effects during neoadjuvant chemotherapy in
breast cancer patients. J Magn Reson Imaging. 34:1099–1109.
2011.
|
|
5
|
Abdel Razek AA, Elkhamary S, Al-Mesfer S
and Alkatan HM: Correlation of apparent diffusion coefficient at 3T
with prognostic parameters of retinoblastoma. AJNR Am J
Neuroradiol. 33:944–948. 2012.
|
|
6
|
Doskaliyev A, Yamasaki F, Ohtaki M, et al:
Lymphomas and glioblastomas: Differences in the apparent diffusion
coefficient evaluated with high b-value diffusion-weighted magnetic
resonance imaging at 3T. Eur J Radiol. 81:339–344. 2012.
|
|
7
|
Mottola JC, Sahni VA, Erturk SM, et al:
Diffusion-weighted MRI of focal cystic pancreatic lesions at
3.0-Tesla: preliminary results. Abdom Imaging. 37:110–117.
2012.
|
|
8
|
Uehara T, Takahama J, Marugami N, et al:
Visualization of ovarian tumors using 3T MR imaging: diagnostic
effectiveness and difficulties. Magn Reson Med Sci. 11:171–178.
2012.
|
|
9
|
Tamura T, Usui S and Akiyama M:
Investigation of a phantom for diffusion weighted imaging that
controlled the apparent diffusion coefficient using gelatin and
sucrose. Nihon Hoshasen Gijutsu Gakkai Zasshi. 65:1485–1493.
2009.(In Japanese).
|
|
10
|
Matsuya R, Kuroda M, Matsumoto Y, et al: A
new phantom using polyethylene glycol as an apparent diffusion
coefficient standard for MR imaging. Int J Oncol. 35:893–900.
2009.
|
|
11
|
Einstein A: Investigations on the Theory
of the Brownian Movement. Fürth R: Dover Publications, Inc; New
York, NY: pp. p811956
|
|
12
|
Ramm LE, Whitlow MB and Mayer MM:
Transmembrane channel formation by complement: functional analysis
of the number of C5b6, C7, C8 and C9 molecules required for a
single channel. Proc Natl Acad Sci USA. 79:4751–4755. 1982.
|
|
13
|
Sasaki T, Kuroda M, Katashima K, et al:
In vitro assessment of factors affecting the apparent
diffusion coefficient of Ramos cells using bio-phantoms. Acta Med
Okayama. 66:263–270. 2012.
|
|
14
|
Anderson AW, Xie J, Pizzonia J, et al:
Effects of cell volume fraction changes on apparent diffusion in
human cells. Magn Reson Imaging. 18:689–695. 2000.
|
|
15
|
Roth Y, Ocherashvilli A, Daniels D, et al:
Quantification of water compartmentation in cell suspensions by
diffusion-weighted and T(2)-weighted MRI. Magn Reson Imaging.
26:88–102. 2008.
|
|
16
|
Pilatus U, Shim H, Artemov D, et al:
Intracellular volume and apparent diffusion constants of perfused
cancer cell cultures, as measured by NMR. Magn Reson Med.
37:825–832. 1997.
|
|
17
|
Kitajima K, Takahashi S, Ueno Y, et al:
Clinical utility of apparent diffusion coefficient values obtained
using high b-value when diagnosing prostate cancer using 3 tesla
MRI: comparison between ultra-high b-value (2000 s/mm2)
and standard high b-value (1000 s/mm2). J Magn Reson
Imaging. 36:198–205. 2012.
|
|
18
|
Cihangiroglu M, Ulug AM, Firat Z, et al:
High b-value diffusion-weighted MR imaging of normal brain at 3T.
Eur J Radiol. 69:454–458. 2009.
|
|
19
|
Ilica AT, Artas H, Ayan A, et al: Initial
experience of 3 tesla apparent diffusion coefficient values in
differentiating benign and malignant thyroid nodules. J Magn Reson
Imaging. 37:1077–1082. 2013.
|
|
20
|
Lyng H, Haraldseth O and Rofstad EK:
Measurement of cell density and necrotic fraction in human melanoma
xenografts by diffusion weighted magnetic resonance imaging. Magn
Reson Med. 43:828–836. 2000.
|
|
21
|
Kim H, Morgan DE, Buchsbaum DJ, et al:
Early therapy evaluation of combined anti-death receptor 5 antibody
and gemcitabine in orthotopic pancreatic tumor xenografts by
diffusion-weighted magnetic resonance imaging. Cancer Res.
68:8369–8376. 2008.
|
|
22
|
Kamel IR, Bluemke DA, Ramsey D, et al:
Role of diffusion-weighted imaging in estimating tumor necrosis
after chemoembolization of hepatocellular carcinoma. AJR Am J
Roentgenol. 181:708–710. 2003.
|
|
23
|
Lang P, Wendland MF, Saeed M, et al:
Osteogenic sarcoma: noninvasive in vivo assessment of tumor
necrosis with diffusion-weighted MR imaging. Radiology.
206:227–235. 1998.
|
|
24
|
Gibbs P, Liney GP, Pickles MD, et al:
Correlation of ADC and T2 measurements with cell density in
prostate cancer at 3.0 Tesla. Invest Radiol. 44:572–576. 2009.
|
|
25
|
Guo AC, Cummings TJ, Dash RC and
Provenzale JM: Lymphomas and high-grade astrocytomas: comparison of
water diffusibility and histologic characteristics. Radiology.
224:177–183. 2002.
|
|
26
|
Thoeny HC, De Keyzer F, Chen F, et al:
Diffusion-weighted MR imaging in monitoring the effect of a
vascular targeting agent on rhabdomyosarcoma in rats. Radiology.
234:756–764. 2005.
|