Introduction
Colorectal cancer forms by uncontrolled cell
proliferation in the colon, rectum or appendix. Genome-scale
analysis has indicated that colon and rectal cancers are
genetically the same disease since their patterns of genomic
alteration are similar (1).
Currently, colorectal cancer is the third leading cause of
cancer-related mortality (2). The
fact that the mortality rate of this disease has decreased in the
past few years is attributable to improved treatment and early
diagnosis. However, the 5-year survival rate remains at <60% in
Europe (3). A high percentage of
patients succumb to colorectal cancer every year. Adenomatous
colorectal polyps are the precursors of the majority of colorectal
cancers (4). Investigation into the
gene expression changes in the progression of colorectal adenoma
may offer potential targets for the development of novel diagnostic
strategies.
Microarray analysis is a powerful approach to
investigate transcriptomic changes that may reflect molecular
characteristics underlying the pathogenesis of complex diseases.
Distinct gene expression patterns in colorectal adenoma have been
proposed in previous gene expression studies (5–8).
However, these studies were generally based on a limited number of
cases or only focused on a single or a few genes. The majority of
proteins function through interactions with other proteins in
various biological processes. Therefore, pathway- or biological
process-based analysis may provide an improved understanding of the
mechanism underlying colorectal adenoma progression.
Using a microarray data set from the gene expression
omnibus (GEO) database, the present study aimed to identify key
deregulated biological processes correlated with colorectal
adenoma. Pathways and gene ontology (GO) items with significantly
increased dysregulated genes were acquired with the hope of
providing novel targets for future molecular diagnostic tests.
Materials and methods
Microarray data
Microarray data were collected from the GEO database
(http://www.ncbi.nlm.nih.gov/geo/). One
dataset (GSE8671) was used for analysis. This dataset contained
32-paired normal mucosa colon and colorectal adenoma biopsy
samples. This dataset was based on the GPL570 platform: Affymetrix
Human Genome U133 Plus 2.0 Array (Affymetrix, Santa Clara, CA,
USA).
Detection of differentially-expressed
genes
Entire data sets, including CEL (the file storing
the results of the intensity calculations) and array annotation
files for the 64 samples from http://www.ncbi.nlm.nih.gov/geo/query/acc.cgi?acc=GSE8671
were downloaded. The CEL files were generated by Affymetrix DNA
microarray image analysis software and contained information
regarding all probes. Final quality control of arrays included
relative log expression (RLE) and normalized unscaled standard
errors from the AffyPLM package (http://www.bioconductor.org/). Arrays showing aberrant
RLE plots were excluded from the analysis.
CEL files included raw data generated from
satisfactory image files. Raw intensity values from the CEL files
were normalized by Robust Multi-array Analysis (RMA) (9) following three steps: First, the
effects of background noise and the processing artifacts were
neutralized with model-based background correction; second,
expression values were aligned to a common scale with quantile
normalization; and third, data were summarized and a single
expression value for each probe set was generated with an iterative
median polishing procedure. The resulting RMA expression value
(log2-transformed) was derived by probe set level
analysis from the raw data of the CEL files.
The log2-transformed RMA values for
control samples and case samples were stored separately to further
identify significantly differentially-expressed genes. Statistical
paired t-tests with multiple test correction (Benjamini-Hochberg
method) (10) were performed for
the case-control to detect differentially-expressed genes. The
threshold of significantly expressed genes was set at an FDR of
<0.01 and a |fold-change| value of >1 in this study.
Differentially-expressed probe sets were identified using
fold-change for upregulation or downregulation.
Differentially-expressed genes were hierarchically clustered with
average linkage and Euclidean distance as a measurement of
similarity. All aforementioned procedures were performed using R
statistical language (v3.0.1) software (www.r-project.org) with Bioconductor Packages
(http://www.bioconductor.org/) (11).
Pathway enrichment analysis
Selected probes from the Affymetrix Human Genome
U133 Plus 2.0 Array were annotated according to the annotation
files provided by Affymetrix. All genes were then mapped to Kyoto
Encyclopedia of Genes and Genomes pathways (http://www.genome.jp/kegg/) (12). Enrichment analysis was performed by
the hyper geometric distribution test to identify pathways
significantly enriched with differentially-expressed genes. The
observed class was the number of differentially-expressed genes to
the total number of genes in each family, while the expected class
was the number of all differentially-expressed genes to the total
gene number of all families.
GO analysis
The GO database (http://www.geneontology.org) was generated to address
the requirement for consistency when describing gene products. The
database was developed to contain three structurally controlled
vocabularies, which describe gene products according to their
associated biological processes, cellular components and molecular
functions. In this study all annotated probes were collected and
annotated by gene ontology for three types of functions: Cellular
components, molecular functions and biological processes. The
enrichment analysis was carried out in a similar way to the pathway
enrichment analysis. By using information obtained from the GO
database, the present study aimed to identify gene catergories that
were overrepresented by differentially expressed genes.
Results
Differential expression analyses
Subsequent to quality control, three samples (C13,
S11 and S27) were excluded from our analysis due to aberrant RLE
plots. Thus, differing from a previous study, which also used the
dataset GSE8671, only 29 pairs of arrays were included in the
analysis for the detection of differentially-expressed genes and
subsequent pathway enrichment analyses (4).
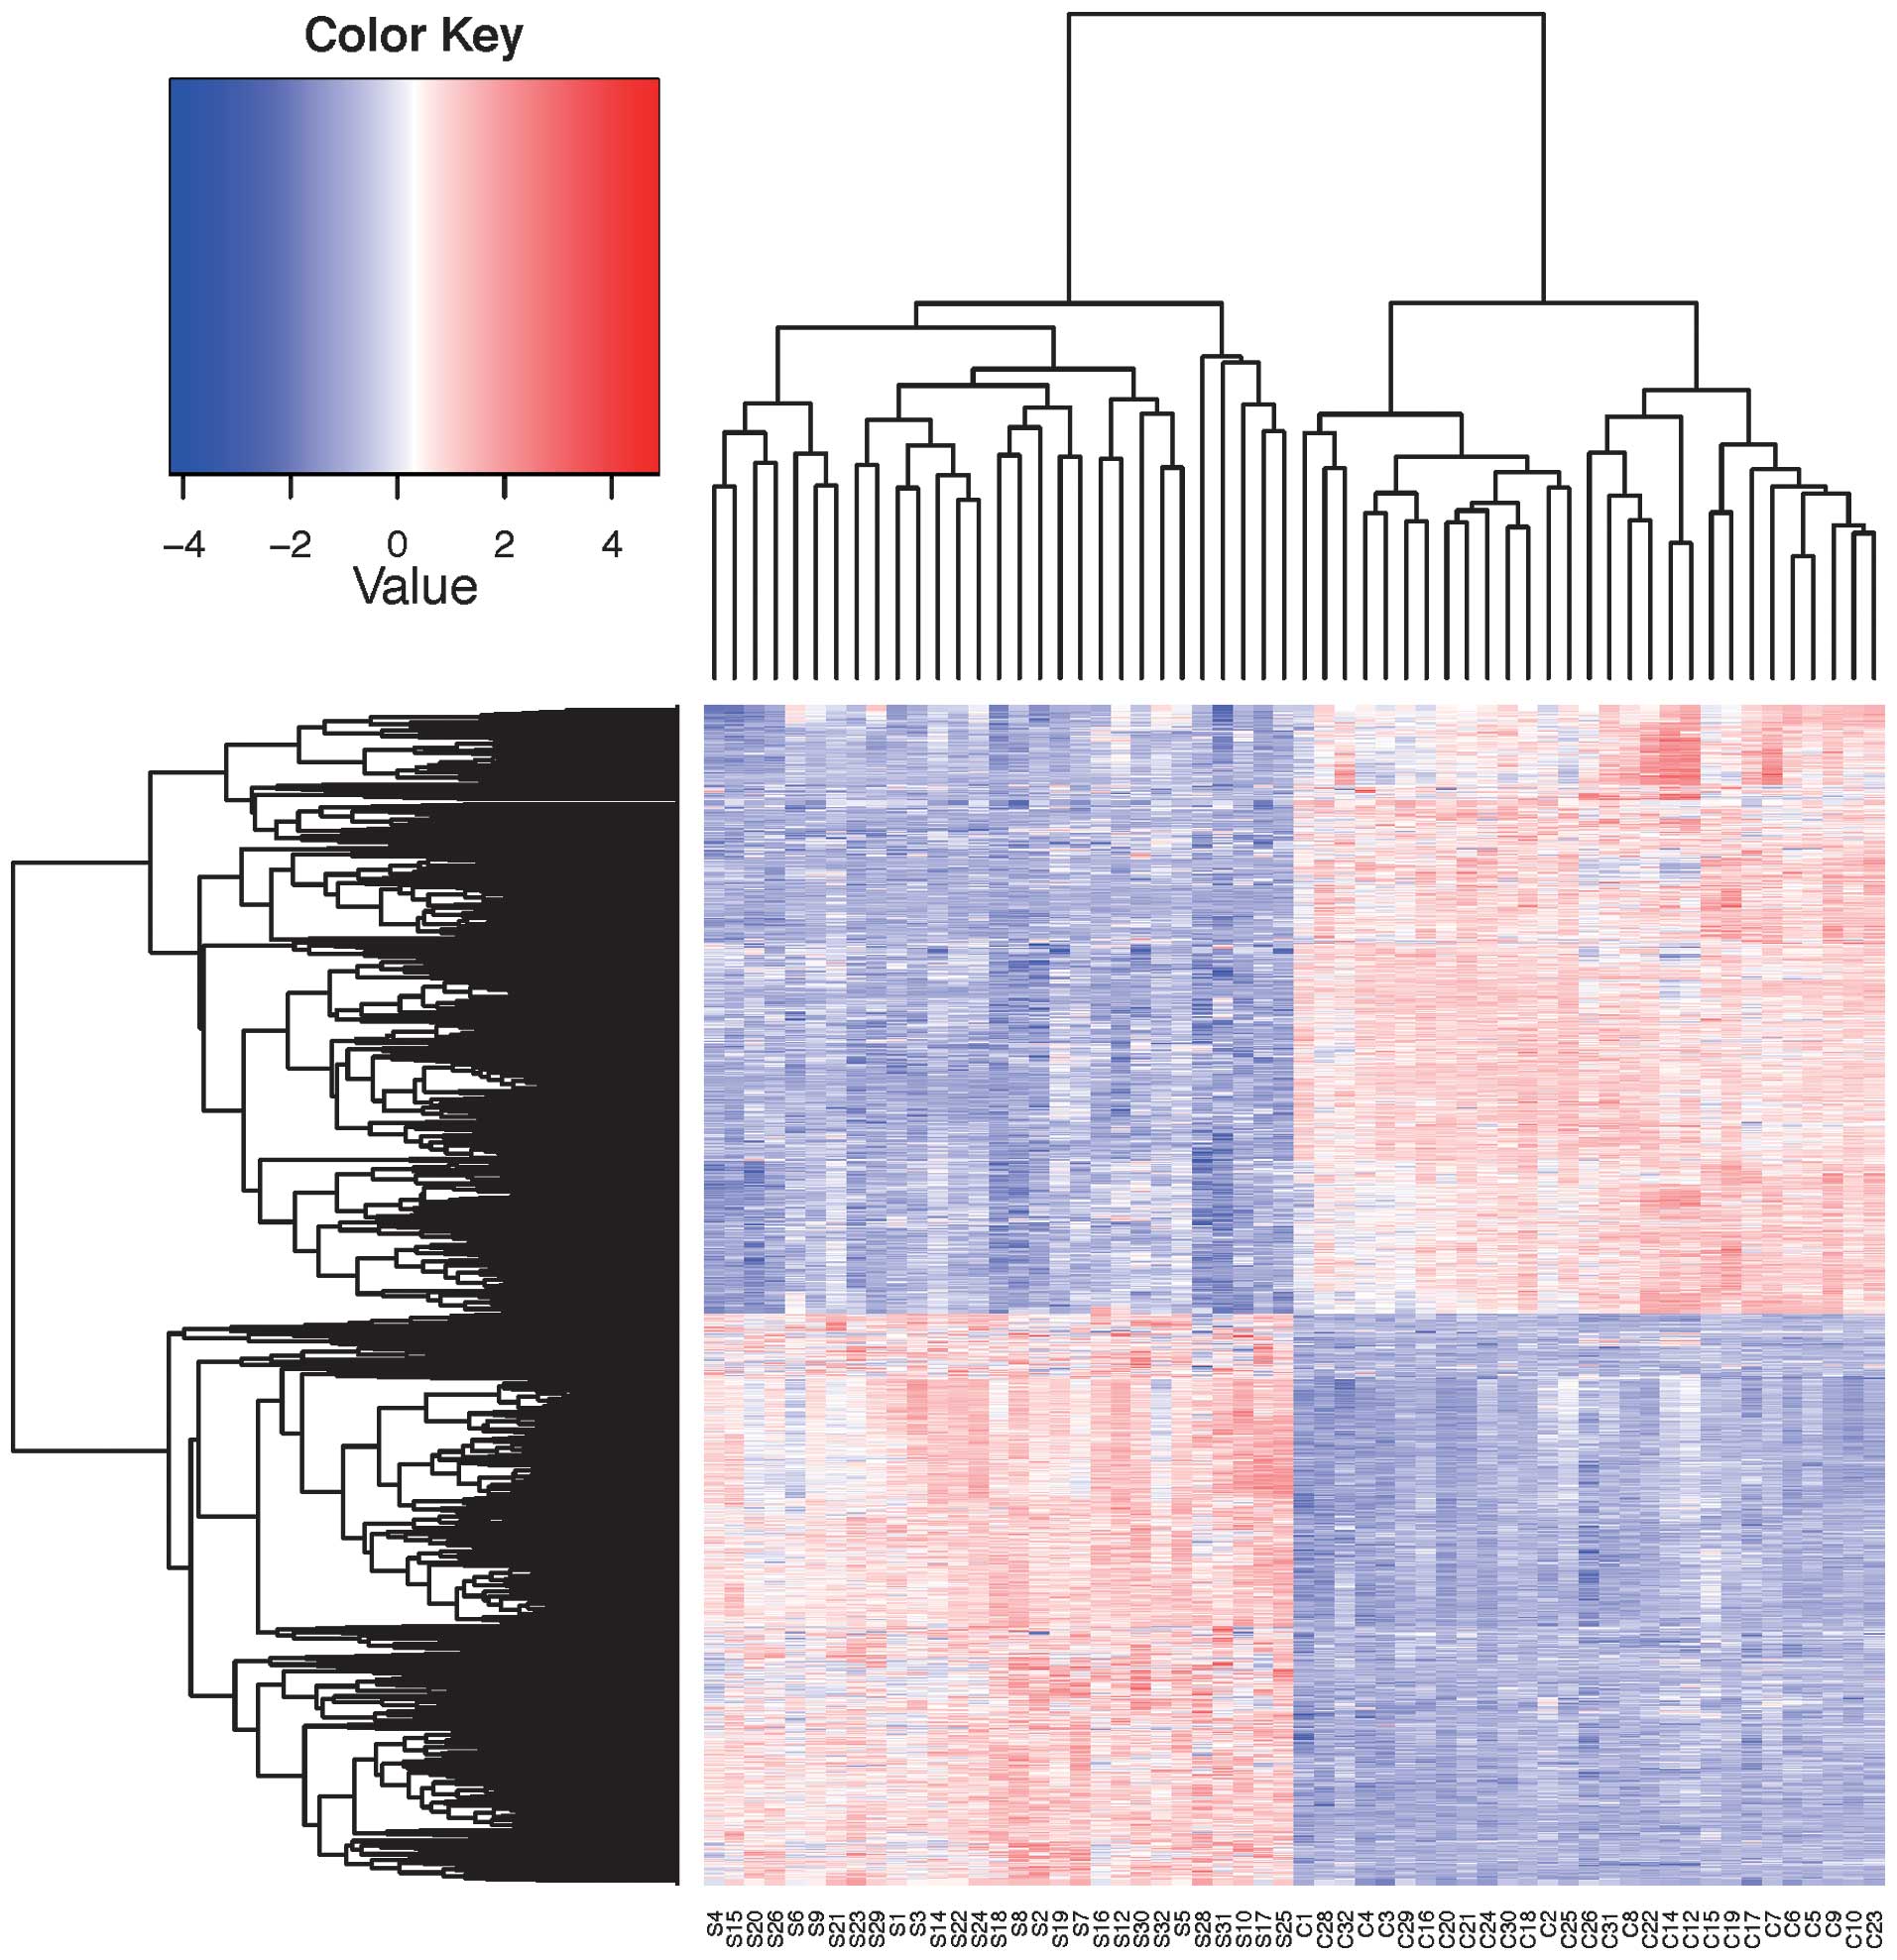
Compared with normal controls, 1,665 genes were
identified as differentially expressed in adenomatous tissues.
Among these, 808 exhibited upregulation and 857 exhibited
downregulation. Fig. 1 shows the
results of the 2D clustering analyses of all the
differentially-expressed genes. As shown in Fig. 1, the normal mucosa of the colon
samples and the patient colorectal adenoma biopsy can be largely
separated into two clusters.
GO analyses
GO analysis revealed that in the ‘Biological
Process’ principle, functions of the differentially-expressed genes
are focused on the multicellular organismal process (23.9%) and
response to stimulus (23.1%). In the ‘Molecular Function’
principle, the functions are mainly based on protein binding
(56.6%). In the ‘Cellular Component’ principle, the products of
those genes are primarily located on organelles. As listed in
Table I, a total of 18 Gene
ontology categories were significantly differentially expressed in
adenomas (vs. normal mucosa) with an FDR value of
<1.0×10⁻⁶.
 | Table IGO category significantly
differentially expressed in adenomas (vs. normal mucosa) with an
FDR value of <1.0E-6. |
Table I
GO category significantly
differentially expressed in adenomas (vs. normal mucosa) with an
FDR value of <1.0E-6.
| GO category | FDR | Altered genesa | Total genesb |
|---|
| Cellular
component |
| Extracellular
space |
6.45×10⁻¹⁷ | 163 | 842 |
| Extracellular
region |
1.51×10⁻¹³ | 228 | 1457 |
| Extracellular
matrix |
4.48×10⁻¹¹ | 53 | 186 |
| MHC class II protein
complex |
1.44×10⁻⁸ | 13 | 16 |
| Condensed chromosome
kinetochore |
5.21×10⁻⁸ | 26 | 67 |
| Kinetochore |
2.55×10⁻⁷ | 25 | 67 |
| Molecular
function |
| Chemokine
activity |
4.87×10⁻⁹ | 23 | 48 |
| MHC class II
receptor activity |
1.03×10⁻⁷ | 12 | 15 |
| Biological
process |
| Mitotic cell
cycle |
1.22×10⁻¹⁶ | 86 | 321 |
| Immune response |
2.54×10⁻¹⁵ | 85 | 331 |
| M phase of mitotic
cell cycle |
1.23×10⁻¹³ | 39 | 93 |
| Cell division |
6.67×10⁻¹³ | 74 | 293 |
| Mitotic
prometaphase |
2.64×10⁻¹¹ | 34 | 84 |
| DNA replication |
4.87×10⁻⁹ | 43 | 148 |
| Mitosis |
1.42×10⁻⁸ | 49 | 189 |
| Complement
activation, classical pathway |
3.23×10⁻⁸ | 19 | 36 |
| Complement
activation |
1.30×10⁻⁷ | 17 | 31 |
| DNA strand
elongation involved in DNA replication |
2.39×10⁻⁷ | 17 | 32 |
Pathway analyses
According to the enrichment analysis, 40 pathways
were enriched with differentially-expressed genes in adenomatous
tissues (P<0.05). As listed in Table II, following correction for
multiple comparisons, 19 pathways were identified as being
statistically important with regards to colorectal adenomatous
carcinogenesis, with an FDR value of <0.01. The top two
pathways, the Staphylococcus aureus infection pathway and
the intestinal immune network for immunoglobulin A (IgA) production
pathway were identified as the most statistically noteworthy
pathways at the early stage for colorectal tumorigenesis, with an
FDR value of <1.0×10⁻⁶.
| Table IIKEGG pathway significantly
differentially expressed in adenomas (vs. normal mucosa) with an
FDR value of <0.01. |
Table II
KEGG pathway significantly
differentially expressed in adenomas (vs. normal mucosa) with an
FDR value of <0.01.
| Pathway
description | Pathway subclass | FDR | Altered genesa | Total genesb |
|---|
| Staphylococcus
aureus infection | Infectious
diseases |
1.17×10⁻⁸ | 26 | 58 |
| Intestinal immune
network for IgA production | Immune system |
2.92×10⁻⁷ | 22 | 50 |
| Cell cycle | Cell growth and
death |
4.28×10⁻⁶ | 35 | 123 |
| Asthma | Immune diseases |
4.35×10⁻⁶ | 16 | 33 |
| DNA replication | Replication and
repair |
1.59×10⁻⁵ | 16 | 36 |
| Rheumatoid
arthritis | Immune diseases |
3.34×10⁻⁵ | 27 | 92 |
| Cell adhesion
molecules | Signaling molecules
and interaction |
3.34×10⁻⁵ | 36 | 143 |
| Graft-versus-host
disease | Immune diseases |
4.73×10⁻⁵ | 17 | 44 |
| Allograft
rejection | Immune diseases |
4.98×10⁻⁵ | 16 | 40 |
| Type I diabetes
mellitus | Endocrine and
metabolic diseases |
3.77×10⁻⁴ | 16 | 46 |
| Viral
myocarditis | Cardiovascular
diseases |
4.80×10⁻⁴ | 21 | 73 |
| Complement and
coagulation cascades | Immune system |
6.13×10⁻⁴ | 20 | 69 |
| Mineral
absorption | Digestive system |
7.15×10⁻⁴ | 16 | 49 |
| p53 signaling
pathway | Cell growth and
death |
1.45×10⁻³ | 19 | 68 |
| One carbon pool by
folate | Metabolism of
cofactors and vitamins |
2.01×10⁻³ | 9 | 20 |
| Hematopoietic cell
lineage | Immune system |
2.20×10⁻³ | 22 | 88 |
| Autoimmune thyroid
disease | Immune diseases |
2.59×10⁻³ | 16 | 55 |
| Leishmaniasis | Infectious
diseases |
4.61×10⁻³ | 19 | 75 |
| Cytokine-cytokine
receptor interaction | Signaling molecules
and interaction |
6.79×10⁻³ | 46 | 259 |
Discussion
The present study reanalyzed 32 pairs of
transcriptomic datasets collected from the GEO database in order to
characterize the normal mucosa of colon samples and patient
colorectal adenoma biopsies (4). By
comprehensively examining the differentially-expressed genes and
gene sets, and following multiple testing adjustments, the
Staphylococcus aureus infection pathway and the intestinal
immune network for IgA production pathway were highlighted to be in
close association with colorectal adenoma.
The intestinal mucosa contains an intact immune
system that protects the host from pathogens (13). Staphylococcus aureus is a
bacterial pathogen that is commonly attached to the human mucosa,
and whose secreted proteins and surface components can compromise
innate immune responses (14). In
the present study, compared with the normal mucosa, the biopsies of
colorectal adenoma exhibited downregulated expression of the FCGR2B
gene that encodes a type of IgG Fc receptor, FcγRIIB, whose
expression has been indicated to be crucial for the regulation of
the B cell recall response and the B cell repertoire (15,16).
Dysregulated expression of complement cascade-related genes was
also found, including genes involved in the classical complement
pathways, such as C3 (downregulated), C1S (downregulated), C1QA,
C1QB and C1QC (downregulated), and CFI (upregulated), as well as
genes involved in alternative complement pathways, such as CFH
(downregulated) and CFB (upregulated). The downregulation of C1S,
C1Q and C3 (complement components), and the upregulation of CFI
(complement component inactivator) indicated the inhibition of the
complement system and the susceptibility to bacterial infection
(17), while the dysregulation of
the CFB and CFH genes indicated the regulation of complement
activation (18).
In previous studies, various forms of
Helicobacter pylori infection were reported to confer an
increased risk for colonic neoplasms (19), leading to the understanding that
bacteria-induced infection may promote tumorigenesis. To the best
of our knowledge, the present study is the first to present the
association between Staphylococcus aureus infection and
colorectal adenoma. However, it cannot be determined whether the
correlation indicates that the presence of Staphylococcus
aureus infection may affect colorectal tumorigenesis or whether
colorectal adenoma has an increased susceptibility to
Staphylococcus aureus colonization, as adenomatous cells may
interact with the mucosal immune system (20,21).
Further investigation is therefore necessary.
In addition, the present results showed that in the
colorectal adenoma biopsy samples, the expression of the majority
of genes in the intestinal immune network for IgA production
pathway was lower than that in the normal mucosa. IgA is produced
in large amounts in the large intestine, and is commonly recognized
as the most prevalent antibody in mucosal defense (22,23).
It is likely that the impairment of IgA production may drive
further inflammatory responses and promote tumor growth. The
present study observed that in the IgA production pathway, a total
of 22 genes were consistently downregulated. These included a
series of human leukocyte antigen (HLA) class II genes (HLA-DOA,
DPA1, DPB1, DQA1, DQA2, DQB1, DMB, DRA, DRB1, DRB3, DRB4, and
DRB5). These genes encode major histocompatibility complex class II
molecules in antigen presenting cells (B lymphocytes, dendritic
cells and macrophages), which are important for the proliferation
and differentiation of B cells. Additionally, the function of other
differentially-expressed genes ranged from T cell activation to B
cell development and migration, such as genes CCL28, CXCR4, CXCL12
and ITGA4, which play a significant role in IgA-secreting cell
migration. This finding was consistent with a prior study that
showed the impaired migration of IgA-secreting cells to colon
tumors (20).
In summary, the present results indicated
involvement between the Staphylococcus aureus infection
pathway and the intestinal immune network for IgA production
pathway in colorectal adenomatous carcinogenesis. Future validation
studies are necessary to clarify the role of mucosal immunity in
colorectal cancer.
References
|
1
|
Cancer Genome Atlas Network. Comprehensive
molecular characterization of human colon and rectal cancer.
Nature. 487:330–337. 2012.
|
|
2
|
Siegel R, Naishadham D and Jemal A: Cancer
statistics, 2013. CA Cancer J Clin. 63:11–30. 2013.
|
|
3
|
Verdecchia A, Francisci S, Brenner H, et
al: EUROCARE-4 Working Group: Recent cancer survival in Europe: a
2000–02 period analysis of EUROCARE-4 data. Lancet Oncol.
8:784–796. 2007.
|
|
4
|
Sabates-Bellver J, Van der Flier LG, de
Palo M, et al: Transcriptome profile of human colorectal adenomas.
Mol Cancer Res. 5:1263–1275. 2007.
|
|
5
|
Notterman DA, Alon U, Sierk AJ and Levine
AJ: Transcriptional gene expression profiles of colorectal adenoma,
adenocarcinoma, and normal tissue examined by oligonucleotide
arrays. Cancer Res. 61:3124–3130. 2001.
|
|
6
|
Nosho K, Yamamoto H, Adachi Y, Endo T,
Hinoda Y and Imai K: Gene expression profiling of colorectal
adenomas and early invasive carcinomas by cDNA array analysis. Br J
Cancer. 92:1193–1200. 2005.
|
|
7
|
Lechner S, Müller-Ladner U, Renke B,
Schölmerich J, Rüschoff J and Kullmann F: Gene expression pattern
of laser microdissected colonic crypts of adenomas with low grade
dysplasia. Gut. 52:1148–1153. 2003.
|
|
8
|
Lin YM, Furukawa Y, Tsunoda T, Yue CT,
Yang KC and Nakamura Y: Molecular diagnosis of colorectal tumors by
expression profiles of 50 genes expressed differentially in
adenomas and carcinomas. Oncogene. 21:4120–4128. 2002.
|
|
9
|
Irizarry RA, Hobbs B, Collin F, et al:
Exploration, normalization, and summaries of high density
oligonucleotide array probe level data. Biostatistics. 4:249–264.
2003.
|
|
10
|
Benjamini Y and Hochberg Y: Controlling
the false discovery rate: A practical and powerful approach to
multiple testing. J Roy Statist Soc Ser B (Methodological).
289–300. 1995.
|
|
11
|
Smyth GK, Michaud J and Scott HS: Use of
within-array replicate spots for assessing differential expression
in microarray experiments. Bioinformatics. 21:2067–2075. 2005.
|
|
12
|
Kanehisa M, Goto S, Sato Y, Furumichi M
and Tanabe M: KEGG for integration and interpretation of
large-scale molecular data sets. Nucleic Acids Res. 40:D109–D114.
2012.
|
|
13
|
Kim-Schulze S, Kim HS, Wainstein A, et al:
Intrarectal vaccination with recombinant vaccinia virus expressing
carcinoembronic antigen induces mucosal and systemic immunity and
prevents progression of colorectal cancer. J Immunol.
181:8112–8119. 2008.
|
|
14
|
Moretó M and Pérez-Bosque A: Dietary
plasma proteins, the intestinal immune system, and the barrier
functions of the intestinal mucosa. J Anim Sci. 87(14 Suppl):
E92–E100. 2009.
|
|
15
|
Qin D, Wu J, Vora KA, et al: Fc gamma
receptor IIB on follicular dendritic cells regulates the B cell
recall response. J Immunol. 164:6268–6275. 2000.
|
|
16
|
Lehmann B, Schwab I, Böhm S, Lux A,
Biburger M and Nimmerjahn F: FcγRIIB: a modulator of cell
activation and humoral tolerance. Expert Rev Clin Immunol.
8:243–254. 2012.
|
|
17
|
Nilsson SC, Trouw LA, Renault N, et al:
Genetic, molecular and functional analyses of complement factor I
deficiency. Eur J Immunol. 39:310–323. 2009.
|
|
18
|
Buentello-Volante B, Rodriguez-Ruiz G,
Miranda-Duarte A, et al: Susceptibility to advanced age-related
macular degeneration and alleles of complement factor H, complement
factor B, complement component 2, complement component 3, and
age-related maculopathy susceptibility 2 genes in a Mexican
population. Mol Vis. 18:2518–2525. 2012.
|
|
19
|
Inoue I, Mukoubayashi C, Yoshimura N, et
al: Elevated risk of colorectal adenoma with Helicobacter
pylori-related chronic gastritis: a population-based
case-control study. Int J Cancer. 129:2704–2711. 2011.
|
|
20
|
Muthuswamy RV, Sundström P, Börjesson L,
Gustavsson B and Quiding-Järbrink M: Impaired migration of
IgA-secreting cells to colon adenocarcinomas. Cancer Immunol
Immunother. 62:989–997. 2013.
|
|
21
|
Cui G, Shi Y, Cui J, Tang F and Florholmen
J: Immune microenvironmental shift along human colorectal
adenoma-carcinoma sequence: is it relevant to tumor development,
biomarkers and biotherapeutic targets? Scand J Gastroenterol.
47:367–377. 2012.
|
|
22
|
Macpherson AJ, McCoy KD, Johansen FE and
Brandtzaeg P: The immune geography of IgA induction and function.
Mucosal Immunol. 1:11–22. 2008.
|
|
23
|
Corthesy B: Role of secretory
immunoglobulin A and secretory component in the protection of
mucosal surfaces. Future Microbiol. 5:817–829. 2010.
|