Introduction
Chemotherapy is important in the treatment of
various human cancer types; however, numerous patients do not
exhibit a satisfactory outcome following treatment (1,2). A major
obstacle to successful chemotherapy is the development of multidrug
resistance (MDR) in response to the treatment (1,2). An
underlying mechanism of MDR is cellular overexpression of
P-glycoprotein (P-gp), which is a 170-kDa transmembrane
glycoprotein encoded by the MDR1 gene, functioning as an
efflux pump for numerous anticancer drugs (3). P-gp overexpresses on tumor cell
surfaces, thus promoting the efflux of cytotoxic drugs out of these
cells in an energy-dependent manner. Therefore, drug accumulation
in the cells is reduced and MDR is increased. Upon the development
of MDR, tumor cells are resistant to multiple chemotherapeutic
drugs and reversing this process is difficult (4,5). A number
of researchers have attempted to design novel approaches in order
to monitor the development of MDR throughout the chemotherapeutic
process (3,6,7).
Following the completion of the Human Genome
Project, the biotechnology sector entered a novel, post-genomic
era. Certain researchers emphasized on genomics, transcriptomics
and proteomics, in succession; however, combining these methods did
not provide answers to numerous important problems (8). A number of studies have attempted to
develop novel approaches in order to explain these problems, giving
rise to metabolomics, which may be a more comprehensive method for
the interpretation of experimental data (9). Creating quantitative databases of
metabolites may sufficiently reflect the metabolic systems in
action and provide an understanding into how metabolism is
functioning in each individual (10).
Metabolomic analysis is applicable to various fields of
biotechnology; although this method is novel, it has received
increasing attention and its role in the post-genomic era is
important. Metabolomics can provide a chemical ‘snapshot’ of an
organism's metabolic state through the measurement of small
molecule metabolites (11,12).
Nuclear magnetic resonance (NMR) spectroscopy is a
powerful tool in the rapidly growing field of metabolomics, since
it does not damage the structure and nature of the samples and can
be detected dynamically (13).
Testing biological samples using NMR provides a large amount of
information on various biomarkers. In order to fully extract the
potential information in the data, chemometric and multivariate
statistical analyses are required. Unsupervised principal component
analysis (PCA) and supervised partial least squares discriminant
analysis (PLS-DA) are the main methods used in this field (14). Previous studies have used PCA to
investigate metabolic differentiation, as well as the description
and recognition of the dynamic multivariate metabolism (14,15).
Similarly, PLS-DA has been previously used for the analysis of
metabolic changes (16). Currently,
NMR-based metabolomics is applied in several fields, including the
study of plants (17–19), blood plasma (20,21), urine
(22) and cancer (23–26). In
the present study, carboplatin (CBP) and pingyangmycin (PYM) were
used to induce MDR of the oral squamous cell line, Tca8113, by
applying an increasing concentration for a period of six months.
The extracellular metabolic differences of drug resistant and
parental cells were assessed by 1H NMR-based metabolomic
analysis to provide a novel approach for monitoring the development
of MDR during chemotherapy.
Materials and methods
Drugs and chemicals
CBP was purchased from Qilu Pharmaceutical Co., Ltd.
(Jinan, China), while PYM was obtained from Tianjin Taihe
Pharmaceutical Co., Ltd. (Tianjin, China). In addition, paclitaxel
(≥97%) was purchased from Sigma-Aldrich (St. Louis, MO, USA),
doxorubicin was obtained from Shenzhen Main Luck Pharmaceuticals
Inc. (Shenzhen, China), deuterium oxide (D2O; ≥99.8%)
was purchased from Norell®, Inc. (Landisville, NJ, USA), and fetal
calf serum (FCS) was a product of Lanzhou National Hyclone
Bio-Engineering Materials Co., Ltd. (Lanzhou, China). All the other
chemicals were of the highest grade commercially available.
Furthermore, drugs were adjusted to appropriate concentrations in
the culture medium and stored at 0°C until further use.
Cell culture
The human oral squamous carcinoma cell line,
Tca8113, was obtained from the State Key Laboratory of Oral
Diseases (Chengdu, China). Cells were cultured by seeding the
culture flask (Corning® T-75; Corning Incorporated, Corning, NY,
USA) at a density of 104 cells/ml in RPMI 1640 medium
(Hyclone Laboratories, Logan, UT, USA), supplemented with 10%
heat-inactivated FCS and penicillin/streptomycin (100 U/ml; GE
Healthcare Life Sciences, Logan, UT, USA) in a humidified
atmosphere of 5% CO2 at 37°C. The medium was refreshed
every 2 or 3 days and the cells were trypsinized using 0.25%
trypsin (GE Healthcare Life Sciences) and 0.02% EDTA when the cells
reached 80–90% confluence. The FCS and other media used in this
study were from the same batch.
In vitro selection of drug resistant
Tca8113/CBP and Tca8113/PYM cells
The Tca8113 cell line was maintained in culture
medium supplemented with 0.3 µg/ml CBP (Tca8113/CBP) or 0.3 µg/ml
PYM (Tca8113/PYM) as the starting concentration. Upon reaching a
density of 5×10⁶ cells/ml, the samples were resuspended
in a 75 cm2 culture flask and the drug dose was
increased. After ~6 months and 40 passages, this intermittent means
of increasing the drug concentration led to a final concentration
of 10 µg/ml CBP and 5 µg/ml PYM.
Immunohistochemical analysis
Parental cells (Tca8113) and the chemotherapy
resistant cell lines (Tca8113/CBP and Tca8113/PYM) were seeded at a
density of 5×10⁴ cells/well in 6-well plates containing
preplaced coverslips and grown for 72 h. The coverslips were fixed
in 4% paraformaldehyde for 30 min, followed by 0.25% Triton X-100
(Amresco, LLC, Solon, OH, USA) for 15 min. Next, the samples were
treated with 3% H2O2 for 30 min and rinsed
three times in phosphate buffered saline (PBS; pH 7.4) for 5 min
each time. The coverslips were then incubated with monoclonal mouse
anti-human P-gp primary antibodies (1:100; cat. no. sc-13131; Santa
Cruz Biotechnology, Inc., Dallas, TX, USA) in a humidified chamber
at 37°C for 2 h. Subsequent to washing with PBS, the coverslips
were incubated with secondary polyclonal goat anti-mouse or
anti-rabbit IgG (cat. no. SA1020; Wuhan Boster Biological
Engineering Co., Ltd., Wuhan, China) antibodies for an additional
30 min at 37°C. Finally, the cells were visualized using
3,3′-diaminobenzidine (Thermo Fisher Scientific Inc., Rockford, IL,
USA) and lightly counterstained using Mayer's hematoxylin (Beijing
Taize Technology Development Co., Ltd., Beijing, China). The
coverslips were then mounted with Permount™ mounting medium (Thermo
Fisher Scientific Inc., Fair Lawn, NJ, USA) and images were
captured using a microscope (Eclipse 80i; Nikon Corporation, Tokyo,
Japan) (3).
Drug sensitivity assay
Parental cells and the two chemotherapy resistant
cell lines were seeded at a density of 2×10⁴ cells/well
in 96-well plates. After culturing overnight, the medium was
replaced with maintenance medium containing 10 µg/ml CBP, 5 µg/ml
PYM, 2 nM paclitaxel and 4 µg/ml doxorubicin. Cell viability was
assessed after 72 h using an MTT colorimetric assay. Briefly, the
cells were washed with 300 µl PBS, followed by incubation with 20
µl MTT (5 mg/ml) in 200 µl RPMI 1640 medium at 37°C for 3 h. The
formazan product was dissolved in 200 µl dimethyl sulfoxide and
quantified by measuring the optical absorbance (OA) at 570 nm using
an ELISA plate reader (Thermo Electron Type 1500; Thermo Fisher
Scientific Inc.). Cell viability was expressed as the percent ratio
of OAtreated vs. OAuntreared control.
Subsequently, the concentration curve was constructed by plotting
the percentage of viable cells at each point against the drug
concentration. The 50% inhibiting concentration (IC50)
values were calculated using linear regression analysis and
IC50 values were considered to indicate the drug
sensitivity, where low IC50 values indicate high drug
sensitivity and high IC50 values indicate low drug
sensitivity (3).
Extraction of extracellular
metabolites
Parental cells and the two chemotherapy resistant
cell lines were cultured at a density of 5×10⁴ cells/ml
in a humidified atmosphere of 5% CO2 at 37°C. The medium
was collected and centrifuged three times at 15,900 × g at 4°C for
10 min after the cells reached 80–90% confluence. The supernatant
(1 ml) and 0.5 ml 0.2 M sodium phosphate buffer were mixed and left
to stand for 10 min at 4°C. Next, a 500 µl mixture was
reconstituted into 750 µl with D2O (250 µl), following
further centrifugation at 15,900 × g for 10 min at 4°C. Subsequent
to vortexing, each sample was imbibed for 500 µl and then pipetted
into a 5 mm NMR tube. All the samples were stored at −80°C prior to
the 1H NMR analysis.
1H NMR spectroscopy
Data from the original free induction decay (FID)
signal were acquired at 37°C using a Bruker Avance II 600
spectrometer (Bruker Biospin GmbH, Rheinstetten, Germany), which
was operated at 600.13 MHz with a 5-mm PATXI probe. The spectra
were obtained using a pulse sequence (Bruker Biospin GmbH), which
attenuated the broad protein signals in the samples, producing
spectra with flat baselines. A Carr-Purcell-Meiboom-Gill (CPMG)
pulse sequence modification was used in this study to suppress the
residual water signal (27), and this
sequence was CPMGPR1D.
Next, one-dimensional (1D) 1H NMR spectra
were collected for each sample, consisting of 64 K data points, 64
scans and 15-ppm spectral width. Further acquisition parameters
included a 5-sec relaxation delay, 8 dummy scans, 400 µsec fixed
echo time for elimination of J-mod and 400 CPMG loops for T2 filter
(28). Subsequently, the NMR spectra
acquired were manually corrected with lactate doublet as a
reference at 1.33 ppm for the phase and baseline, using the TopSpin
1.3 software (Bruker Biospin GmbH).
These FID data were processed using MestReC software
(version 4.8.1.1; Mestrelab Research, Santiago de Compostela,
Spain) to obtain the original and satisfactory 1D NMR spectra by
Fourier transformation, phase adjustment and baseline adjustment.
Each 1H NMR spectrum was automatically reduced to 242
integrated segments of equal width (0.04 ppm). Spectra with a range
of 0.00–10.00 ppm, with the exception of residual water resonance
(4.5–4.8 ppm), were segmented into 0.04 ppm wide bins, followed by
importing the achieved integral values into Microsoft® Excel
(Microsoft Corporation, Redmond, WA, USA).
PCA
PCA is an unsupervised analysis method that
transforms multi-index into several irrelevant indicators by linear
transformation using an idea of dimension reduction in order to
reduce the complexity. The integral data were grouped and sorted,
and then the spectral intensity was normalized to a unit area with
the appropriate weighting coefficients in Microsoft® Excel
spreadsheets prior to importing into the SIMCA-P v11.0 software
package (Umetrics AB, Umeå, Sweden) for multivariate data analysis.
PCA was conducted for the entire dataset using mean-centered data.
The score plot revealed that the separation and clusters associated
with the three groups: Tca8113 cells, Tca8113/CBP and
Tca8113/PYM.
PLS-DA
PLS-DA, a variant of the partial least squares (PLS)
regression, is a supervised chemometric method (29). PLS-DA indicated the presence of group
separation, as well as helped establish whether the separation
between the clusters was significant through the plots of PLS-DA
coefficient and the variable influence on projection (VIP). This
method is more advantageous compared with PCA, as it can reduce the
noise of two blocks of variables, identify the missing data and
handle the colinearity among the variables (30,31).
Statistical analysis
Data are expressed as the mean ± standard deviation.
Statistical analysis of the results was performed using analysis of
variance and post-hoc multiple comparison tests with the SPSS
version 10.0 software (SPSS, Inc., Chicago, IL, USA). P<0.05 was
considered to indicate a statistically significant difference.
Results
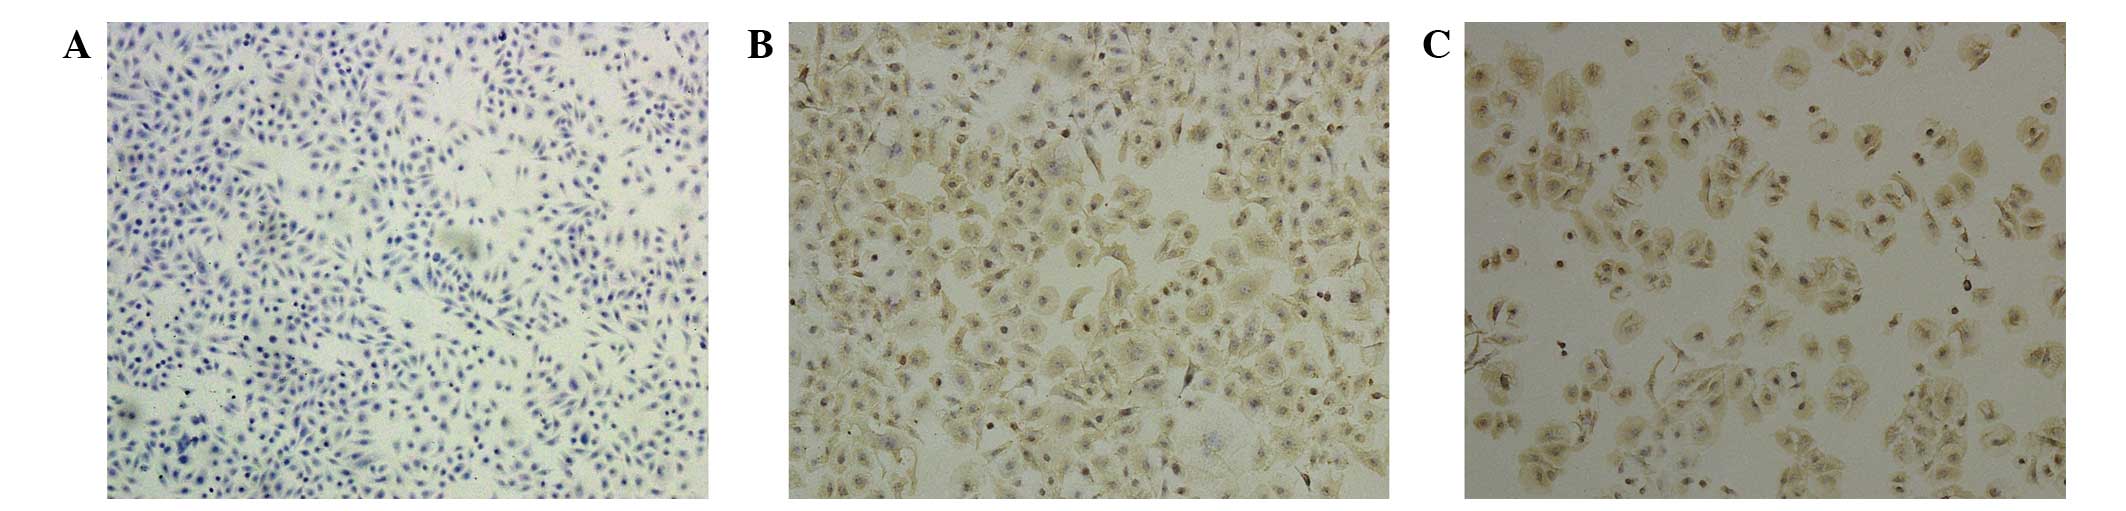
Immunohistochemical analysis
Compared with the parental cells (Fig. 1A), the drug-induced Tca8113/CBP and
Tca8113/PYM cell lines expressed high levels of P-gp, which was
loaded into the cytoplasm and membrane (Fig. 1B and C). In addition, the morphology
of the drug-induced cells revealed an increased cytoplasmic area
(Fig. 1)
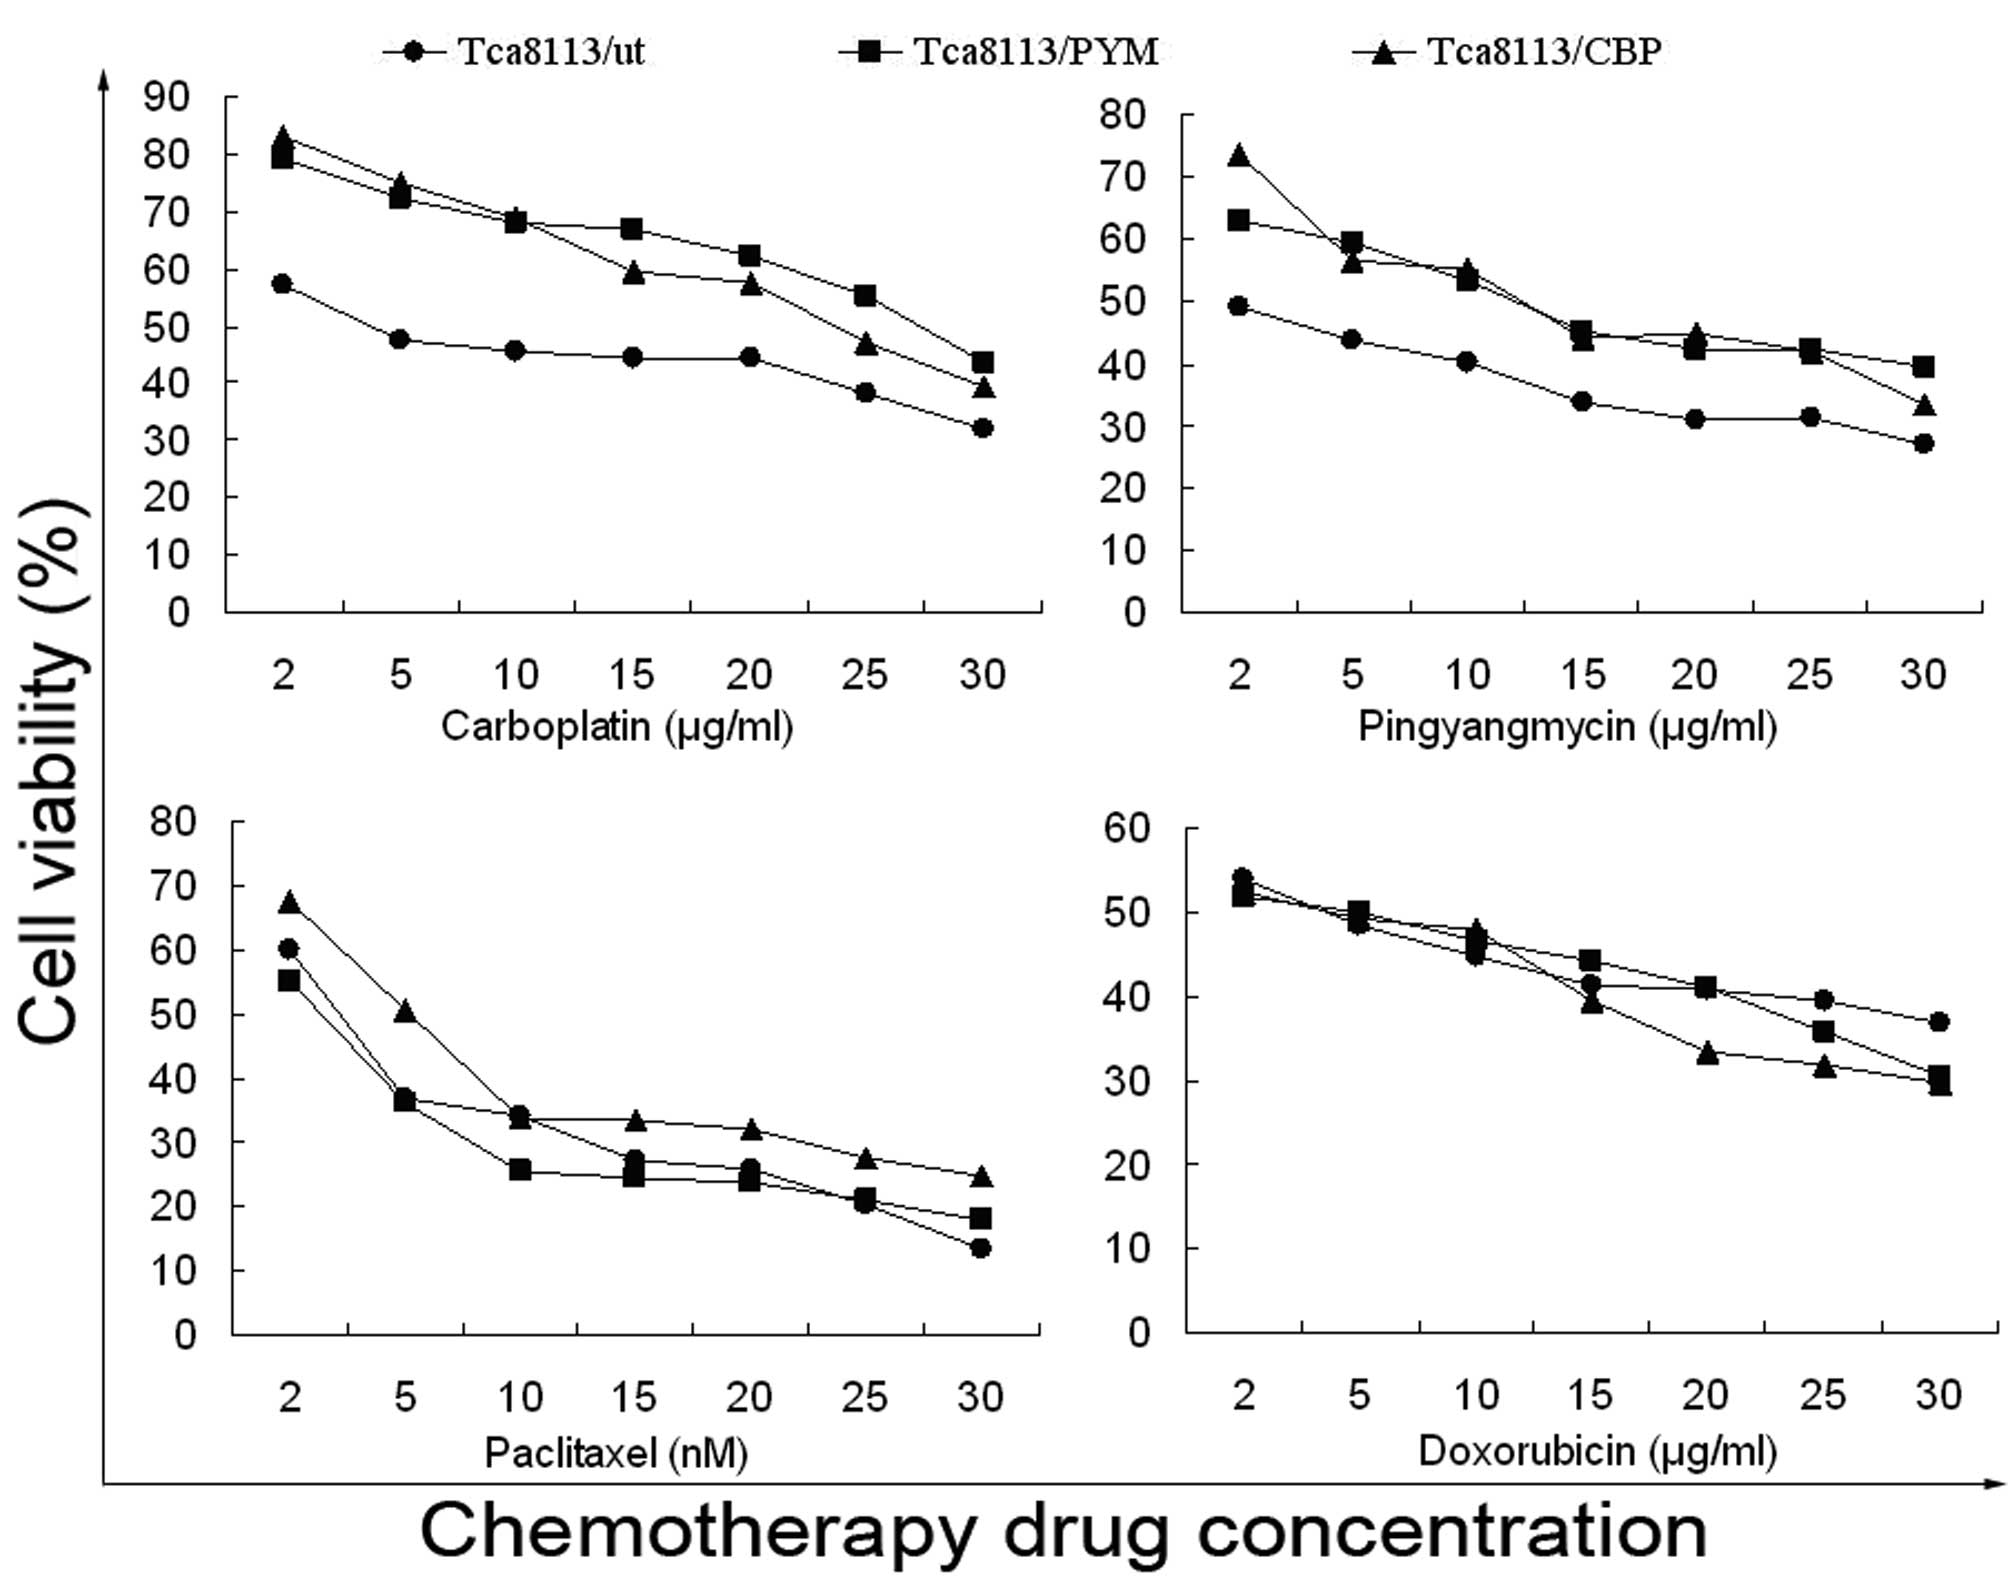
Drug sensitivity of Tca8113 cells
Drug sensitivity was represented by the
IC50 values. Drug-induced cells had a significantly
higher IC50 value for the drugs compared with parental
cells (Table I). Furthermore, these
cells demonstrated primary-drug resistance, as well as
cross-resistance. Therefore, considering the immunohistochemical
results and IC50 values, these drug-induced cells appear
to present MDR (Fig. 2; Table I).
 | Table I.Sensitivity of cell lines to
anticancer drugs, observed by quantification of the drug
IC50 values for the three cell lines. |
Table I.
Sensitivity of cell lines to
anticancer drugs, observed by quantification of the drug
IC50 values for the three cell lines.
|
| IC50
value |
|---|
|
|---|
| Drug | Tca8113/ut |
Tca8113/CBPTca8113/PYM |
|---|
| CBP (µg/ml) |
6.99±0.34 |
22.63±0.15a |
28.02±0.17b,c |
| PYM (µg/ml) |
1.19±0.27 |
15.29±0.26a |
14.16±0.08b,c |
| Paclitaxel
(nM) |
1.07±0.14 |
6.35±0.24a |
4.69±0.11b,c |
| Doxorubicin
(µg/ml) |
3.54±0.13 |
4.48±0.19a |
5.45±0.23b,c |
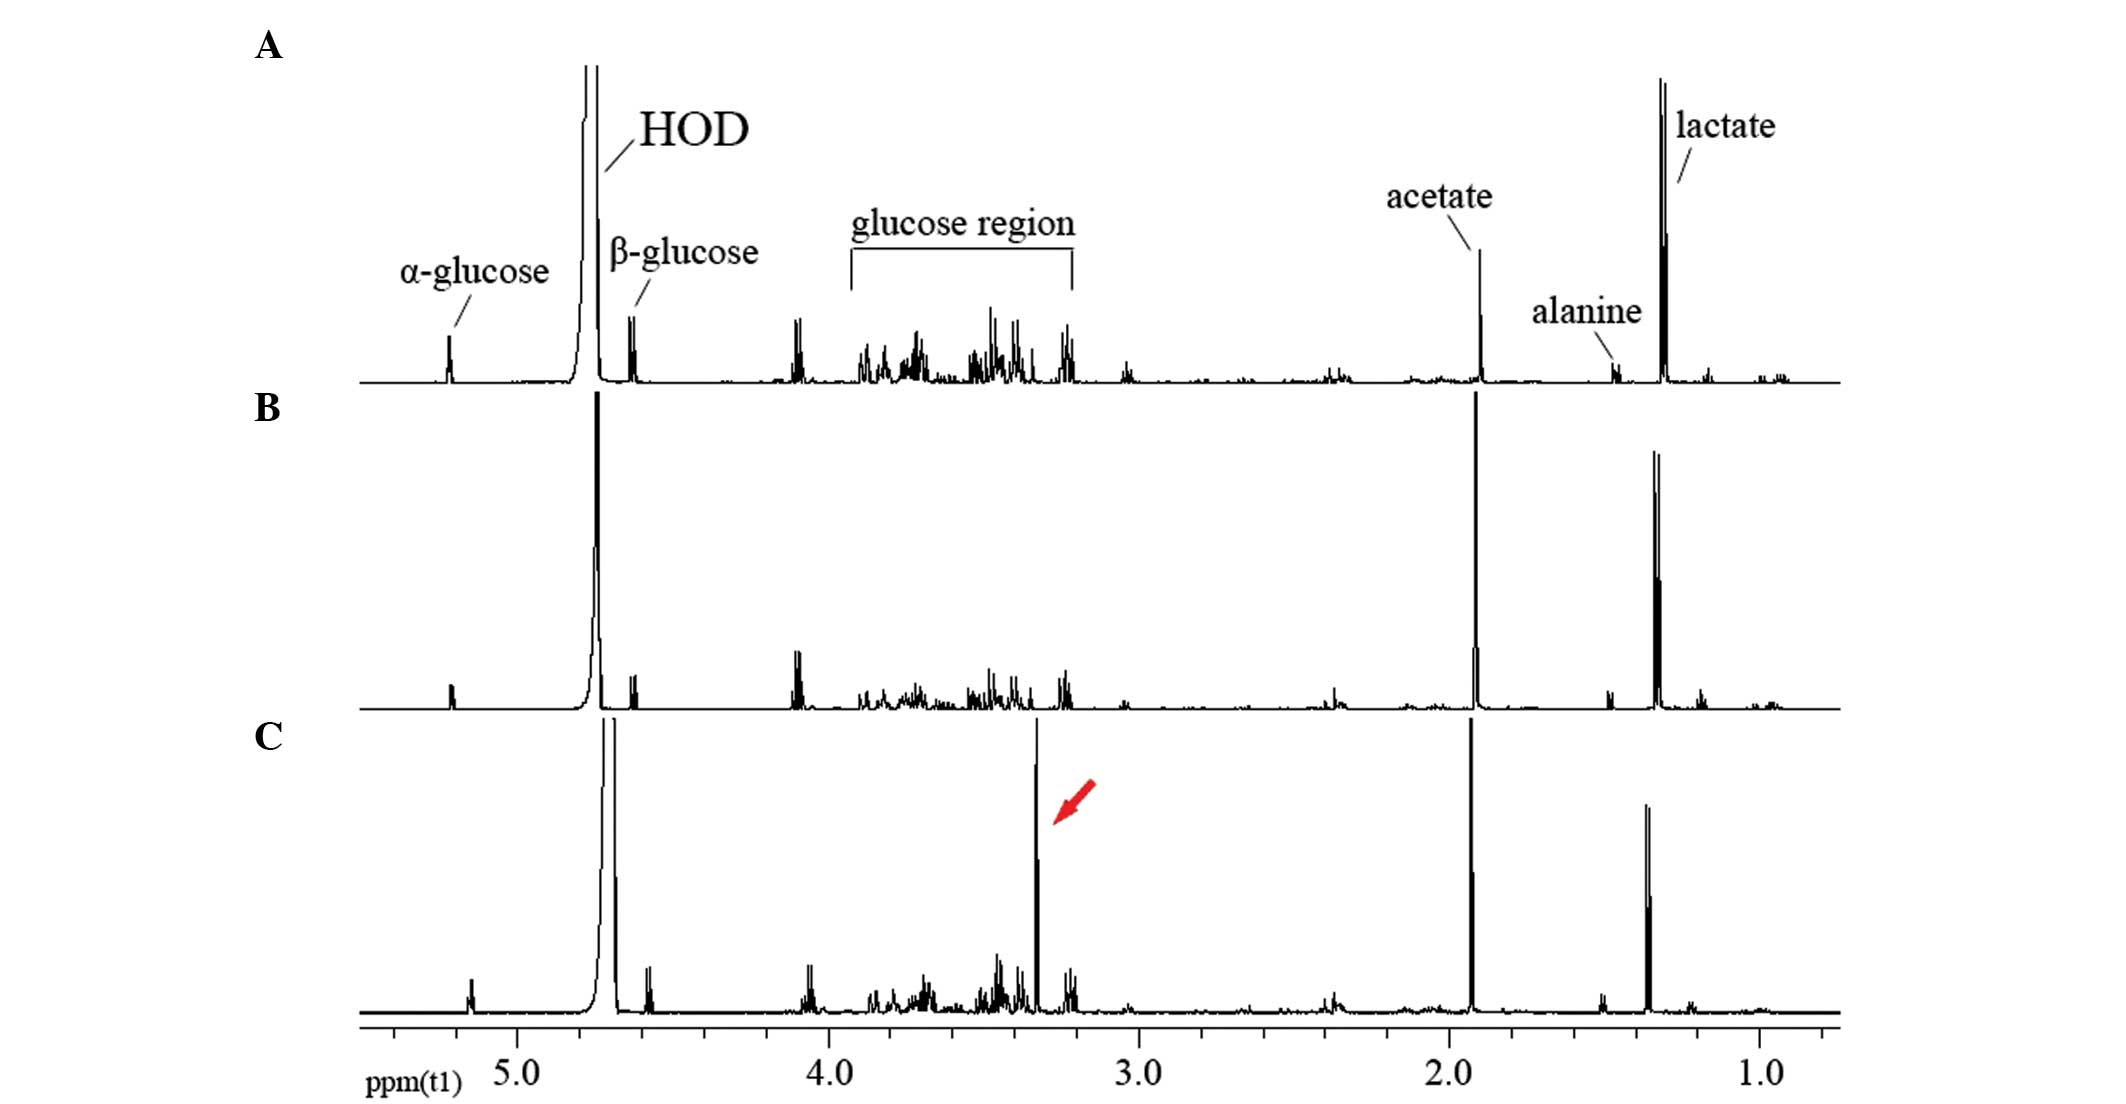
Characteristics of the 1H
NMR spectra
The 1H NMR spectra of the extracellular
metabolites demonstrated abundant and significant information
regarding the cell lines (Fig. 3).
Regions of most significant metabolite signals were typically in
the range of δ 0–5.4 ppm, whereas the region of chemical shift δ
5.5–10.0 ppm revealed relatively weak signals. In addition, the
acetate content was higher compared with the lactate levels in the
drug-resistant cells (Fig. 3B and C);
however, the opposite was true in the parental Tca8113 cells
(Fig. 3A). The content of δ 3.35 ppm
(arrow; Fig. 3C) was also relatively
higher and this substance was tentatively identified as a type of
myo-inositol (32). Studies regarding
low-molecular weight metabolites have already been published
(33,34). To further determine any differences
between the drug-resistant and parental Tca8113 cells, specialized
software was used for chemometric analysis.
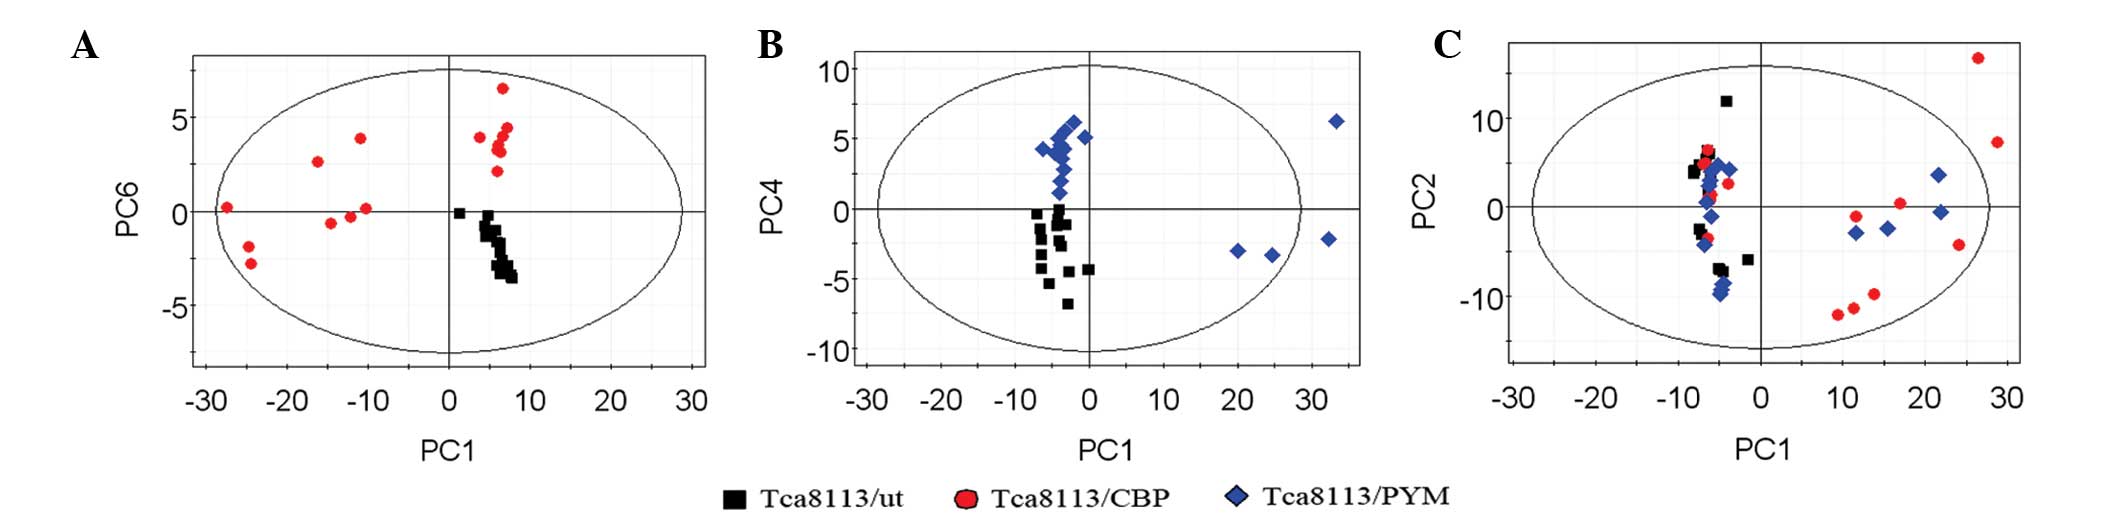
PCA of extracellular metabolites
Subsequent to analyzing the data by PCA, new
principal component (PC) variables were created, which explained
>85% of the original data that were considered to be meaningful
(Fig. 4A–C). The score plot obtained
from the PCA displayed how the samples in the same group were
situated with respect to each other. Adjacent observations were
similar, while distant observations indicated their similarity was
much worse. As shown in Fig. 4, the
scores of PC1 and PC6, as well as of PC1 and PC4, were completely
independent (Fig. 4A and B). However,
the three cell lines were not completely separated using the PCA
method (Fig. 4C). Thus, in order to
obtain further information from the data, supervised PLS-DA was
performed.
PLS-DA of extracellular
metabolites
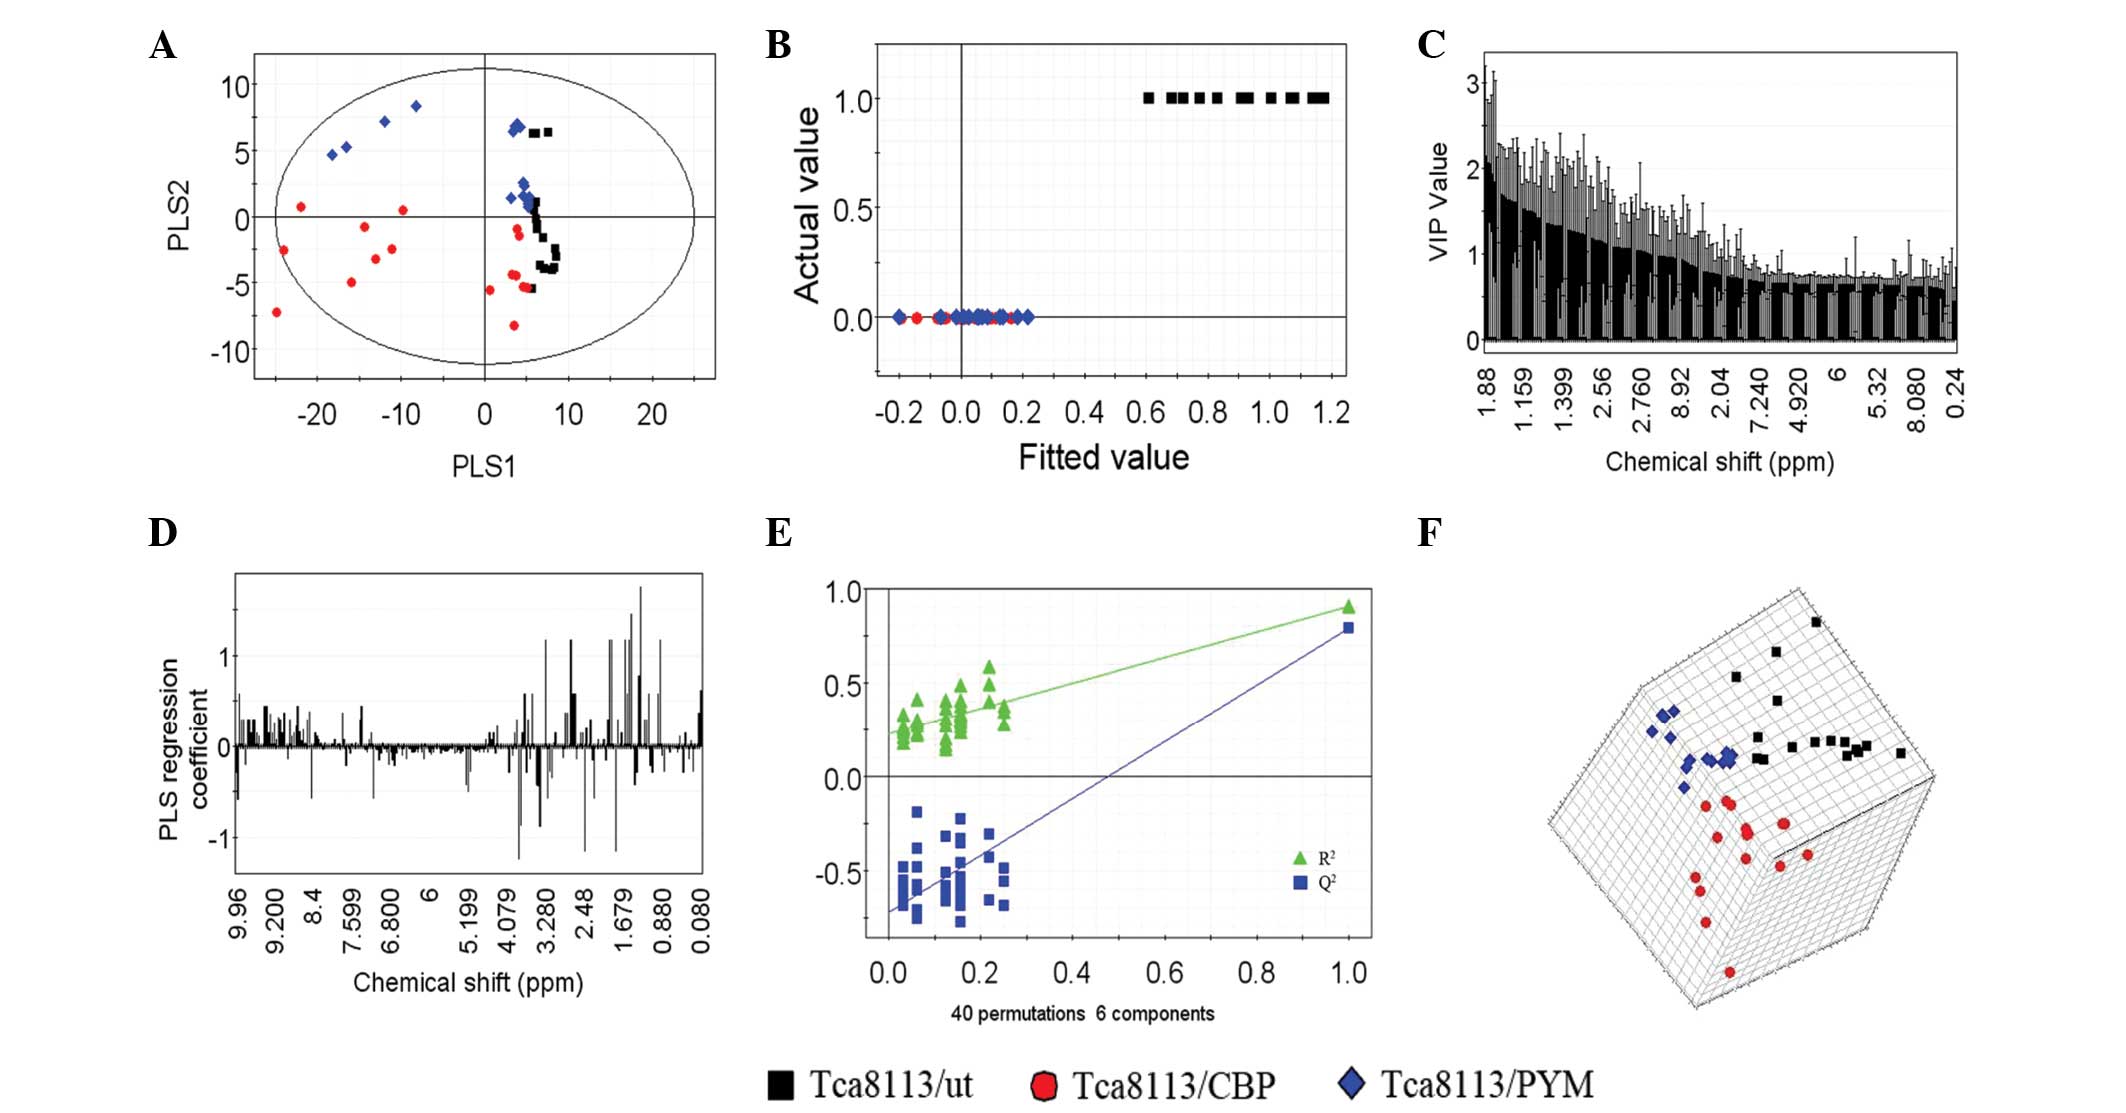
In total, six PLS components, which represented an
R2 value of 0.77 (original data) and a cross-validated
R2 value (Q2) of 0.909, were obtained by
PLS-DA of the 1H NMR spectra data for the three cell
lines. An improved separation of the first two PLS components was
observed (Fig. 5A) compared with the
PCA (Fig. 4C) This result was also
confirmed by the plot of the actual class value against the fitted
class value (Fig. 5B), which
demonstrated good separation between the different groups. The
horizontal distance between the groups was an indicator of the
group separation state (horizontal distance between the control and
test groups, ~0.35; Fig. 5B).
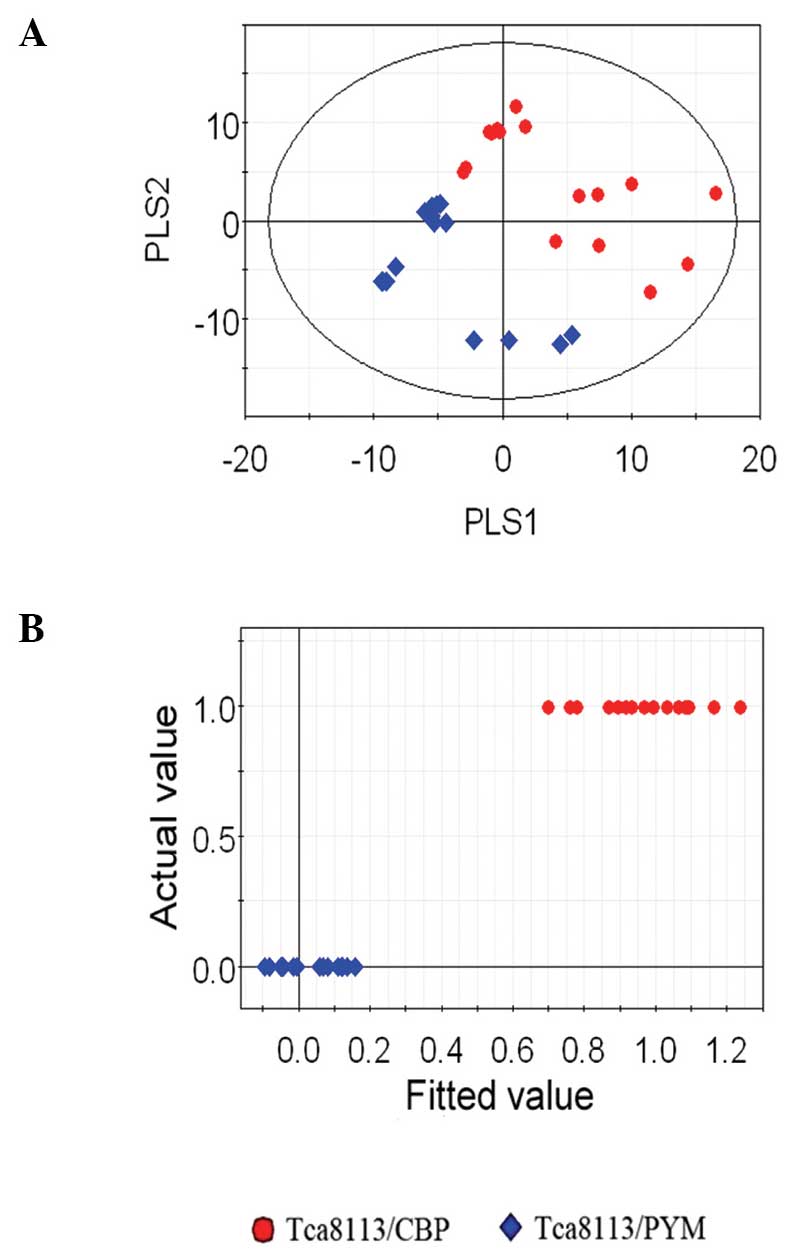
Considering the results of PCA (Fig. 4A
and B), the drug-resistant cell lines and parental cells were
found to be significantly separated. Notably, the two different
drug-resistant cell lines were also found to be separated following
PLS-DA (Fig. 6).
The VIP plot (Fig. 5C)
depicts the most important regions of the 1H NMR
spectra. The VIP of each spectrum was normalized and the average
squared VIP value was found to be 1; thus, a VIP value >1 in
this model was considered sufficient for group discrimination.
Fig. 5D shows the coefficient plot
for the predictive component and indicates that variables are the
key components that separate one cell line from the other. Along
with the VIP plot, the variables play a key role in the separation
of the three cell lines.
In addition, the validation plot (Fig. 5E) may be used to assess the risk of
the PLS-DA model. The two regression lines display a correlation
coefficient between the original Y and permuted Y vs. the
cumulative R2 and Q2 values. R2
describes how well the derived model fits the data, while
Q2, which is a proportion of R2, describes
the predictive ability of the derived model (35). A perfect model should have a high
Q2 value and an R2 value that is lower
compared with values at the original point on the upper right of
the plot in Fig. 5E, indicating
validation of the original model. The three dimensional score plot
(Fig. 5F) dynamically reveals an
enhanced cluster and separation of the three cell lines in the
space.
A previous study (36)
has demonstrated that the major regions of the NMR spectra for
specific compounds were as follows: δ 0.598–1.022 ppm (methyl
compounds), δ 1.056–1.286 ppm (methylene compounds), δ ~2.00 ppm
(acetate), δ 3.200–3.90 ppm (glycosyl compounds), δ 3.21–3.23 ppm
(choline compounds), δ 4.500–4.800 ppm (water peak) and δ 6.92–7.76
ppm (aromatic compounds). In the present study, the portion of
extracellular metabolites (Table II)
in PLS-DA was assigned by analyzing the VIP list obtained from the
VIP plot and comparing the obtained chemical shifts with previously
reported values (32,37–39).
Table II depicts the corresponding
chemical shifts of the identified metabolites, which presented VIP
values of >1.
| Table II.Significant metabolites accountable
for the discrimination of the three groups in the PLS-DA. |
Table II.
Significant metabolites accountable
for the discrimination of the three groups in the PLS-DA.
| Metabolite | δ 1H ppm
(multiplicitya) |
|---|
| Glutamate
(bonded) | 1.95, 3.78 |
| Glutamate | 2.15 |
|
Glycerophosphoethanol amine | 4.11 |
| Lactate | 4.11, 1.33 (d) |
| α-Glucose | 3.39, 3.71, 3.83
(ddd) |
| β-Glucose | 3.47, 3.24 (d),
3.91 (dd) |
| Arginine | 1.68, 3.24 (t),
3.79, 1.91 |
| Acetate | 1.91 (s) |
| Citrulline | 1.87 |
| Lysine | 3.03 (t) |
| Lysine
(bonded) | 1.55 |
| Methionine | 3.87 (dd), 2.64
(t) |
| Phenylalanine | 7.39 (m), 3.27
(dd), 7.42 (m) |
| Taurine | 3.43 (t) |
| Proline | 4.14 |
| Proline
(bonded) | 3.83 |
| Isoleucine | 1.99, 1.27, 1.47
(s) |
| Threonine
(bonded) | 1.22 (d) |
| Threonine | 3.59 (d) |
| Leucine | 0.96 (d), 1.71
(m) |
| Creatine | 3.03 (s) |
| Aspartate | 2.81 (dd) |
| Formate | 8.43 (s) |
|
β-Hydroxybutyrate | 1.20 (d) |
| Myo-inositol | 3.62, 3.35, 3.56
(dd) |
| Serine | 3.95 (dd) |
| Unsaturated
Lipid | 5.27 |
| Alanine | 1.46 (d), 3.78
(q) |
| Fatty acyl chain
peak | 1.59 |
| Fucose | 1.31 (d) |
| Lipid (mainly
VLDL) | 0.87 (t) |
| Polyamines | 1.79 |
| Isobutyrate | 1.13 (d) |
| Albumin lysyl | 2.99 (t) |
| 2-Oxoglutarate | 2.47 (t) |
| Trimethylamine | 2.83 (s) |
| Glyceryl of
lipids | 5.20 (m) |
| Valine | 0.99 (d), 1.04
(d) |
Discussion
MDR is a severe complication occurring during
chemotherapeutic treatment of cancer and represents a major
obstacle to successful therapy. Avoiding the development of MDR and
reversing this effect once it is formed is difficult during the
process of chemotherapy. A previously used strategy to counteract
MDR was the increase of the drug or multidrug combination doses;
however, this results in a greater number of side-effects.
Therefore, the implementation of novel approaches to monitor the
development of MDR at the early stages of chemotherapy is crucial
(4,5).
During the dosing process in the present stduy, the passage number
of drug-induced cells was ~40 times. Although the cell passage
number has also been found to affect numerous of the cell line
features, including growth in culture, viability and efflux protein
expression (40), a certain passage
range (such as passage 30–40) is normally used in laboratory
experiments (41).
Metabolomics offers a platform for the development
of scientific research (42). Pattern
recognition and multivariate statistics are effective methods used
to determine differences in cells, individuals and treatments
(43,44). PCA and PLS-DA are two types of pattern
recognition analyses. In the present study, these methods were used
to analyze the extracellular metabolomic differences of parental
Tca8113 cells and two chemotherapy resistant cell lines,
Tca8113/CBP and Tca8113/PYM. The preliminary results revealed that
the 1H NMR-based metabolomic analysis was able to
distinguish the drug-induced Tca8113 cell lines from the parental
cells (Figs. 4 and 5). Furthermore, a strong separation was
observed between the two drug-resistant cell lines (Fig. 6). During analysis, the CPMGPR1D pulse
sequence was selected to filter the molecules with high metabolic
concentration, since small molecule metabolites are likely to
provide more pertinent information regarding an organism (45–47) and
may potentially be novel biomarkers in cancer research.
The current study verified that the relatively high
level of acetate and low level of lactate may play an important
role in the drug resistance of cells (Fig. 3). Acetate is able to generate large
numbers of HCO−3, which can counteract a
portion of lactate, attenuating the toxicity caused by lactate
(48). In addition, acetate may
generate acetyl coenzyme A (CoA), which is involved in energy
metabolism in vivo (49).
Furthermore, the present study detected a significantly higher peak
at δ 3.35 ppm in the spectrum of Tca8113/PYM (Fig. 3) and this metabolite was tentatively
identified as a type of myo-inositol. Myo-inositol, which is
synthesized from D-glucose (50), is
the precursor of second messengers and the phospholipid synthesis
(51,52). As previously reported, inositol
derivatives are critical in membrane biogenesis, signal
transduction and stress tolerance in plant cells (53). The increased content of inositol may
also be an indicator sign of enhanced tolerance in drug-resistant
tumor cells.
Furthermore, the present study demonstrated that
metabolic differences not only exist between generate acetyl CoA,
drug-resistant cells and parental cells, but also between the
drug-resistant cells that are resistant to different types of
drugs. This further illustrates why clinical chemotherapy often
fails, since different drugs have different pharmacological and
toxicological properties. In cells, these drugs may produce
different metabolites and content changes of these metabolites may
directly influence the physicochemical cellular properties. The
three cell lines investigated in the current study exhibited
certain significant metabolites accountable for discrimination,
which had a VIP value >1. Thus, these findings support the
hypothesis that these metabolites must be involved in the formation
of MDR; however, the specific underlying mechanism requires further
investigation.
In conclusion, the metabolic changes observed in the
present study provide new clues for understanding the potential
metabolic effects of chemotherapeutic drugs on disease. Future
studies will investigate the metabolomic analysis of intracellular
metabolites from these three groups. The 1H NMR-based
metabolomic technique is considered to have a significant value for
the research of molecular disease properties. This novel technique
has the potential of becoming a useful tool for early detection of
tumor MDR in response to traditional chemotherapy.
Acknowledgements
This study was supported by a grant from the
National Natural Science Foundation of China (no. 81372892).
References
|
1
|
Fardel O, Lecureur V and Guillouzo A: The
P-glycoprotein multidrug transporter. Gen Pharmacol. 27:1283–1291.
1996. View Article : Google Scholar : PubMed/NCBI
|
|
2
|
Goldstein LJ: MDR1 gene expression in
solid tumours. Eur J Cancer. 32A:1039–1050. 1996. View Article : Google Scholar : PubMed/NCBI
|
|
3
|
Chen J, Lu L, Feng Y, et al: PKD2 mediates
multi-drug resistance in breast cancer cells through modulation of
P-glycoprotein expression. Cancer Lett. 300:48–56. 2011. View Article : Google Scholar : PubMed/NCBI
|
|
4
|
Teodori E, Dei S, Scapecchi S and
Gualtieri F: The medicinal chemistry of multidrug resistance (MDR)
reversing drugs. Farmaco. 57:385–415. 2002. View Article : Google Scholar : PubMed/NCBI
|
|
5
|
Yan S, Ma D, Ji M, et al: Expression
profile of Notch-related genes in multidrug resistant K562/A02
cells compared with parental K562 cells. Int J Lab Hematol.
32:150–158. 2010. View Article : Google Scholar : PubMed/NCBI
|
|
6
|
Varma MV, Ashokraj Y, Dey CS and
Panchagnula R: P-glycoprotein inhibitors and their screening: a
perspective from bioavailability enhancement. Pharmacol Res.
48:347–359. 2003. View Article : Google Scholar : PubMed/NCBI
|
|
7
|
Kars MD, Iseri OD, Gündüz U, Ural AU,
Arpaci F and Molnár J: Development of rational in vitro models for
drug resistance in breast cancer and modulation of MDR by selected
compounds. Anticancer Res. 26:4559–4568. 2006.PubMed/NCBI
|
|
8
|
Schmidt C: Metabolomics takes its place as
latest up-and-coming “omic” science. J Natl Cancer Inst.
96:732–734. 2004. View Article : Google Scholar : PubMed/NCBI
|
|
9
|
Ai JY, Smith B and Wong DT: Bioinformatics
advances in saliva diagnostics. Int J Oral Sci. 4:85–87. 2012.
View Article : Google Scholar : PubMed/NCBI
|
|
10
|
German JB, Bauman DE, Burrin DG, et al:
Metabolomics in the opening decade of the 21st century building the
roads to individualized health. J Nutr. 134:2729–2732.
2004.PubMed/NCBI
|
|
11
|
Lindon JC, Holmes E and Nicholson JK: So
what's the deal with metabonomics? Anal Chem. 75:384A–391A. 2003.
View Article : Google Scholar : PubMed/NCBI
|
|
12
|
Ratajczak-Wrona W, Jablonska E, Antonowicz
B, Dziemianczyk D and Grabowska SZ: Levels of biological markers of
nitric oxide in serum of patients with squamous cell carcinoma of
the oral cavity. Int J Oral Sci. 5:141–145. 2013. View Article : Google Scholar : PubMed/NCBI
|
|
13
|
Goodacre R, Vaidyanathan S, Dunn WB,
Harrigan GG and Kell DB: Metabolomics by numbers: acquiring and
understanding global metabolite data. Trends Biotechnol.
22:245–252. 2004. View Article : Google Scholar : PubMed/NCBI
|
|
14
|
Nicholson JK, Lindon JC and Holmes E:
‘Metabonomics’: understanding the metabolic responses of living
systems to pathophysiological stimuli via multivariate statistical
analysis of biological NMR spectroscopic data. Xenobiotica.
29:1181–1189. 1999. View Article : Google Scholar : PubMed/NCBI
|
|
15
|
Bathen TF, Jensen LR, Sitter B, et al:
MR-determined metabolic phenotype of breast cancer in prediction of
lymphatic spread, grade and hormone status. Breast Cancer Res
Treat. 104:181–189. 2007. View Article : Google Scholar : PubMed/NCBI
|
|
16
|
Pec J, Flores-Sanchez IJ, Choi YH and
Verpoorte R: Metabolic analysis of elicited cell suspension
cultures of Cannabis sativa L. by 1H-NMR spectroscopy. Biotechnol
Lett. 32:935–941. 2010. View Article : Google Scholar : PubMed/NCBI
|
|
17
|
Seger C and Sturm S: Analytical aspects of
plant metabolite profiling platforms: current standings and future
aims. J Proteome Res. 6:480–497. 2007. View Article : Google Scholar : PubMed/NCBI
|
|
18
|
Kim HK, Choi YH and Verpoorte R: NMR-based
metabolomic analysis of plants. Nat Protoc. 5:536–549. 2010.
View Article : Google Scholar : PubMed/NCBI
|
|
19
|
Allwood JW, Clarke A, Goodacre R and Mur
LA: Dual metabolomics: a novel approach to understanding
plant-pathogen interactions. Phytochemistry. 71:590–597. 2010.
View Article : Google Scholar : PubMed/NCBI
|
|
20
|
Sheedy JR, Ebeling PR, Gooley PR and
McConville MJ: A sample preparation protocol for 1H nuclear
magnetic resonance studies of water-soluble metabolites in blood
and urine. Anal Biochem. 398:263–265. 2010. View Article : Google Scholar : PubMed/NCBI
|
|
21
|
Barton RH, Waterman D, Bonner FW, et al:
The influence of EDTA and citrate anticoagulant addition to human
plasma on information recovery from NMR-based metabolic profiling
studies. Mol Biosyst. 6:215–224. 2010. View
Article : Google Scholar : PubMed/NCBI
|
|
22
|
Holmes E, Nicholls AW, Lindon JC, et al:
Development of a model for classification of toxin-induced lesions
using 1H NMR spectroscopy of urine combined with pattern
recognition. NMR Biomed. 11:235–244. 1998. View Article : Google Scholar : PubMed/NCBI
|
|
23
|
Beckonert O, Monnerjahn J, Bonk U and
Leibfritz D: Visualizing metabolic changes in breast-cancer tissue
using 1H-NMR spectroscopy and self-organizing maps. NMR Biomed.
16:1–11. 2003. View Article : Google Scholar : PubMed/NCBI
|
|
24
|
Yokota H, Guo J, Matoba M, Higashi K,
Tonami H and Nagao Y: Lactate, choline and creatine levels measured
by vitro 1H-MRS as prognostic parameters in patients with
non-small-cell lung cancer. J Magn Reson Imaging. 25:992–999. 2007.
View Article : Google Scholar : PubMed/NCBI
|
|
25
|
Griffin JL and Kauppinen RA: Tumour
metabolomics in animal models of human cancer. J Proteome Res.
6:498–505. 2007. View Article : Google Scholar : PubMed/NCBI
|
|
26
|
Tiziani S, Lopes V and Günther UL: Early
stage diagnosis of oral cancer using 1H NMR-based metabolomics.
Neoplasia. 11:269–276. 2009. View Article : Google Scholar : PubMed/NCBI
|
|
27
|
Lucas LH, Larive CK, Wilkinson PS and Huhn
S: Progress toward automated metabolic profiling of human serum:
comparison of CPMG and gradient-filtered NMR analytical methods. J
Pharm Biomed Anal. 39:156–163. 2005. View Article : Google Scholar : PubMed/NCBI
|
|
28
|
Levitt MH: Spin Dynamics. Basics of
Nuclear Magnetic Resonance. 2nd. John Wiley & Sons; New York,
NY: 2008
|
|
29
|
Jackson JE: A User's Guide to Principal
Components. John Wiley & Sons, Inc.; New York, NY: pp. 20–150.
1991
|
|
30
|
Zhou J, Xu B, Huang J, et al: 1H NMR-based
metabonomic and pattern recognition analysis for detection of oral
squamous cell carcinoma. Clin Chim Acta. 401:8–13. 2009. View Article : Google Scholar : PubMed/NCBI
|
|
31
|
Gavaghan CL, Wilson ID and Nicholson JK:
Physiological variation in metabolic phenotyping and functional
genomic studies: use of orthogonal signal correction and PLS-DA.
FEBS Lett. 530:191–196. 2002. View Article : Google Scholar : PubMed/NCBI
|
|
32
|
Rocha CM, Barros AS, Gil AM, et al:
Metabolic profiling of human lung cancer tissue by 1H high
resolution magic angle spinning (HRMAS) NMR spectroscopy. J
Proteome Res. 9:319–332. 2010. View Article : Google Scholar : PubMed/NCBI
|
|
33
|
Tang H, Wang Y, Nicholson JK and Lindon
JC: Use of relaxation-edited one-dimensional and two-dimensional
nuclear magnetic resonance spectroscopy to improve detection of
small metabolites in blood plasma. Anal Biochem. 325:260–272. 2004.
View Article : Google Scholar : PubMed/NCBI
|
|
34
|
Ala-Korpela M: 1H NMR spectroscopy of
human blood plasma. Prog Nucl Magn Reson Spectrosc. 27:475–554.
1995. View Article : Google Scholar
|
|
35
|
Wang L, Chen J, Chen L, et al: 1H-NMR
based metabonomic profiling of human esophageal cancer tissue. Mol
Cancer. 12:252013. View Article : Google Scholar : PubMed/NCBI
|
|
36
|
Lenz EM, Bright J, Wilson ID, Morgan SR
and Nash AF: A 1H NMR-based metabonomic study of urine and plasma
samples obtained from healthy human subjects. J Pharm Biomed Anal.
33:1103–1115. 2003. View Article : Google Scholar : PubMed/NCBI
|
|
37
|
Nicholson JK, Foxall PJ, Spraul M, Farrant
RD and Lindon JC: 750 MHz 1H and 1H-13C NMR spectroscopy of human
blood plasma. Anal Chem. 67:793–811. 1995. View Article : Google Scholar : PubMed/NCBI
|
|
38
|
Ulrich EL, Akutsu H, Doreleijers JF, et
al: BioMagResBank. Nucleic Acids Res. 36:(Database). D402–D408.
2008. View Article : Google Scholar : PubMed/NCBI
|
|
39
|
Wishart DS, Tzur D, Knox C, et al: HMDB:
The human metabolome database. Nucleic Acids Res. 35:(Database).
D521–D526. 2007. View Article : Google Scholar : PubMed/NCBI
|
|
40
|
Briske-Anderson MJ, Finley JW and Newman
SM: The influence of culture time and passage number on the
morphological and physiological development of Caco-2 cells. Proc
Soc Exp Biol Med. 214:248–257. 1997. View Article : Google Scholar : PubMed/NCBI
|
|
41
|
Siissalo S, Laitinen L, Koljonen M, et al:
Effect of cell differentiation and passage number on the expression
of efflux proteins in wild type and vinblastine-induced Caco-2 cell
lines. Eur J Pharm Biopharm. 67:548–554. 2007. View Article : Google Scholar : PubMed/NCBI
|
|
42
|
Goldsmith P, Fenton H, Morris-Stiff G,
Ahmad N, Fisher J and Prasad KR: Metabonomics: A useful tool for
the future surgeon. J Surg Res. 160:122–132. 2010. View Article : Google Scholar : PubMed/NCBI
|
|
43
|
Holmes E, Foxall PJ, Nicholson JK, et al:
Automatic data reduction and pattern recognition methods for
analysis of 1H nuclear magnetic resonance spectra of human urine
from normal and pathological states. Anal Biochem. 220:284–296.
1994. View Article : Google Scholar : PubMed/NCBI
|
|
44
|
Fauvelle F, Dorandeu F, Carpentier P, et
al: Changes in mouse brain metabolism following a convulsive dose
of soman: a proton HRMAS NMR study. Toxicology. 267:99–111. 2010.
View Article : Google Scholar : PubMed/NCBI
|
|
45
|
Schroeder FC: Small molecule signaling in
Caenorhabditis elegans. ACS Chem Biol. 1:198–200. 2006. View Article : Google Scholar : PubMed/NCBI
|
|
46
|
Schroeder FC, Gibson DM, Churchill AC, et
al: Differential analysis of 2D NMR spectra: New natural products
from a pilot-scale fungal extract library. Angew Chem Int Ed Engl.
46:901–904. 2007. View Article : Google Scholar : PubMed/NCBI
|
|
47
|
Bédouet L, Rusconi F, Rousseau M, et al:
Identification of low molecular weight molecules as new components
of the nacre organic matrix. Comp Biochem Physiol B Biochem Mol
Biol. 144:532–543. 2006. View Article : Google Scholar : PubMed/NCBI
|
|
48
|
Vinay P, Prud'Homme M, Vinet B, et al:
Acetate metabolism and bicarbonate generation during hemodialysis:
10 years of observation. Kidney Int. 31:1194–1204. 1987. View Article : Google Scholar : PubMed/NCBI
|
|
49
|
Zhu Y, Eiteman MA, Lee SA and Altman E:
Conversion of glycerol to pyruvate by Escherichia coli using
acetate- and acetate/glucose-limited fed-batch processes. J Ind
Microbiol Biotechnol. 37:307–312. 2010. View Article : Google Scholar : PubMed/NCBI
|
|
50
|
Meng PH, Raynaud C, Tcherkez G, et al:
Crosstalks between myo-inositol metabolism, programmed cell death
and basal immunity in Arabidopsis. PLoS One. 4:e73642009.
View Article : Google Scholar : PubMed/NCBI
|
|
51
|
Downes CP, Gray A and Lucocq JM: Probing
phosphoinositide functions in signaling and membrane trafficking.
Trends Cell Biol. 15:259–268. 2005. View Article : Google Scholar : PubMed/NCBI
|
|
52
|
Malan TP Jr and Porreca F: Lipid mediators
regulating pain sensitivity. Prostaglandins Other Lipid Mediat.
77:123–130. 2005. View Article : Google Scholar : PubMed/NCBI
|
|
53
|
Loewus FA and Murthy PP: Myo-Inositol
metabolism in plants. Plant Sci. 150:1–19. 2000. View Article : Google Scholar
|