Introduction
Hepatocellular carcinoma is a polygenic and
multifactorial malignant tumor, characterized by a complex
mechanism, high level of malignancy, rapid progression, poor
prognosis and high mortality rate (1). To date, surgery remains the major
therapeutic strategy for the treatment of hepatocellular carcinoma.
Therefore, the development of novel preventive and therapeutic
methods or drugs for hepatocellular carcinoma treatment is of
significant interest. Modification of the N-terminal domains of the
core histone is able to alter chromatin structures by modulating
the affinity between the histone and DNA (2). Histone acetylation is regulated by
histone acetyltransferase (HAT) and histone deacetylase (HDAC)
(3). Previous studies have indicated
that low levels of histone acetylation or high expression of HDACs
are associated with the genesis and development of certain types of
tumor; therefore HDAC inhibitors (HDACIs) (4,5) were
suggested as a potential tumor therapy method, which was verified
by further research (6). However,
certain HDACIs currently used in a clinical application are
restricted due to their toxicity and short half-life (7). Sodium valproate (VPA), a widely used
anticonvulsant drug, has been demonstrated to be a specific HDACI
and is well known for its long half-life (8). However, the antineoplastic mechanism of
VPA in hepatocellular carcinoma has not yet been fully
elucidated.
The present study aimed to determine the effect of
VPA in the hepatocellular carcinoma cell line, HepG2, in
vitro. The protein expression levels of MMP-2 and MMP-9 were
also detected to clarify the molecular mechanisms underlying of
migration and invasion by regulating histone acetylation. Finally,
the anti-hepatocellular carcinoma effect of VPA in vivo was
investigated, using a mouse model of hepatocellular carcinoma.
Materials and methods
Cell culture and VPA treatment
HepG2 hepatocellular carcinoma cells (Cell Bank of
Type Culture Collection of Chinese Academy of Sciences, Shanghai,
China) were cultured in RPMI-1640 standard medium (Gibco Life
Technologies, Carlsbad, CA, USA), supplemented with 10% fetal
bovine serum, glutamine (Zhejiang Tianhang Biological Technology
Co., Ltd., Huzhou, China) and antibiotics (50 IU penicillin and 50
µg/ml streptomycin; Sigma-Aldrich, St. Louis, MO, USA) in a
humidified 5% CO2 atmosphere at 37°C. Exponentially
growing HepG2 cells were incubated in six-well plates, at a
concentration of 1×10⁵ cells/ml. Following culture at
37°C with 5% CO2 for 4 h, 10 µl VPA (Sigma-Aldrich) was
added at final concentrations of 0.75, 1.5, 2.0, 3.0 and 4.0
mmol/l, respectively. The culture medium without VPA was used as
control. There were three duplicate wells for each concentration
gradient and cells were treated for 24, 48, 72 and 96 h. HepG2
cells were collected by centrifugation at each time-point.
Cell morphology and proliferation
analysis
A total of 0.1 ml exponentially growing HepG2 cells
(5×10⁴ cells/ml) were added to a 96-well plate and
cultured at 37°C with 5% CO2 for 4 h. Subsequently, VPA
was added at 0.75, 1.5, 2.0, 3.0 and 4.0 mmol/l respectively and
incubated in 5% CO2 at 37°C for 24, 48, 72 and 96 h.
Cell morphology was observed by Giemsa staining (Beijing Solarbio
Science & Technology Co., Ltd., Beijing, China) under a
microscope (Leica Microsystems DMLB, Wetzlar, Germany). Cell
proliferation was detected using the MTT method (9). Proliferation inhibition rate of cells
(%) = (number of control cells - number of VPA-treated
cells)/number of control cells x100%.
Apoptosis assay
In accordance with the MTT assay results, HepG2
cells were treated with 0.75, 1.5, 2.0, 3.0 and 4.0 mmol/l VPA
prior to detection of apoptosis. Cells were collected at 24, 48, 72
and 96 h, washed once with phosphate-buffered saline (PBS) and
stained with Annexin V/propidium iodide (PI), according to the
manufacturer's instructions of the Annexin V/PI Apoptosis Detection
kit (Invitrogen Life Technologies, Carlsbad, CA, USA). Cells were
subsequently analyzed by flow cytometry (FC 500, Beckman Coulter,
Brea, CA, USA) and the results were analyzed using EXPO™32 ADC
software, version 1.1C (Beckman Coulter).
Colony formation assay
HepG2 cells were treated with VPA according to the
aforementioned methods for 14 days. Subsequently, the culture
solution was discarded and the cells were washed twice with PBS (pH
7.4; 0.1 mol/l; Sinopharm Chemical Reagent Co., Ltd, Shanghai,
China). Cell colonies composed of >50 cells were counted under a
microscope (Leica Microsystems DMLB) following Giemsa staining. The
results were presented as the inhibition rate, according to the
following formula: Colony formation inhibition rate (%) = (control
cell colony number - VPA treated cell colony number) / control cell
colony number × 100%.
Cell migration assay
HepG2 cells were incubated in six-well plates at a
concentration of 2×10⁵ cells/well. When 90% of the
bottom of the wells were covered with a cell monolayer, cells were
cultured in RPMI-1640 medium containing 1% fetal bovine serum, and
the cells on two 20×5 mm areas were removed with cell scrapers
(Corning Incorporated, Corning, NY, USA). The culture supernatant
was replaced with 2 ml fresh medium, containing 10% fetal bovine
serum, and VPA (0.75, 1.5, 2.0, 3.0 and 4.0 mmol/l) was added.
Following 24 h of culture, cells which had migrated into the
scraped areas were counted under a microscope (Leica Microsystems
DMLB). PBS was used as control. The results were presented as the
inhibition rate, determined by: Cell migration inhibition rate (%)
= (number of control cells migrated into scrapes - number of
VPA-treated cells migrated into scrapes)/number of control cells
migrated into scrapes x100%.
Cell invasion assay
The lower surfaces of the Transwell polycarbonate
filters (Corning Incorporated) were coated with 0.1% gelatin
(Beijing Solarbio Science & Technology Co., Ltd.), and the
upper surfaces were coated with 20 µl Matrigel (BD Pharmingen, San
Diego, CA, USA). A total of 100 µl exponentially growing HepG2
cells (1×10⁶ cells/ml) were added to the upper chambers
of the Transwell apparatus with 0.75, 1.5, 2.0, 3.0 and 4.0 mmol/l
VPA, while culture supernatant of NIH-3T3 cells (Cell Bank of Type
Culture Collection of Chinese Academy of Sciences, Shanghai, China)
was added to the lower chambers, and cultured for 24 h at 37°C with
5% CO2. HepG2 cells which had invaded to the lower
surface were stained with Wright-Giemsa stain and counted under a
microscope. The result was indicated as the inhibition rate,
determined by: Cell invasion inhibition rate (%) = (number of
control cells on the lower side - number of VPA-treated cells on
the lower side)/number of control cells on the lower side
x100%.
Protein expression of MMP-2 and
MMP-9
Protein expression levels of MMP-2 and MMP-9 were
measured by flow cytometry. Mouse monoclonal primary antibodies
against MMP-2 (8B4; catalog no. SC-13595; Santa Cruz Biotechnology,
Inc., Santa Cruz, CA, USA) and MMP-9 (2C3; catalog no. SC-21733;
Santa Cruz Biotechnology, Inc.) were used. The primary antibodies
were diluted (1:40) using PBS solution with 0.1% sodium azide. The
secondary antibody was an FITC-conjugated polyclonal rabbit
anti-mouse IgG (dilution, 1:40; H+L; catalog no. sc-358916; Santa
Cruz Biotechnology, Inc.). Briefly, 5×10⁶ HepG2 cells
were collected and washed following exposure to 1.5 or 3.0 mmol/l
VPA for 48 h. Cells were mixed with 1 ml permeabilization buffer
and incubated for 15 min at room temperature. The supernatant was
replaced with 100 µl permeabilization buffer following
centrifugation (2,000 × g, 10 min, 4°C) and cells were resuspended
and mixed with 5 µl (1 µg) monoclonal antibodies against MMP-2 and
MMP-9. Following 30 min of incubation, cells were washed twice with
PBS. Subsequently, cells were mixed with 100 µl (2.5 µg) secondary
antibody and incubated at room temperature in the dark for 30 min.
Cells were washed twice and resuspended in PBS, prior to analysis
of protein expression by flow cytometry. The mean fluorescence
intensity exponent (MFI) was calculated using EXPO™32 ADC software,
version 1.1C.
Assessment of VPA effects in vivo
A total of 20 female nude mice were purchased from
Shanghai Laboratory Animal Center Laboratory Animal Co. Ltd
(Shanghai, China) and were randomly divided into control and
therapy groups (n=10 per group). The mice were housed in isolators
under specific pathogen-free conditions with a 12/12-h light/dark
cycle and an ambient temperature of 26°C. The mice had ad
libitum access to conventional nude mouse food (Shanghai
Laboratory Animal Center Laboratory Animal Co. Ltd) and pH 2.5
sterile water. Exponentially growing HepG2 cells were collected,
washed twice with PBS and adjusted to 1×10⁷ cells/ml.
Subsequently, 0.2 ml cell suspension was subcutaneously injected
into the right oxter of the mice. One week later, mice in the
therapy group were administered 20 mg/kg/d VPA by gastric
perfusion, while control mice were administered normal saline.
Following treatment with VPA for one week, the tumor size was
measured weekly and tumor volume was calculated as the formula:
V=1/2x length × width2. Following 4 weeks of therapy,
all the mice were sacrificed by cervical dislocation, the tumors
were excised and weighed, and the tumor inhibition rate was
calculated. Tumor inhibition rate = (tumor weight of control mice -
tumor weight of therapy mice)/tumor weight of control x100%. The
study was approved by the ethics committee Jinan Central Hospital
(Shandong University, Jinan, Shandong, China).
Statistical analysis
All experiments were performed at least in
triplicate. All results are expressed as the mean ± standard
deviation. The data were analyzed with Student's unpaired
t-test and Pearson's correlation coefficient. P<0.05 was
considered to indicate a statistically significant difference.
Results
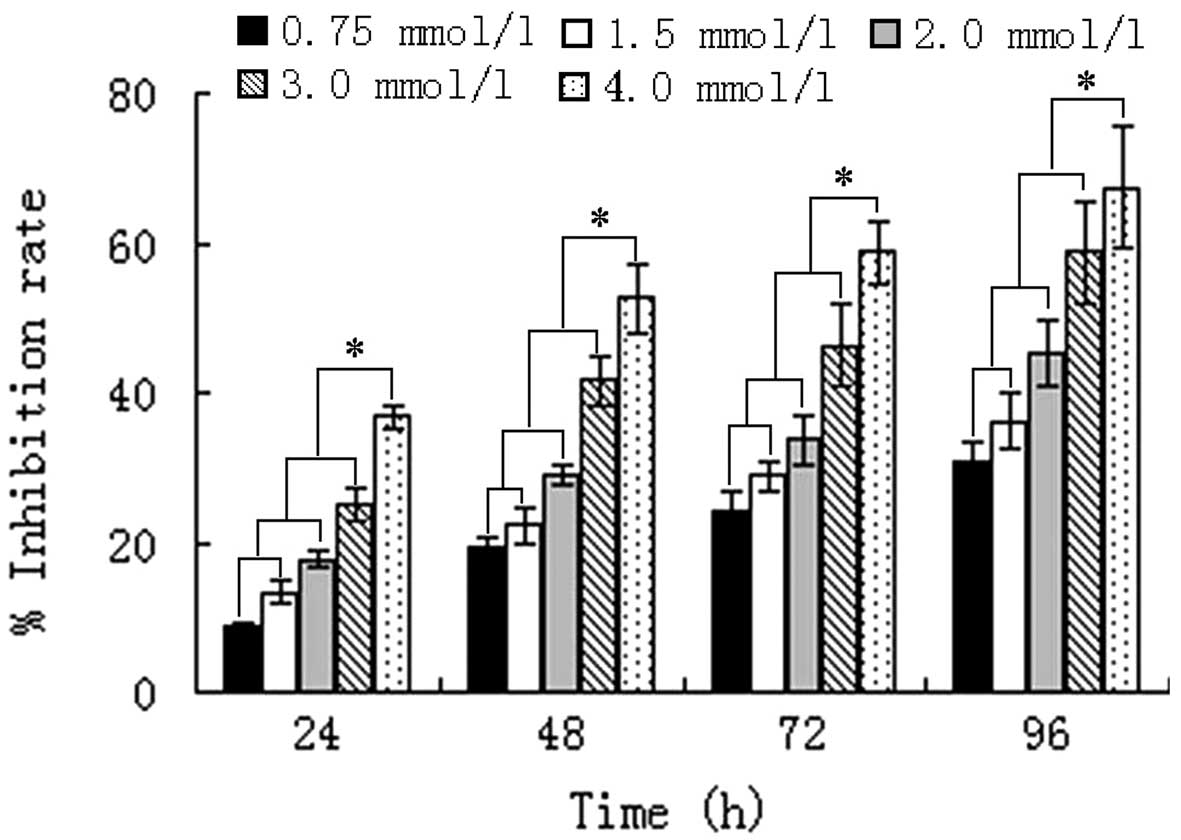
VPA alters cell morphology and
inhibits proliferation of HepG2 cells
Control cells grew well, and were of uniform size
and shape. Following exposure to VPA for 24 h, there was no
significant difference in the morphology of cells treated with 0.75
or 1.5 mmol/l VPA and control cells, whereas the size and shape of
2.0–4.0 mmol/l VPA-treated cells became varied and irregular.
Following 48 h of incubation, the morphology of all VPA-treated
cells was altered, and semi-suspended cells and apoptotic bodies
were observed. In addition, condensed cell chromatin and nuclei
splitting were identified. Concurrently, the proliferation of HepG2
cells was markedly inhibited from the beginning of the indicated
time-points, by various concentrations of VPA (P<0.01).
Furthermore, Pearson's correlation analysis confirmed that the
inhibition of HepG2 cells by VPA was time- (r=0.403; P=0.033) and
dose-dependent (r=0.473; P=0.011) (Fig.
1).
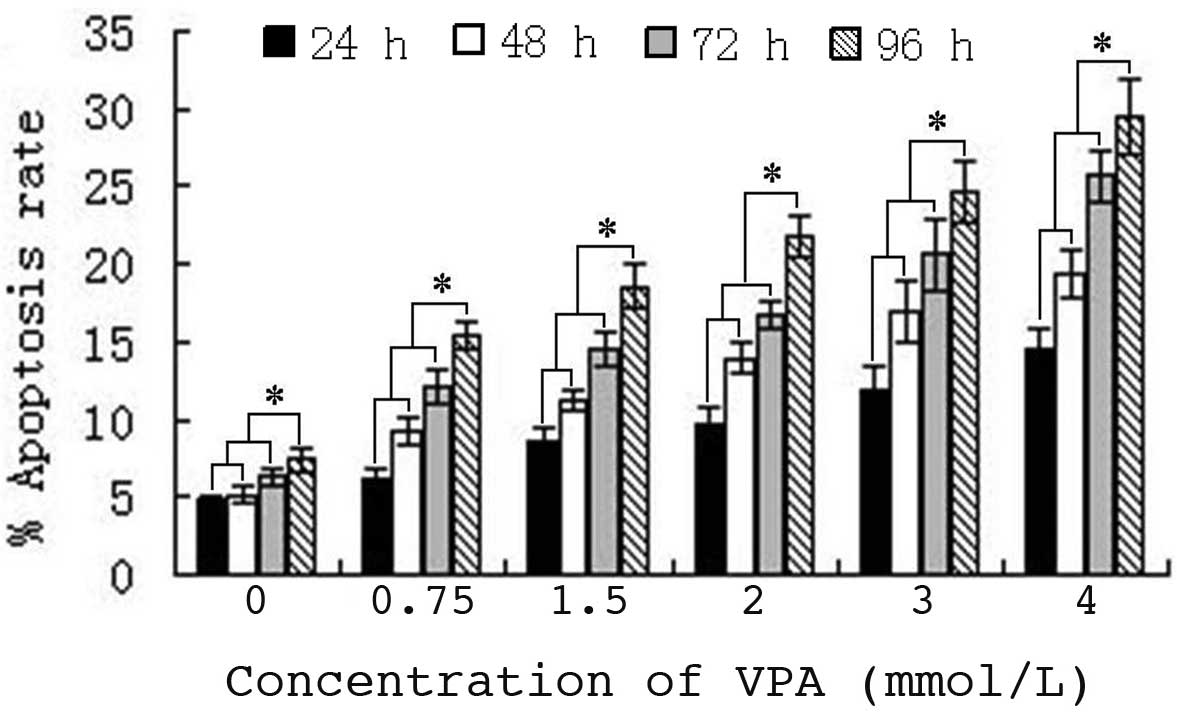
VPA induces apoptosis of HepG2
cells
The mechanism of proliferation inhibition of HepG2
cells by VPA was detected, following the identification of a time-
and dose-dependent inhibition. The results indicated that HepG2
cell apoptosis was induced following treatment with 0.75–4.0 mmol/l
VPA for 24–96 h. Furthermore, the apoptotic rate increased with
increasing VPA concentration and drug-exposure time. Statistical
analysis confirmed that the increase in apoptosis ratio was time-
(r=0.568; P=0.004) and dose-dependent (r=0.786; P<0.000)
(Fig. 2).
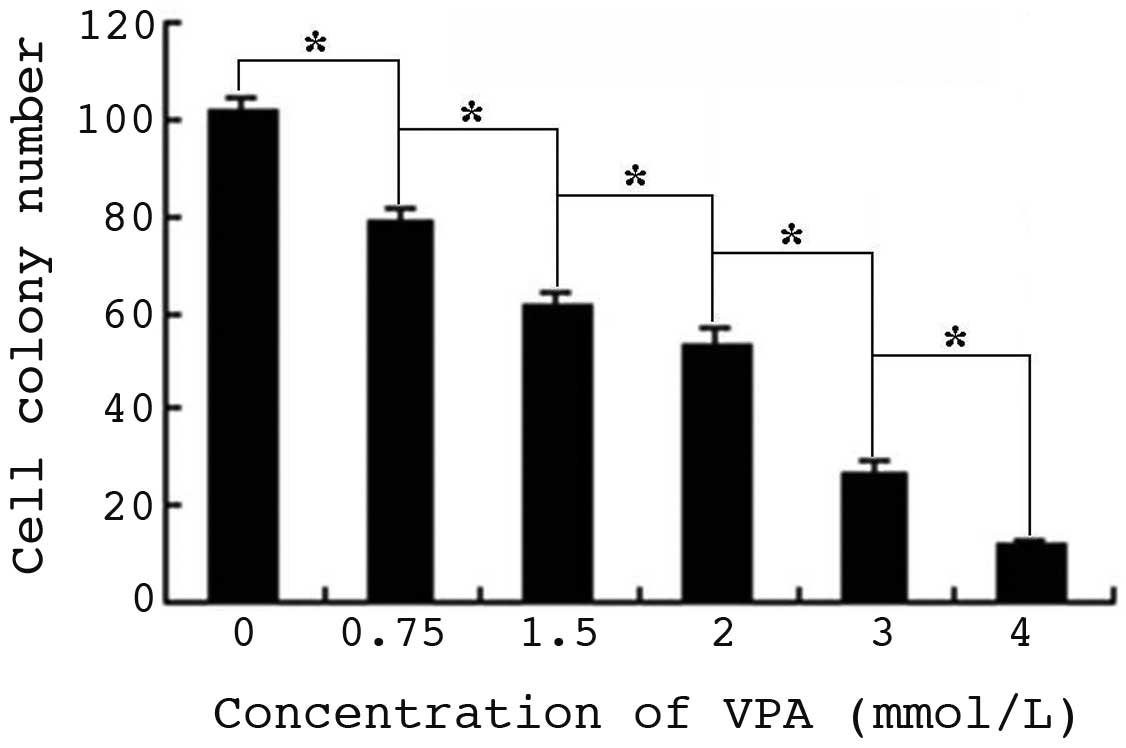
VPA inhibits colony formation of HepG2
cells
The size and number of HepG2 cell colonies decreased
compared with that of control cells, following culture with VPA for
14 days (Fig. 3). The cell colony
number of cells treated with 0.75, 1.5, 2.0, 3.0 and 4.0 mmol/l VPA
was 79.0±3.2, 62.0±2.8, 54.0±3.3, 26.0±2.9 and 12.0±1.1,
respectively, while that of control cells was 102±2.8 (P<0.01).
Furthermore, cells treated with 3.0 and 4.0 mmol/l VPA exhibited
notable shrinkage and the colonies formed were smaller.
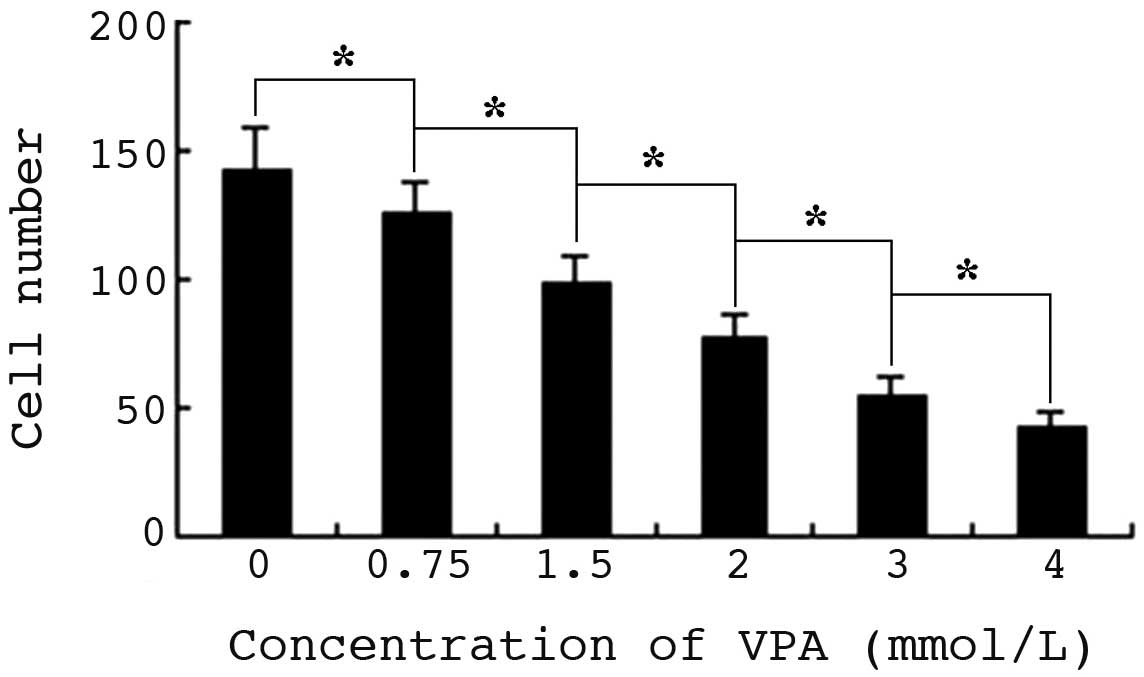
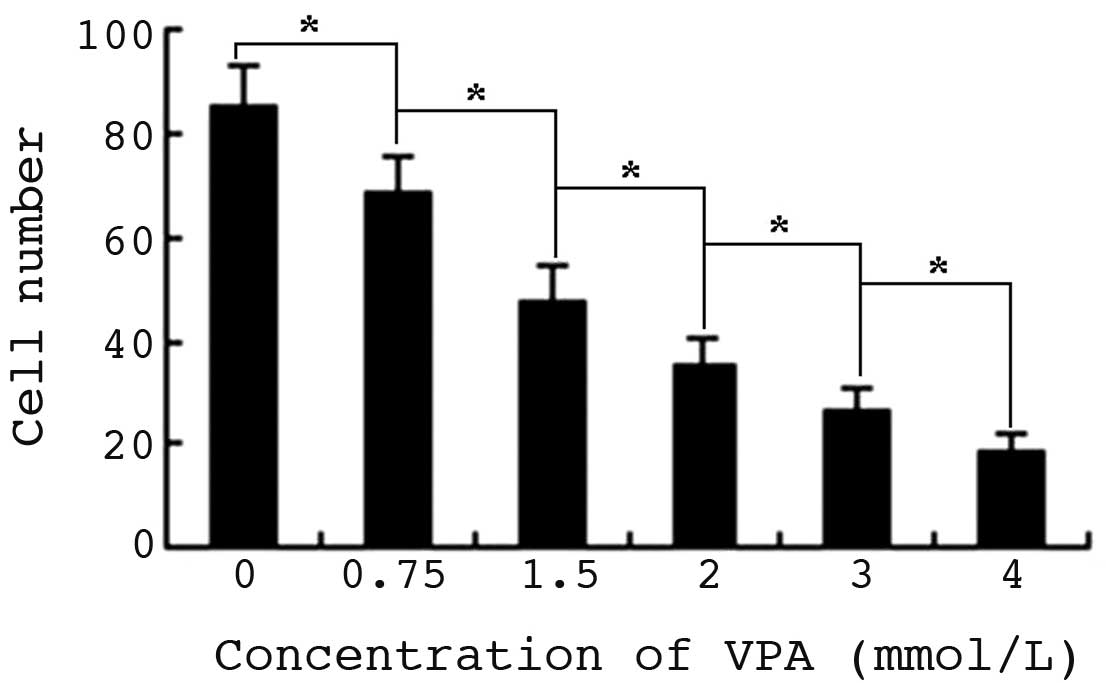
VPA inhibits migration of HepG2
cells
Cell migration was determined by cell scrape assay,
and observed under a microscope. Following culture for 24 h, the
mean number of control cells migrating to the scratch was 142,
while in the 0.75–4.0 mmol/l VPA experimental groups, the number
gradually decreased with increasing drug concentration. There were
significant differences in cell migration between the 2.0–4.0
mmol/l VPA-treated groups and cells of the 0.75 or 1.5 mmol/l
groups (P<0.01). The inhibition ratios of cell migration were
between 12 and 70.4%, respectively, indicating a significant
dose-dependent effect (Fig. 4).
VPA inhibits HepG2 cell invasion in
vitro
Cell invasion in vitro was detected by
Transwell assay. Cells on the lower side of the polycarbonate
membrane were the invading cells, which were observed under a
microscope following Wright-Giemsa staining. Following treatment
with VPA, the number of invading cells was significantly reduced,
compared with that of untreated cells (P<0.01). Furthermore,
cell invasion was inhibited in a dose-dependent manner (Fig. 5).
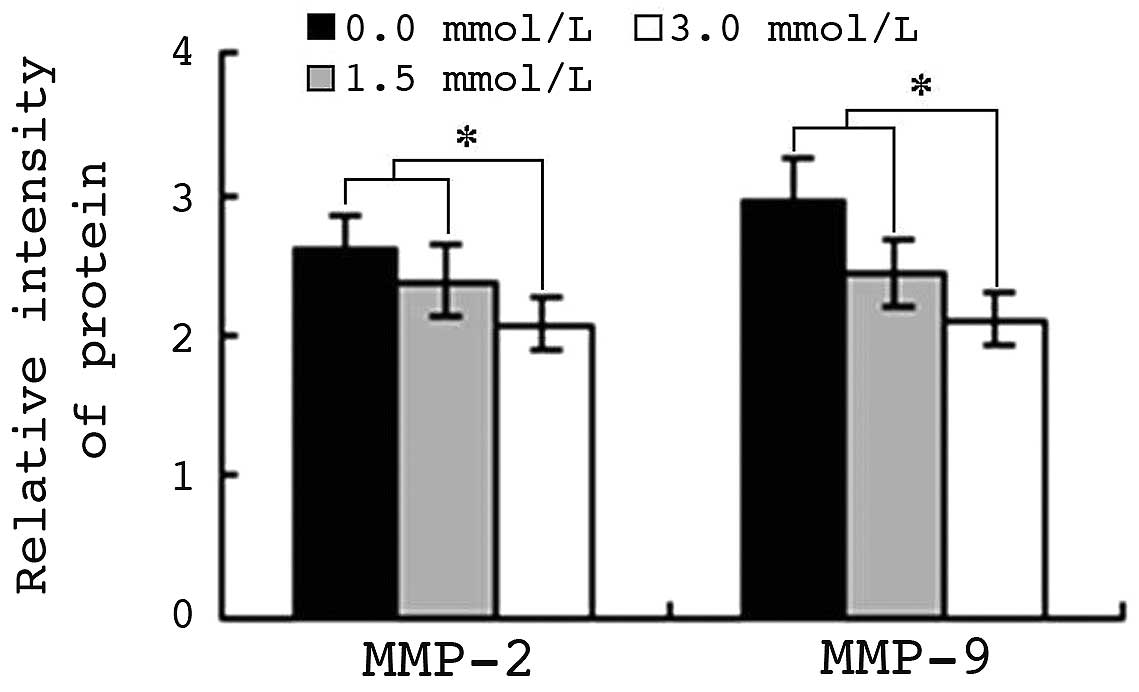
VPA inhibits protein expression of
MMP-2 and MMP-9
A total of 5×10⁶ HepG2 cells were exposed
to 1.5 or 3.0 mmol/l VPA for 48 h. Protein expression levels of
MMP-2 and MMP-9 were analyzed by flow cytometry, and the MFI was
calculated. The MFIs of MMP-2 and MMP-9 in control cells were 2.65
and 2.97, respectively. By contrast, in HepG2 cells treated with
1.5 mmol/l VPA for 48 h, the MFIs of MMP-2 and MMP-9 were 2.39 and
2.43, respectively (P<0.01). The MFIs of MMP-2 and MMP-9 in
cells treated with 3.0 mmol/l VPA were 2.09 and 2.08, respectively.
Pearson's correlation analysis indicated that the downregulation of
MMP-2 and MMP-9 protein expression was closely correlated with the
reduction in cell migration and invasion ability (r=0.962 and
0.950; P<0.01) (Fig. 6).
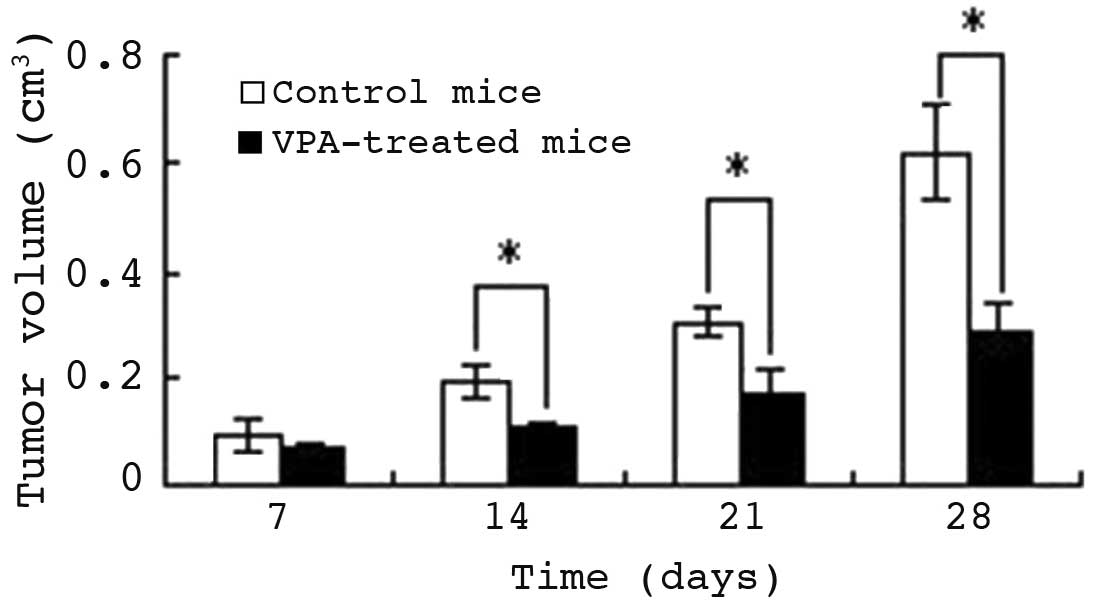
VPA inhibits tumor growth in vivo
Following confirmation of the function and mechanism
of VPA in HepG2 cell apoptosis, the anti-hepatocellular carcinoma
effect of VPA was evaluated in vivo. Seven days following
injection of HepG2 cells into nude mice, tumors were generated in
18 of the mice and VPA treatment was administered by gastric
perfusion. Fig. 7 indicates that
following the first week of treatment, the tumor volumes of the
control and therapy mice were similar (P>0.05). By day 14, the
tumors of VPA-treated mice were significantly smaller than those of
control mice (P<0.05). On day 28, the tumor volume of control
mice had increased to 0.62±0.10 cm3, while that of VPA
therapy mice was only 0.28±0.08 cm3 (P<0.01),
indicating an inhibition rate of 54.84%. Subsequently, the mice
were sacrificed and the tumors weighed. The mean tumor weight of
control mice was 1.49±0.38 g, while that of therapy mice was
1.06±0.12 g. Thus, VPA diminished the tumor weight significantly
(P<0.01); the tumor inhibition rate was 23.82%.
Discussion
In the 1950s, Cruft et al (10) reported that histones were able to bind
to DNA and alter their transcriptional activities. Since then,
histones have become a significant research topic (11). Histone acetylation levels are able to
directly affect tumor progression, and the high expression of HDACs
is closely correlated with tumorigenesis and tumor development
(12). VPA is a type of short-chain
fatty acid, mainly used in the treatment of hematological and
nervous tumors, which has been demonstrated to be a specific HDACI
(13), although its antineoplastic
function has not been widely recognized. The present study focused
on the malignant phenotype amelioration of HepG2 cells by VPA. In
view of apoptosis as a potential mechanism for cell growth
inhibition, the Annexin V/PI staining assay was used to detect
apoptosis of HepG2 cells induced by VPA, following the
identification of a time- and dose-dependent inhibition of HepG2
cells by VPA. The results revealed significantly enhanced apoptosis
of HepG2 cells following treatment with VPA, and indicated that
this effect was time- and dose-dependent.
Following culture with VPA for 14 days, the size and
number of HepG2 cell colonies was decreased. Meanwhile, cell
migration and invasion were also inhibited by VPA. All these
effects exhibited a marked dose-dependent tendency. The MMP family
is a type of zinc-dependent endopeptidase (14), and its principal function is to
degrade proteins in the matrix. MMP-2 is considered to be a
regulatory factor of the tumor angiogenic switch, while MMP-9
promotes angiopoiesis (15). MMPs
induce the formation of small pores in the basilar membrane by
degradation of the compact network structure, thereby promoting
external diffusion of tumor cells through the gaps, and enhancing
tumor invasion and metastasis. Furthermore, MMPs promote
angiogenesis, providing more favorable conditions for tumor growth,
local invasion and distant metastasis (14). The results of the present study
revealed that, following culture with VPA, MMP-2 and MMP-9 protein
expression levels were markedly downregulated. Pearson's
correlation analysis indicated that this effect was closely
correlated with the changes in cell migration and invasion ability.
Therefore, downregulation of MMP-2 and MMP-9 protein expression may
be one of the major mechanisms by which VPA inhibits hepatoma
carcinoma cell invasion and metastasis.
Acetylation levels of the histone N-terminal may
alter the state of chromatin by interfering with the affinity
between histones and DNA, or disturbing the combination of
transcription factor and DNA sequence (16). The regulatory role of acetylation in
gene expression is similar to that of DNA genetic code, and
therefore the potential role of HDACIs in tumor therapy was
considered. The results of the present study indicated that
regulation of histone acetylation with VPA was able to abrogate the
malignant phenotype of HepG2 cells, confirming that it may be
widely applied in hepatoma treatment. In addition, these results
confirmed that downregulation of MMP-2 and MMP-9 protein expression
may be the main mechanism by which VPA inhibits the invasion and
migration of hepatocellular carcinoma cells.
Acknowledgements
The authors acknowledge the financial support of the
China Postdoctoral Science Foundation, grant no. 138968.
References
|
1
|
Chen MS, Li JQ, Zhang YQ, Lu LX, Zhang WZ,
Yuan YF, et al: High-dose iodized oil transcatheter arterial
chemoembolization for patients with large hepatocellular carcinoma.
World J Gastroenterol. 8:74–78. 2002.PubMed/NCBI
|
|
2
|
Turner BM: Cellular memory and the histone
code. Cell. 111:285–291. 2002. View Article : Google Scholar : PubMed/NCBI
|
|
3
|
Mottet D and Castronovo V: Histone
deacetylases: Target enzymes for cancer therapy. Clin Exp Metastas.
25:183–189. 2008. View Article : Google Scholar
|
|
4
|
Weichert W, Roske A, Gekeler V, Beckers T,
Ebert MP, Pross M, et al: Association of patterns of class I
histone deacetylase expression with patient prognosis in gastric
cancer: A retrospective analysis. Lancet Oncol. 9:139–148. 2008.
View Article : Google Scholar : PubMed/NCBI
|
|
5
|
Marks PA, Rifkind RA, Richon VM, Breslow
R, Miller Y and Kelly WK: Histone deacetylases and cancer: Causes
and therapies. Nat Rev Cancer. 1:194–202. 2001. View Article : Google Scholar : PubMed/NCBI
|
|
6
|
Pan L, Lu J and Huang B: HDAC inhibitors:
A potential new category of anti-tumor agents. Cell Mol Immunol.
4:337–343. 2007.PubMed/NCBI
|
|
7
|
Gallinari P, Marco SD, Jones P, Pallaoro M
and Steinkühler C: HDACs, histone deacetylation and gene
transcription: From molecular biology to cancer therapeutics. Cell
Res. 17:195–211. 2007.PubMed/NCBI
|
|
8
|
Eyal S, Yagen B, Sobol E, Altschuler Y,
Shmuel M and Bialer M: The activity of antiepileptic drugs as
histone deacetylase inhibitors. Epilepsia. 45:737–744. 2004.
View Article : Google Scholar : PubMed/NCBI
|
|
9
|
Hansen MB, Nielsen SE and Berg K:
Re-examination and further development of a precise and rapid dye
method for measuring cell growth/cell kill. J Immunol Methods.
119:203–210. 1989. View Article : Google Scholar : PubMed/NCBI
|
|
10
|
Cruft HJ, Mauritzen CM and Stedman E:
Abnormal properties of histones from malignant cells. Nature.
174:580–585. 1954. View
Article : Google Scholar : PubMed/NCBI
|
|
11
|
Shi Y, Lan F, Matson C, Mulligan P,
Whetstine JR, Cole PA, Casero RA and Shi Y: Histone demethylation
mediated by the nuclear amine oxidase homolog LSD1. Cell.
119:941–953. 2004. View Article : Google Scholar : PubMed/NCBI
|
|
12
|
Seligson DB, Horvath S, Shi T, Yu H, Tze
S, Grunstein M and Kurdistani SK: Global histone modification
patterns predict risk of prostate cancer recurrence. Nature.
435:1262–1266. 2005. View Article : Google Scholar : PubMed/NCBI
|
|
13
|
Yang H, Hoshino K, Sanchez-Gonzalez B,
Kantarjian H and Garcia-Manero G: Antileukemia activity of the
combination of 5-aza-2′-deoxycytidine with valproic acid. Leuk Res.
29:739–748. 2005. View Article : Google Scholar : PubMed/NCBI
|
|
14
|
Kuwajima A, Iwashita J, Murata J and Abe
T: The histone deacetylase inhibitor butyrate inhibits melanoma
cell invasion of Matrigel. Anticancer Res. 27:4163–4169.
2007.PubMed/NCBI
|
|
15
|
Sun LC, Luo J, Mackey LV, Fuselier JA and
Coy DH: A conjugate of camptothecin and a somatostatin analog
against prostate cancer cell invasion via a possible signaling
pathway involving PI3K/Akt, alphaVbeta3/alphaVbeta5 and MMP-2/-9.
Cancer Lett. 246:157–166. 2007. View Article : Google Scholar : PubMed/NCBI
|
|
16
|
Esteller M: Cancer epigenomics: DNA
methylomes and histone-modification maps. Nat Rev Genet. 8:286–298.
2007. View
Article : Google Scholar : PubMed/NCBI
|