Introduction
Prostate cancer is the most commonly occurring
malignancy in men in developed Western countries, and is the second
highest cause of cancer-associated mortality following lung tumors
(1). Prostate cancer is associated
with urinary dysfunction, which could cause pain, difficulty in
urinating and problems during sexual intercourse (2). The cancer cells are able to use the
lymphatic system or bloodstream to travel to other regions of the
body (3). However, in practice, the
majority of cases of metastatic prostate carcinoma occur in the
lymph nodes and the bones (4). It is
unknown which regulatory mechanisms cause this transition, and thus
far, no effective androgen-independent prostate cancer therapies
have been developed (5).
Metastatic prostate carcinoma is classified as an
adenocarcinoma, so there have been a number of studies on its
pathogenesis. Numerous different genes, such as BRCA1 and
BRCA2, have been implicated in metastatic prostate carcinoma
(6). Yoshida et al found that
BRCA1 and BRCA2 is a cancer precursor that can
substantially affect the invasion of prostate cancer cells
(7). Lee et al suggested that
the PI3k/Akt signaling cascade is important for the migration of
tumor cells. PI3K pathway activation by Src is known to result in
increased cell survival. PI3K is a key regulator of the turnover of
focal adhesion, and is essential for increasing the migration of
cells (8). Senapati et al
considered that during cell migration, when a cell moves forward
and withdraws its rear edge, focal adhesions are disassembled at
this edge. Macrophage inhibitory cytokine-1 (MIC-1)
decreases the level of proliferation, invasion and migration in
prostate cancer cells (9). The
partial degradation of the extracellular matrix is required in
prostate cancer invasion, which is an obligatory step in metastasis
(10).
In order to investigate the pathogenesis of
metastatic prostate carcinoma in the present study, a biological
microarray was used to analyze the expression profiling and
differentially-expressed genes (DEGs) of metastatic prostate
carcinoma and normal prostate cells. In addition, bioinformatics
methods were applied to find all metabolic and non-metabolic
pathways changed in the prostate metastasis cancer cells, and to
investigate the small molecule drugs restoring these pathways.
Materials and methods
Data source
GSE38241 (11), which
included a 21 normal prostate sample microarray and an 18
metastatic prostate carcinoma sample microarray, was downloaded
from the Gene Expression Omnibus (GEO) database (http://www.ncbi.nlm.nih.gov/geo/) of the National
Center for Biotechnology Information. The platform for GSE38241 was
GPL4133 Agilent-014850 Whole Human Genome Microarray 4×44K G4112F
(Feature Number version).
Extraction of DEGs
The R software (v.2.13.0) (12) platform was applied to analyze the
microarray data, and the Geoquery (13) and limma (14) packages were used to preprocess the
data. The Geoquery (15) package can
quickly obtain microarray expression profiling from the GEO
database, and the limma (16) package
can statistically analyze the DEGs; this is the most popular
method. First, the already preprocessed expression profiling was
obtained with the Geoquery package, and then log2
transformation was performed. Finally the limma (linear regression
model package) was applied to select the DEGs by differential
comparison for the data of two groups.
Biological pathways analysis
In order to investigate the changes of metastatic
prostate carcinoma at the molecular level, all metabolic and
non-metabolic pathways were obtained from the public open access
database, WikiPathways (17,18). The Gene Set Analysis Toolkit V2
platform was used to perform WikiPathways cluster analysis for the
DEGs (19) to obtain signal pathways
that were changed in the metastatic prostate carcinoma cells.
Extraction of potential microRNAs
Based on gene annotation data in the MSigDB database
(20), hypergeometric algorithms were
used to calculate the DEGs through gene set enrichment analysis
(GSEA). The Benjamini and Hochberg (BH) algorithm (21) was applied for correction, and finally,
the potential microRNAs were identified.
Expression profiling of small
molecules
The Connectivity Map (CMap) database stores the
expression data of the whole genome-wide transcription of human
cells treated with bioactive small molecules, including a total of
6,100 groups of small molecule interference experiments (small
interfering groups and normal control groups) and 7,056 expression
profiles (22). The gene expression
differences of normal prostate cells and prostate cancer cells were
analyzed and compared with the DEGs caused by these small
interfering expression genes, in order to attempt to identify small
molecules similar or opposite to the expression difference of
normal prostate cells. The DEGs of normal prostate cells and
prostate cancer cells were divided into two categories, the
upregulated genes and the downregulated genes, and a total of 500
most significant probes were selected respectively. The enrichment
value was obtained through GSEA (23)
and comparison with the DEGs was performed by small molecules in
the CMAP database. The value ranged between −1 and 1, and the
closer the value to 1, the more able the small molecules were to
simulate the state of normal prostate cells; by contrast, the
closer the value to −1, the more the small molecules were able to
simulate the state of the prostate cancer cells.
Statistical analysis
Using limma package in R, the expression profiling
of normal prostate cells and metastatic prostate carcinoma cells
was analyzed with a t-test modified by the Bayesian model
(24). The corresponding P-value was
calculated for all genes after the t-test, and the P-value
was corrected with the BH algorithm. A P-value of
<1×10⁻⁸ was selected to indicate a significant
threshold.
Results
Identification of DEGs
Following analysis of expression profiling, a total
of 1,126 DEGs were identified, including 880 known genes (Table I).
 | Table I.Top 10 significant differentially
expressed genes in metastatic prostate carcinoma. |
Table I.
Top 10 significant differentially
expressed genes in metastatic prostate carcinoma.
| Probe ID | adj.P.Val | P-value | logFC | Gene symbol |
|---|
| 28920 |
5.33×10⁻²⁹ |
3.55×10⁻³³ | 4.62666266 | TP63 |
| 39959 |
4.19×10⁻²⁷ |
3.72×10⁻³¹ | 3.08224052 | AOC3 |
| 41458 |
2.14×10⁻²⁶ |
2.85×10⁻³⁰ | 5.13220653 | KRT15 |
| 25789 |
3.47×10⁻²⁶ |
5.60×10⁻³⁰ | 5.25910348 | SYNPO2 |
| 39451 |
3.47×10⁻²⁶ |
6.17×10⁻³⁰ | 3.61424555 | TPM2 |
| 34715 |
4.31×10⁻²⁶ |
8.61×10⁻³⁰ | 4.87226389 | DES |
| 3135 |
7.89×10⁻²⁶ |
1.93×10⁻²⁹ | 3.71685606 | –a |
| 16065 |
1.24×10⁻²⁴ |
3.88×10⁻²⁸ | 3.82946930 | LMOD1 |
| 10357 |
1.24×10⁻²⁴ |
4.14×10⁻²⁸ | 3.47528242 | SRD5A2 |
| 41953 |
1.71×10⁻²⁴ |
6.14×10⁻²⁸ | 2.87266417 | KCNMB1 |
Bio-pathways changed in metastatic
prostate carcinoma
In order to investigate the bio-pathway internal
changes in metastatic prostate carcinoma cells, WikiPathways
sub-pathway enrichment analysis was performed for the DEGs. The
pathways with a P-value of <0.0001, and at least two genes in
the pathway were selected as the significantly changed pathways
(Table II).
| Table II.Bio-pathways changed in metastatic
prostate carcinoma. |
Table II.
Bio-pathways changed in metastatic
prostate carcinoma.
| Pathway | Count | P-value |
|---|
| Muscle cell
TarBase | 35 |
9.72×10⁻¹¹ |
| Lymphocyte
TarBase | 39 |
1.06×10⁻¹⁰ |
| Adipogenesis | 19 |
3.36×10⁻¹⁰ |
| Focal adhesion | 22 |
3.97×10⁻¹⁰ |
| Epithelium
TarBase | 27 |
1.86×10⁻⁸ |
| Arrhythmogenic
right ventricular cardiomyopathy | 15 |
5.37×10⁻⁸ |
| Integrin-mediated
cell adhesion | 12 |
1.00×10⁻⁵ |
| miRNAs in muscle
cell differentiation | 6 |
2.00×10⁻⁴ |
| AGE-RAGE
pathway | 9 |
2.00×10⁻⁴ |
| Androgen receptor
signaling pathway | 10 |
2.00×10⁻⁴ |
| TGFβ signaling
pathway | 12 |
3.00×10⁻⁴ |
| Myometrial
relaxation and contraction pathways | 12 |
8.00×10⁻⁴ |
| Angiogenesis | 5 |
8.00×10⁻⁴ |
| Nuclear
receptors | 6 |
8.00×10⁻⁴ |
Extraction of potential microRNAs
There are two methods for regulating gene
translation, one is using the transcriptional level and the other
is the regulation of the stability of RNA by microRNAs to regulate
gene expression. So the analysis of potential microRNA regulation
was also of particular importance in the present study, and the
potential microRNAs were shown in Table
III.
| Table III.Potential miRNAs in metastatic
prostate carcinoma. |
Table III.
Potential miRNAs in metastatic
prostate carcinoma.
| Target
sequence | Potential
microRNA | P-value |
|---|
| hsa_GTGCCTT | miR-506 |
4.74×10⁻²² |
| hsa_TATTATA | miR-374 |
1.52×10⁻¹³ |
| hsa_AATGTGA | miR-23A,
miR-23B |
1.35×10⁻¹² |
| hsa_TGCTGCT | miR-15A, miR-16,
miR-15B, miR-195, miR-424, miR-497 |
2.10×10⁻¹² |
| hsa_TGCCTTA | miR-124A |
6.65×10⁻¹² |
| hsa_ACTTTAT | miR-142-5P |
1.42×10⁻¹¹ |
| hsa_TTTGCAC | miR-19A,
miR-19B |
1.42×10⁻¹¹ |
| hsa_TGTTTAC | miR-30A-5P,
miR-30C, miR-30D, miR-30B, miR-30E-5P |
9.49×10⁻¹¹ |
| hsa_ATGTACA | miR-493 |
9.49×10⁻¹¹ |
| hsa_GCAAAAA | miR-129 |
2.01×10⁻¹⁰ |
| hsa_TTGCCAA | miR-182 |
2.01×10⁻¹⁰ |
| hsa_CTATGCA | miR-153 |
6.35×10⁻¹⁰ |
| hsa_TGAATGT | miR-181A, miR-181B,
miR-181C, miR-181D |
1.68×10⁻⁹ |
| hsa_ACATTCC | miR-1, miR-206 |
2.16×10⁻⁹ |
| hsa_CTTTGCA | miR-527 |
2.39×10⁻⁹ |
| hsa_AAGCACT | miR-520F |
3.42×10⁻⁹ |
| hsa_TGCTTTG | miR-330 |
5.23×10⁻⁹ |
| hsa_ACTGTGA | miR-27A,
miR-27B |
9.22×10⁻⁹ |
| hsa_GTGCCAA | miR-96 |
1.42×10⁻⁸ |
| hsa_AAAGGGA | miR-204,
miR-211 |
2.37×10⁻⁸ |
| hsa_TGGTGCT | miR-29A, miR-29B,
miR-29C |
2.58×10⁻⁸ |
| hsa_GTATTAT | miR-369-3P |
3.53×10⁻⁸ |
| hsa_CATGTAA | miR-496 |
6.07×10⁻⁸ |
| hsa_CTTTGTA | miR-524 |
7.03×10⁻⁸ |
| hsa_AGGAAGC | miR-516-3P |
1.09×10⁻⁷ |
| hsa_TGCACTG | miR-148A, miR-152,
miR-148B |
1.98×10⁻⁷ |
| hsa_GCTTGAA | miR-498 |
2.74×10⁻⁷ |
| hsa_CAGTATT | miR-200B, miR-200C,
miR-429 |
3.16×10⁻⁷ |
| hsa_GTGACTT | miR-224 |
4.73×10⁻⁷ |
| hsa_TGTGTGA | miR-377 |
5.33×10⁻⁷ |
| hsa_TTGCACT | miR-130A, miR-301,
miR-130B |
5.71×10⁻⁷ |
| hsa_ACCAAAG | miR-9 |
9.58×10⁻⁷ |
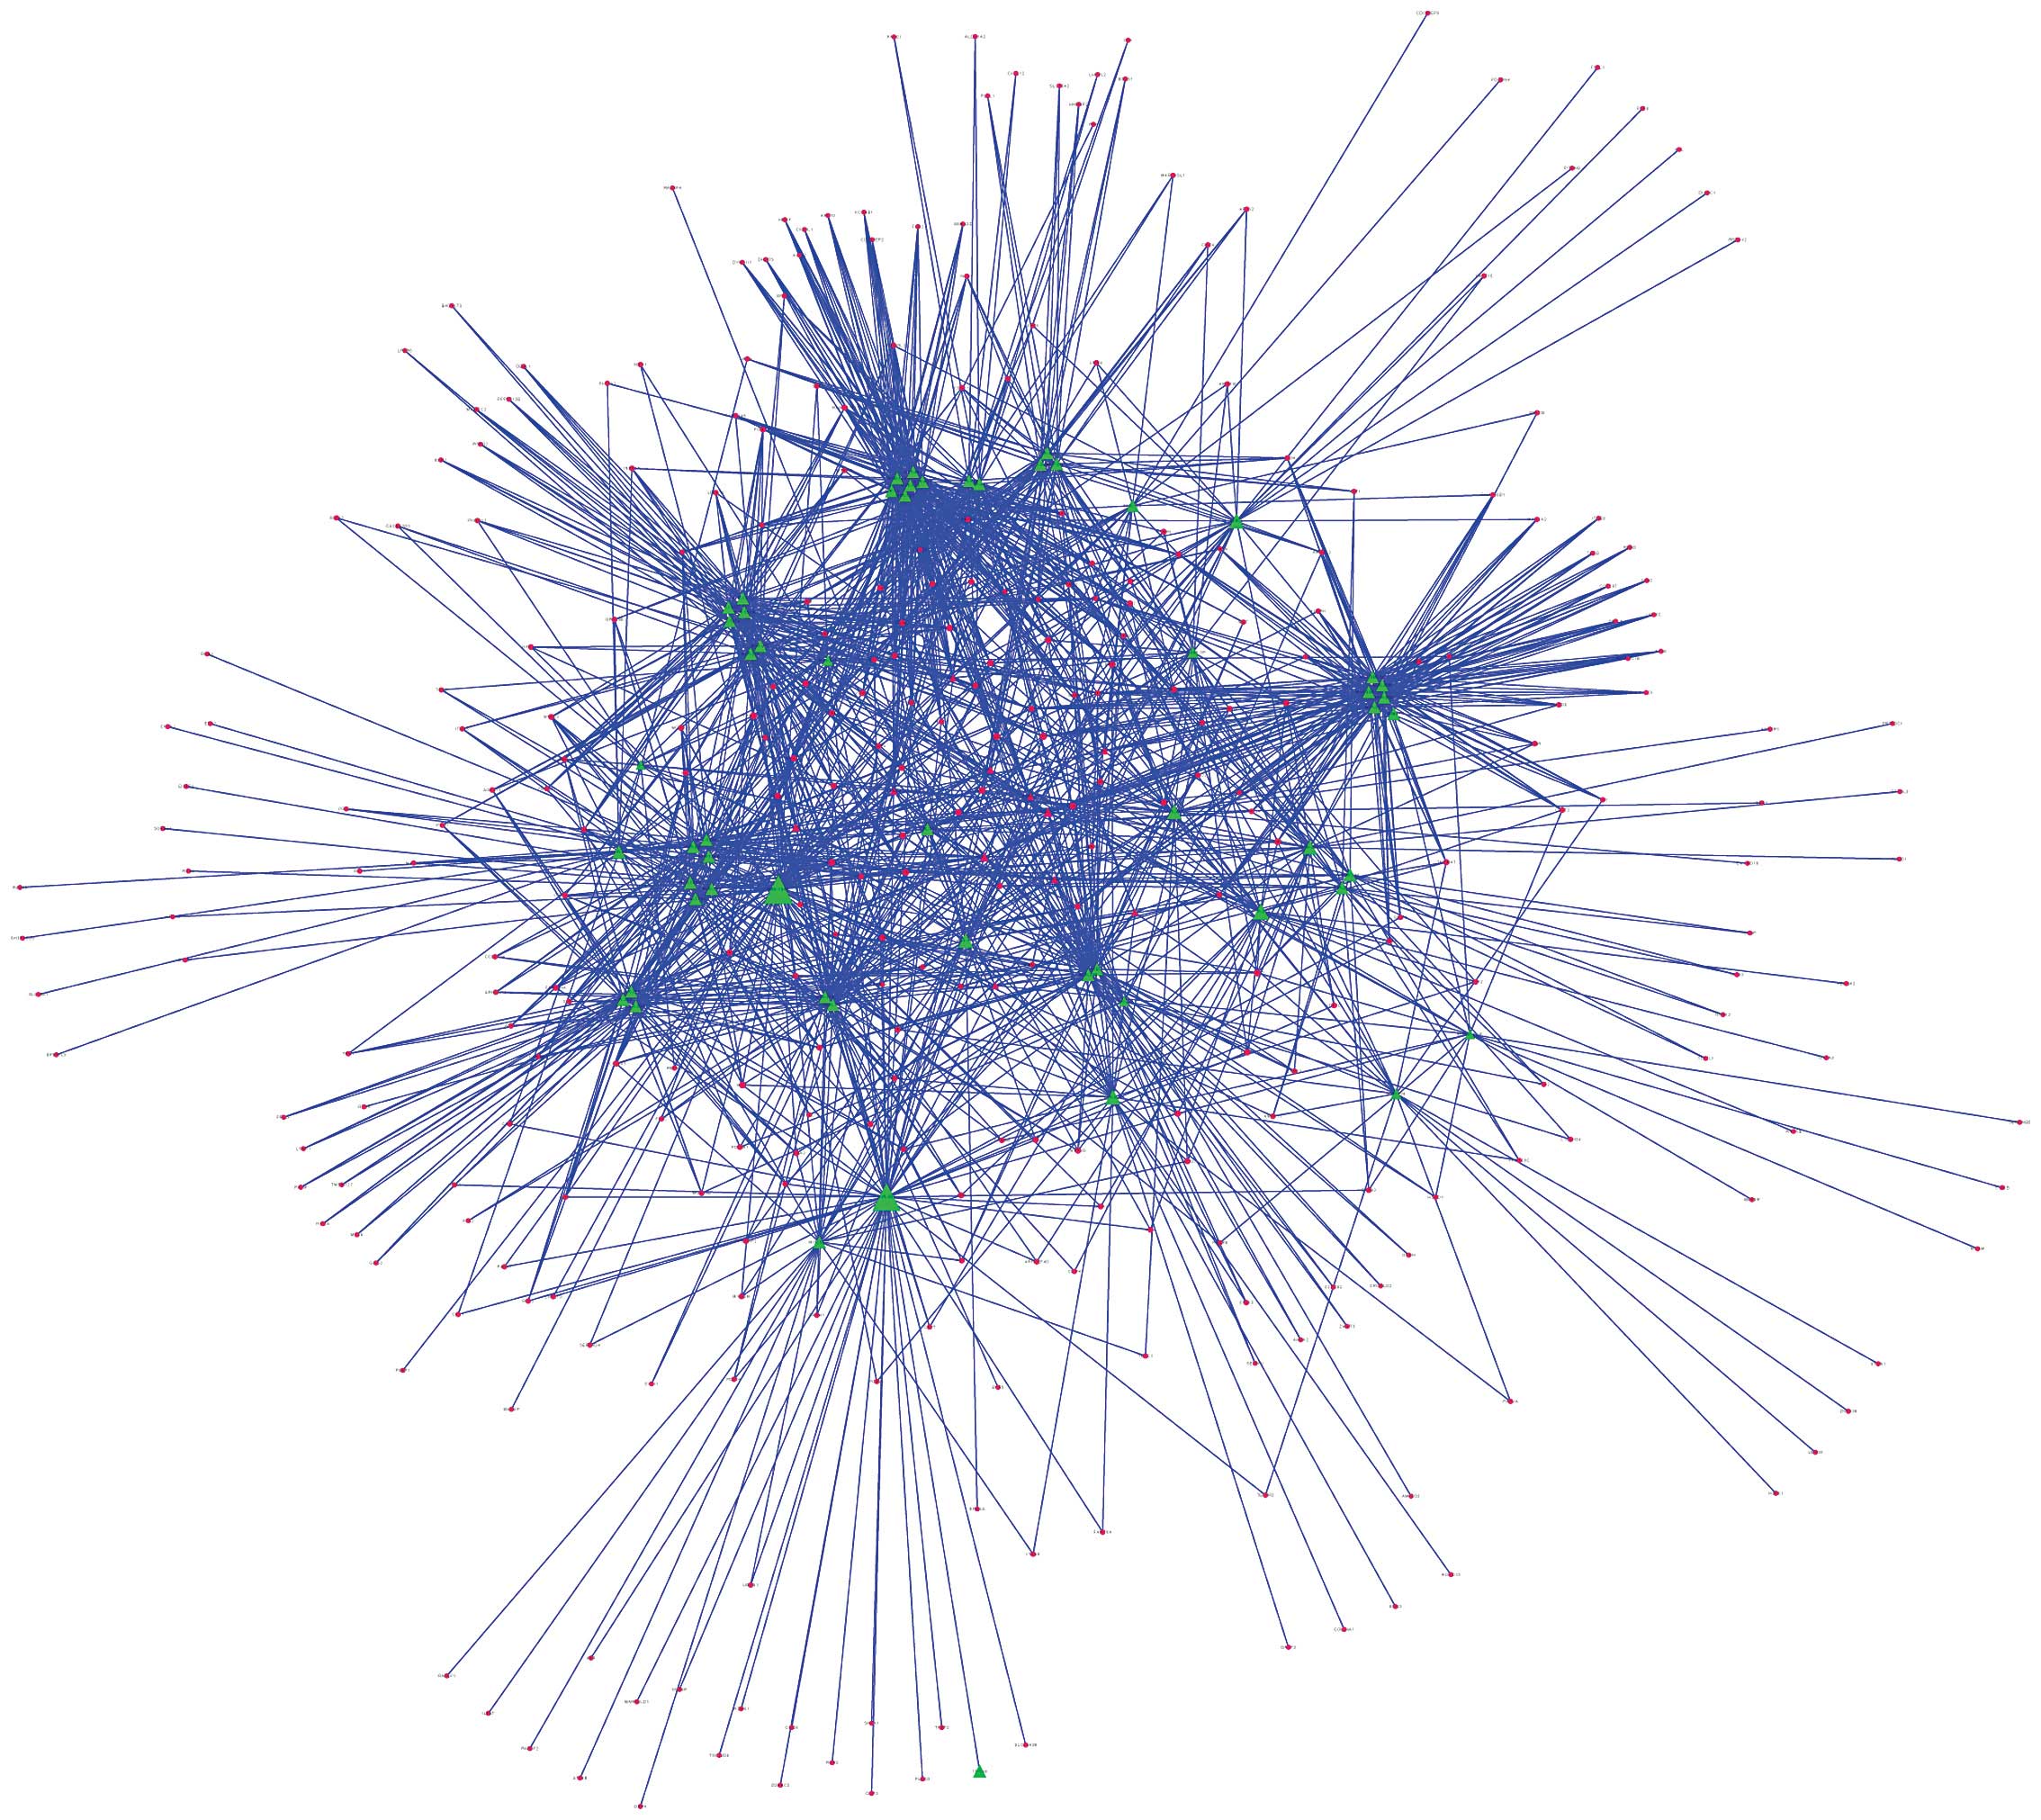
Combined with the potential microRNAs and DEGs, a
microRNA-gene regulatory network was constructed (Fig. 1).
The DEGs subjected to more microRNAs in metastatic
prostate carcinoma may play more important roles. Therefore, the
DEGs regulated by ≥8 microRNAs were screened out to construct a
secondary regulatory network (Fig.
2).
Extraction of small effected
molecules
The ultimate goal of the present study was to
provide aid in the treatment of metastatic prostate carcinoma, and
one of the methods used to do this was to investigate the possible
small molecule drugs for treatment of prostate metastatic
carcinoma. The expressional difference between normal prostate
cells and metastatic prostate carcinoma cells was analyzed, and
then compared with the DEGs affected by small molecules, hoping to
find the small molecule similar or opposite to the gene in the
metastatic prostate carcinoma cells or normal cells. The 20 small
molecules with the strongest correlation (P-value as minimum) are
shown in Table IV.
| Table IV.Differentially-expressed genes and
their regulatory microRNA numbers. |
Table IV.
Differentially-expressed genes and
their regulatory microRNA numbers.
| Gene | Regulatory microRNA
numbers |
|---|
| KPNA4 | 8 |
| EYA1 | 8 |
| SYT1 | 8 |
| PLCB1 | 8 |
| SPRED1 | 8 |
| MBNL2 | 13 |
| RNF165 | 12 |
| MEF2C | 8 |
| MBNL1 | 8 |
| ZFP36L1 | 10 |
| CELF2 | 8 |
As shown in Table V,
the small molecules STOCK1N-35874 (enrichment, 0.989) and 5182598
(enrichment, 0.979) were able to simulate the state of the normal
cells, indicating that these two small molecules were good
potential therapeutic drugs for the treatment of metastatic
prostate carcinoma. Meanwhile, the small molecules MS-275
(enrichment, −0.988) and quinostatin (enrichment, −0.965) could
simulate the state of the metastatic prostate carcinoma cells,
indicating that these two small molecules could cause metastatic
prostate carcinoma.
| Table V.Small effected molecules in
metastatic prostate carcinoma. |
Table V.
Small effected molecules in
metastatic prostate carcinoma.
| CMap name | Enrichment
value | P-value |
|---|
| Geldanamycin | 0.752 | <0.00001 |
| 15-δ prostaglandin
J2 | 0.736 | <0.00001 |
| LY-294002 | −0.335 | <0.00001 |
| Trichostatin A | −0.265 | <0.00001 |
| Sirolimus | −0.327 | 0.00008 |
| MG-262 | 0.960 | 0.00010 |
| STOCK1N-35874 | 0.989 | 0.00016 |
| Diltiazem | −0.835 | 0.00032 |
| Rosiglitazone | 0.537 | 0.00038 |
| MS-275 | −0.988 | 0.00040 |
| Hesperetin | −0.810 | 0.00056 |
| Heptaminol | 0.809 | 0.00060 |
| 5182598 | 0.979 | 0.00076 |
| Fluphenazine | −0.445 | 0.00113 |
| Bumetanide | 0.829 | 0.00127 |
| Dinoprost | 0.823 | 0.00161 |
| Acemetacin | 0.822 | 0.00167 |
| Fenoprofen | −0.695 | 0.00197 |
| Nifuroxazide | −0.807 | 0.00267 |
| Quinostatin | −0.965 | 0.00280 |
Discussion
Prostate cancer is a malignancy that can occur in
the prostate tissue of men. As of 2011, prostate cancer is the
second most commonly diagnosed cancer and the sixth leading cause
of cancer-associated mortality in men worldwide (25). The incidence of prostate cancer has
clear geographical and ethnic differences. In Europe and other
developed countries and regions, it is the most common male cancer,
while in the USA, it is the second leading cause of
cancer-associated mortality in men following lung cancer. In Asia,
the incidence of prostate cancer is lower compared with Western
countries, but this level has shown a rapidly increasing trend in
recent years (26). Additionally, the
cancer cells may metastasize from the prostate to other regions of
the body, which can cause more harm. Therefore, it is of great
significance for human health to study the pathogenesis of
metastatic prostate carcinoma. The original study on GSE38241 data
mainly studied and discussed the DNA modification in metastatic
prostate carcinoma, however the present study focused on the gene
expression of the disease. A total of 1,126 DEGs and a number of
significantly changed biological pathways were identified. In
addition, KPNA4, SYT1, PLCB1, SPRED1,
MBNL2, RNF165, MEF2C, MBNL1,
ZFP36L1 and CELF2 were found to be likely to play
significant roles in the process of metastatic prostate carcinoma,
according to their functions. Finally the small molecules
STOCK1N-35874 and 5182598 were identified as good potential
therapeutic drugs for the treatment of metastatic prostate
carcinoma, while the two small molecules MS-275 and quinostatin
could cause metastatic prostate carcinoma.
WikiPathways pathway clustering showed that the
changes in a series of important signaling pathways in metastatic
prostate carcinoma result in the changes of surface binding and
cell morphogenesis in the disease, causing the easy migration of
cancer cells in the body. Certain changes in surface binding,
including focal adhesion, epithelium TarBase and the
integrin-mediated cell adhesion pathway, can promote prostate
cancer cells to more easily separate from the lesion and thus
transfer to another region of the body (11). Certain changes in muscle cell TarBase,
miRNAs in muscle cell differentiation, myometrial relaxation and
contraction pathways mean that metastatic cells may be biased to
muscle cell differentiation, causing a stronger ability to move.
Certain signaling pathway changes, such as changes in the advanced
glycation end products (AGE)-receptor for AGE pathway, the androgen
receptor signaling pathway, the transforming growth factor β
signaling pathway and the nuclear receptors pathway, can result in
the changes of downstream genes. The angiogenesis pathway is likely
to provide convenience for the transfer of cancer cells, while
adipogenesis is associated with energy regulation (27,28). The
changes to the lymphocyte TarBase aid the migrated cells in
escaping immune attack (29). It is
notable that metastatic prostate carcinoma not only damages the
prostate cells, but also damages the other organs in the body and
causes a series of complications, such as skeletal
abnormalities.
In addition, as a large number of DEGs in metastatic
prostate carcinoma may have the same transcription factor targets
and microRNA regulation targets, these loci may play significant
roles in the regulation of gene expression. Among these genes,
MBNL1, MBNL2 and CELF2 regulate the
alternative splicing of genes (30–32),
KPNA4 is a localization signal protein in the cytoplasm
(33), and ZFP36L1 is an
important transcription factor response to growth factors (34). SYT1 is a Ca2+
signaling reception protein in the cytoplasmic membrane (35), PLCB1 catalyzes
phosphatidylinositol-4,5-bisphosphate to
inositol-1,4,5-trisphosphate and diacylglycerol (36), and SPRED1 regulates
intracellular signaling pathway mitogen-activated protein kinase
activation (37). RNF165 and
MEF2C regulate cell movement (38). These genes are all likely to play
important roles in the process of metastatic prostate carcinoma
according to their functions.
Based on CMap database, a series of small molecules
was obtained in the present study. STOCK1N-35874 is a cytotoxic
quinoline alkaloid that inhibits the DNA enzyme topoisomerase,
which is isolated from the bark and stem of Camptotheca
acuminata (39). STOCK1N-35874
showed marked anticancer activity in preliminary clinical trials,
and its analogues have been used in cancer chemotherapy (40,41).
5182598 is considered to be an important anticancer drug from the
group of benzylisoquinoline alkaloids (42). These two small molecules are able to
repair the damaged metabolic pathways in metastatic prostate
carcinoma, and are good potential therapeutic drugs for the
treatment of metastatic prostate carcinoma.
References
|
1
|
Marks LS, Fradet Y, Deras IL, Blase A,
Mathis J, Aubin SM, Cancio AT, Desaulniers M, Ellis WJ, Rittenhouse
H, et al: PCA3 molecular urine assay for prostate cancer in men
undergoing repeat biopsy. Urology. 69:532–535. 2007. View Article : Google Scholar : PubMed/NCBI
|
|
2
|
Andriole GL, Crawford ED, Grubb RL III,
Buys SS, Chia D, Church TR, Fouad MN, Isaacs C, Kvale PA, Reding
DJ, et al: Prostate cancer screening in the randomized prostate,
lung, colorectal, and ovarian cancer screening trial: Mortality
results after 13 years of follow-up. J Natl Cancer Inst.
104:125–132. 2012. View Article : Google Scholar : PubMed/NCBI
|
|
3
|
Schröder FH, Hugosson J, Roobol MJ,
Tammela TL, Ciatto S, Nelen V, Kwiatkowski M, Lujan M, Lilja H,
Zappa M, et al: Prostate-cancer mortality at 11 years of follow-up.
N Engl J Med. 366:981–990. 2012. View Article : Google Scholar : PubMed/NCBI
|
|
4
|
Alhasan AH, Kim DY, Daniel WL, Watson E,
Meeks JJ, Thaxton CS and Mirkin CA: Scanometric MicroRNA array
profiling of prostate cancer markers using spherical nucleic
acid-gold nanoparticle conjugates. Anal Chem. 84:4153–4160. 2012.
View Article : Google Scholar : PubMed/NCBI
|
|
5
|
Hessels D, Klein Gunnewiek JMT, van Oort
I, Karthaus HF, van Leenders GJ, van Balken B, Kiemeney LA, Witjes
JA and Schalken JA: DD3 (PCA3)-based molecular urine analysis for
the diagnosis of prostate cancer. Eur Urol. 44:8–15. 2003.
View Article : Google Scholar : PubMed/NCBI
|
|
6
|
Struewing JP, Hartge P, Wacholder S, Baker
SM, Berlin M, McAdams M, Timmerman MM, Brody LC and Tucker MA: The
risk of cancer associated with specific mutations of BRCA1 and
BRCA2 among Ashkenazi Jews. N Engl J Med. 336:1401–1408. 1997.
View Article : Google Scholar : PubMed/NCBI
|
|
7
|
Yoshida S, Tsutsumi S, Muhlebach G,
Sourbier C, Lee MJ, Lee S, Vartholomaiou E, Tatokoro M, Beebe K,
Miyajima N, et al: Molecular chaperone TRAP1 regulates a metabolic
switch between mitochondrial respiration and aerobic glycolysis.
Proc Natl Acad Sci USA. 110:E1604–E1612. 2013. View Article : Google Scholar : PubMed/NCBI
|
|
8
|
Lee C, Zhang Q, Zi X, Dash A, Soares MB,
Rahmatpanah F, Jia Z, McClelland M and Mercola D: TGF-β mediated
DNA methylation in prostate cancer. Transl Androl Urol. 1:78–88.
2012.PubMed/NCBI
|
|
9
|
Senapati S, Rachagani S, Chaudhary K,
Johansson SL, Singh RK and Batra SK: Overexpression of macrophage
inhibitory cytokine-1 induces metastasis of human prostate cancer
cells through the FAK-RhoA signaling pathway. Oncogene.
29:1293–1302. 2010. View Article : Google Scholar : PubMed/NCBI
|
|
10
|
Jin JK, Dayyani F and Gallick GE: Steps in
prostate cancer progression that lead to bone metastasis. Int J
Cancer. 128:2545–2561. 2011. View Article : Google Scholar : PubMed/NCBI
|
|
11
|
Aryee MJ, Liu W, Engelmann JC, Nuhn P,
Gurel M, Haffner MC, Esopi D, Irizarry RA, Getzenberg RH, Nelson
WG, et al: DNA methylation alterations exhibit intraindividual
stability and interindividual heterogeneity in prostate cancer
metastases. Sci Transl Med. 5:169ra1102013. View Article : Google Scholar
|
|
12
|
R Development Core Team, . R: A Language
and Environment for Statistical Computing. http://www.r-project.org/R Foundation for
Statistical Computing; Vienna, Austria: 2008
|
|
13
|
Davis S and Meltzer PS: GEOquery: A bridge
between the gene expression omnibus (GEO) and BioConductor.
Bioinformatics. 23:1846–1847. 2007. View Article : Google Scholar : PubMed/NCBI
|
|
14
|
Diboun I, Wernisch L, Orengo CA and
Koltzenburg M: Microarray analysis after RNA amplification can
detect pronounced differences in gene expression using limma. BMC
Genomics. 7:2522006. View Article : Google Scholar : PubMed/NCBI
|
|
15
|
Barrett T, Troup DB, Wilhite SE, Ledoux P,
Evangelista C, Kim IF, Tomashevsky M, Marshall KA, Phillippy KH,
Sherman PM, et al: NCBI GEO: Archive for functional genomics data
sets-10 years on. Nucleic Acids Res. 39:D1005–D1010. 2011.
View Article : Google Scholar : PubMed/NCBI
|
|
16
|
Smyth GK: Linear models and empirical
bayes methods for assessing differential expression in microarray
experiments. Stat Appl Genet Mol Biol. 3:: 2004.PubMed/NCBI
|
|
17
|
Kelder T, van Iersel MP, Hanspers K,
Kutmon M, Conklin BR, Evelo CT and Pico AR: WikiPathways: Building
research communities on biological pathways. Nucleic Acids Res.
40:D1301–D1307. 2012. View Article : Google Scholar : PubMed/NCBI
|
|
18
|
Pico AR, Kelder T, van Iersel MP, Hanspers
K, Conklin BR and Evelo C: WikiPathways: Pathway editing for the
people. PLoS Biol. 6:e1842008. View Article : Google Scholar : PubMed/NCBI
|
|
19
|
Zhang B, Kirov S and Snoddy J: WebGestalt:
An integrated system for exploring gene sets in various biological
contexts. Nucleic Acids Res. 33:W741–W748. 2005. View Article : Google Scholar : PubMed/NCBI
|
|
20
|
Liberzon A, Subramanian A, Pinchback R,
Thorvaldsdóttir H, Tamayo P and Mesirov JP: Molecular signatures
database (MSigDB) 3.0. Bioinformatics. 27:1739–1740. 2011.
View Article : Google Scholar : PubMed/NCBI
|
|
21
|
Benjamini Y and Hochberg Y: Controlling
the false discovery rate: A practical and powerful approach to
multiple testing. J Roy Statist Soc Ser B (Methodological).
57:289–300. 1995.
|
|
22
|
Lamb J, Crawford ED, Peck D, Modell JW,
Blat IC, Wrobel MJ, Lerner J, Brunet JP, Subramanian A, Ross KN, et
al: The Connectivity Map: Using gene-expression signatures to
connect small molecules, genes, and disease. Science.
313:1929–1935. 2006. View Article : Google Scholar : PubMed/NCBI
|
|
23
|
Subramanian A, Tamayo P, Mootha VK,
Mukherjee S, Ebert BL, Gillette MA, Paulovich A, Pomeroy SL, Golub
TR, Lander ES, et al: Gene set enrichment analysis: A
knowledge-based approach for interpreting genome-wide expression
profiles. Proc Natl Acad Sci USA. 102:15545–15550. 2005. View Article : Google Scholar : PubMed/NCBI
|
|
24
|
Baldi P and Long AD: A Bayesian framework
for the analysis of microarray expression data: Regularized t-test
and statistical inferences of gene changes. Bioinformatics.
17:509–519. 2001. View Article : Google Scholar : PubMed/NCBI
|
|
25
|
Jemal A, Bray F, Center MM, Ferlay J, Ward
E and Forman D: Global cancer statistics. CA Cancer J Clin.
61:69–90. 2011. View Article : Google Scholar : PubMed/NCBI
|
|
26
|
Siegel R, Naishadham D and Jemal A: Cancer
statistics, 2012. CA Cancer J Clin. 62:10–29. 2012. View Article : Google Scholar : PubMed/NCBI
|
|
27
|
Amankwah EK, Sellers TA and Park JY: Gene
variants in the angiogenesis pathway and prostate cancer.
Carcinogenesis. 33:1259–1269. 2012. View Article : Google Scholar : PubMed/NCBI
|
|
28
|
Hinoi E, Nakamura Y, Takada S, Fujita H,
Iezaki T, Hashizume S, Takahashi S, Odaka Y, Watanabe T and Yoneda
Y: Growth differentiation factor-5 promotes brown adipogenesis in
systemic energy expenditure. Diabetes. 63:162–175. 2013. View Article : Google Scholar : PubMed/NCBI
|
|
29
|
Rivoltini L, Carrabba M, Huber V, Castelli
C, Novellino L, Dalerba P, Mortarini R, Arancia G, Anichini A, Fais
S, et al: Immunity to cancer: attack and escape in T
lymphocyte-tumor cell interaction. Immunol Rev. 188:97–113. 2002.
View Article : Google Scholar : PubMed/NCBI
|
|
30
|
Lin X, Miller JW, Mankodi A, Kanadia RN,
Yuan Y, Moxley RT, Swanson MS and Thornton CA: Failure of
MBNL1-dependent post-natal splicing transitions in myotonic
dystrophy. Hum Mol Genet. 15:2087–2097. 2006. View Article : Google Scholar : PubMed/NCBI
|
|
31
|
Hao M, Akrami K, Wei K, De Diego C, Che N,
Ku JH, Tidball J, Graves MC, Shieh PB and Chen F: Muscleblind-like
2 (Mbnl2)-deficient mice as a model for myotonic dystrophy. Dev
Dyn. 237:403–410. 2008. View Article : Google Scholar : PubMed/NCBI
|
|
32
|
Miyazaki Y, Adachi H, Katsuno M,
Minamiyama M, Jiang YM, Huang Z, Doi H, Matsumoto S, Kondo N, Iida
M, et al: Viral delivery of miR-196a ameliorates the SBMA phenotype
via the silencing of CELF2. Nat Med. 18:1136–1141. 2012. View Article : Google Scholar : PubMed/NCBI
|
|
33
|
Braunagel SC, Williamson ST, Ding Q, Wu X
and Summers MD: Early sorting of inner nuclear membrane proteins is
conserved. Proc Natl Acad Sci USA. 104:9307–9312. 2007. View Article : Google Scholar : PubMed/NCBI
|
|
34
|
Stumpo DJ, Byrd NA, Phillips RS, Ghosh S,
Maronpot RR, Castranio T, Meyers EN, Mishina Y and Blackshear PJ:
Chorioallantoic fusion defects and embryonic lethality resulting
from disruption of Zfp36L1, a gene encoding a CCCH tandem zinc
finger protein of the Tristetraprolin family. Mol Cell Biol.
24:6445–6455. 2004. View Article : Google Scholar : PubMed/NCBI
|
|
35
|
Yamazaki T, Kawamura Y, Minami A and
Uemura M: Calcium-dependent freezing tolerance in
Arabidopsis involves membrane resealing via synaptotagmin
SYT1. Plant Cell. 20:3389–3404. 2008. View Article : Google Scholar : PubMed/NCBI
|
|
36
|
Poduri A, Chopra SS, Neilan EG, Elhosary
PC, Kurian MA, Meyer E, Barry BJ, Khwaja OS, Salih MA, Stödberg T,
et al: Homozygous PLCB1 deletion associated with malignant
migrating partial seizures in infancy. Epilepsia. 53:e146–e150.
2012. View Article : Google Scholar : PubMed/NCBI
|
|
37
|
Brems H, Chmara M, Sahbatou M, Denayer E,
Taniguchi K, Kato R, Somers R, Messiaen L, De Schepper S, Fryns JP,
et al: Germline loss-of-function mutations in SPRED1 cause a
neurofibromatosis 1-like phenotype. Nat Genet. 39:1120–1126. 2007.
View Article : Google Scholar : PubMed/NCBI
|
|
38
|
Kelly CE, Thymiakou E, Dixon JE, Tanaka S,
Godwin J and Episkopou V: Rnf165/Ark2C enhances BMP-Smad signaling
to mediate motor axon extension. PLoS Biol. 11:e10015382013.
View Article : Google Scholar : PubMed/NCBI
|
|
39
|
Wink M: Molecular modes of action of
cytotoxic alkaloids: from DNA intercalation, spindle poisoning,
topoisomerase inhibition to apoptosis and multiple drug resistance.
Alkaloids Chem Biol. 64:1–47. 2007. View Article : Google Scholar : PubMed/NCBI
|
|
40
|
Mei L, Chen Y, Wang Z, Wang J, Wan J, Yu
C, Liu X and Li W: Synergistic anti-tumour effects of tetrandrine
and chloroquine combination therapy in human cancer: a potential
antagonistic role for p21. Br J Pharmacol. 172:2232–2245. 2015.
View Article : Google Scholar : PubMed/NCBI
|
|
41
|
Solomon VR and Lee H: Quinoline as a
privileged scaffold in cancer drug discovery. Curr Med Chem.
18:1488–1508. 2011. View Article : Google Scholar : PubMed/NCBI
|
|
42
|
Cordell GA, Quinn-Beattie ML and
Farnsworth NR: The potential of alkaloids in drug discovery.
Phytother Res. 15:183–205. 2001. View Article : Google Scholar : PubMed/NCBI
|