Introduction
Lung cancer is one of the most common cancer types
in the world. Small cell lung cancer (SCLC) represents 15–20% of
all lung cancers (1). This disease is
characterized by rapid tumor growth and early metastatic spread
(2), which lead to a high rate of
relapse and a poor prognosis. Since the 1980s, the standard
chemotherapy for SCLC has been a cisplatin-etoposide combination.
Practically all affected patients are treated with chemotherapy,
either alone or in combination with a local therapy, such as
radiation therapy. Although SCLC is one of the most chemo-sensitive
solid tumors (3), recurrences occur
in the majority of patients, particularly in the first year
(4).
As neuroendocrine differentiation is considered to
be an important feature of SCLC, neuron-specific enolase (NSE) has
been utilized as a marker for its diagnosis and therapeutic
monitoring. Moreover, it has been found that the levels of this
marker have prognostic value. A previous study found that the
percentage change in NSE level correlated with the percent decrease
in the sum of the tumor diameters in patients with SCLC (5). Therefore, the serum NSE level may be
associated with the tumor burden in SCLC patients.
Fluorine-18 fluorodeoxyglucose (18F-FDG)
PET/CT (PET/CT) is a hybrid imaging modality that is able to
provide functional and anatomical information. Successful FDG PET
scanning has been performed in a wide variety of cancers and been
identified as a sensitive imaging tool in a number of studies,
based on its usefulness in the detection of recurrence, accurate
staging and the impact on the management of SCLC (6). In patients with recurrent colorectal
cancer, a correlation has been found between serum carcinoembryonic
antigen (CEA) and metabolic tumor volume (MTV), as determined by
FDG PET (7), which indicates that
tumor volume determined by FDG PET can be utilized as an effective
marker of the tumor burden in post-operative colorectal carcinoma
patients. The present study was undertaken to investigate the
correlation between tumor MTV or total lesion glycolysis (TLG), as
determined by 18F-FDG PET/CT, and the serum level of
tumor markers in recurrent SCLC patients. This may serve as a basic
study for tumor markers and FDG PET use in recurrent SCLC.
Patients and methods
Between October 2009 and December 2011, a search was
performed for all patients who had been diagnosed with recurrent
SCLC in the PET center database of the Shandong Cancer Hospital
(Shandong University, Jinan, Shandong, China). The patient
selection criteria were for recurrent patients who had been
previously treated by standard chemotherapy with a response
evaluation showing complete remission. Serum CEA, NSE and
cytokeratin 19 fragment 21-1 (CYFRA 21-1) levels were evaluated at
the time of the 18F-FDG PET/CT examination. A total of
21 patients were enrolled in the present study (Table I). Of these, 17 patients had lactate
dehydrogenase (LDH) data. The mean age of the patients was 62.2
years (range, 37–79 years). The patients were staged according to a
two-stage system that divided SCLC into limited disease (LD) and
extensive disease (ED). LD was defined as disease confined to the
ipsilateral hemithorax that can be safely included in a tolerable
radiation field, and all remaining cases were considered to be ED
(8). Of the 21 patients, 14 were
staged as LD and 7 as ED. Based on the lesion site, FDG PET
revealed that 18 patients presented with recurrent lung lesions, 10
patients with lymph node lesions, 3 patients with bone lesions and
1 patient with an adrenal gland lesion (Table II). All recurrent or metastatic
lesions were verified according to histological analysis. Ethical
approval was obtained from the Ethics Committee of Shandong
University and the study was performed according to the Declaration
of Helsinki (2013) (9).
 | Table I.Basic information for 21 patients. |
Table I.
Basic information for 21 patients.
| Characteristic | Value |
|---|
| Age, years |
|
|
Range | 37–79 |
| Mean | 62.29 |
| <60, n
(%) | 10 (47.6) |
| >60, n
(%) | 11 (52.4) |
| Gender, n (%) |
| Male | 17 (81.0) |
|
Female | 4
(19.0) |
| Staging, n (%) |
| LD | 14 (66.7) |
| ED | 7
(33.3) |
| NSE level, n (%) |
| >17
ng/ml | 11 (52.4) |
| <17
ng/ml | 10 (47.6) |
| Number of lesions, n
(%) |
| One | 12 (57.1) |
| Two | 6
(28.6) |
|
Three | 3
(14.3) |
| Lesion sites, n
(%) |
|
Lungs | 18 (85.7) |
| Lymph
node | 10 (47.6) |
|
Adrenal | 1 (4.8) |
| Bone | 3
(14.3) |
| Table II.Data on tumor markers, MTV and TLG for
21 patients. |
Table II.
Data on tumor markers, MTV and TLG for
21 patients.
| Patient no. | NSE, ng/ml | LDH, U/l | CEA, ng/ml | CYFRA 21-1,
ng/ml | Lesion sites | MTV,
cm3 | TLG,
cm3 |
|---|
| 1 | 8.73 | 176 | 1.160 | 1.67 | Lung | 3.867 | 14.712 |
| 2 | 16.82 | 191 | 1.260 | 2.07 | Lung | 7.073 | 22.901 |
| 3 | 8.26 | 140 | 1.600 | 1.94 | Lung | 3.403 | 11.225 |
| 4 | 10.52 | 192 | 17.490 | 1.82 | Lung | 6.659 | 21.202 |
| 5 | 12.34 | 185 | 0.676 | 1.55 | Lung | 11.910 | 39.386 |
| 6 | 12.10 | 142 | 1.360 | 1.14 | Lymph node | 4.401 | 16.821 |
| 7 | 38.19 | 232 | 398.100 | 5.09 | Lung, bone | 34.090 | 133.225 |
| 8 | 12.92 | 165 | 2.230 | 1.43 | Lung | 0.450 | 1.363 |
| 9 | 11.70 | 141 | 0.912 | 1.47 | Lymph node | 5.810 | 21.381 |
| 10 | 27.45 | 225 | 1.670 | 4.80 | Lung, lymph
node | 70.122 | 293.581 |
| 11 | 26.57 | 129 | 2.730 | 2.43 | Lung, lymph
node | 97.225 | 458.870 |
| 12 | 57.83 | 158 | 1.040 | 3.35 | Lung, lymph
node | 139.712 | 583.410 |
| 13 | 55.52 | 384 | 9.020 | 8.83 | Lung, lymph node,
bone | 75.416 | 324.096 |
| 14 | 42.62 | 241 | 9.990 | 4.42 | Lung | 116.111 | 694.818 |
| 15 | 11.34 | 141 | 3.350 | 5.56 | Lung | 10.809 | 39.816 |
| 16 | 26.19 | NA | 7.190 | 1.27 | Lung, lymph
node | 106.469 | 358.616 |
| 17 | 10.22 | NA | 2.610 | 3.54 | Lung | 2.766 | 9.324 |
| 18 | 17.69 | NA | 3.860 | 1.11 | Lung, lymph
node | 23.233 | 91.964 |
| 19 | 293.80 | 455 | 3.390 | 3.09 | Lymph node,
adrenal | 213.786 | 1283.235 |
| 20 | 25.33 | 169 | 1.350 | 3.35 | Lung, lymph node,
bone | 27.093 | 137.859 |
| 21 | 16.80 | NA | 3.230 | 2.55 | Lung | 2.180 | 7.962 |
FDG-PET imaging protocol
Whole-body PET scans were performed using a Xeleris
workstation (GE Healthcare Life Sciences, Shanghai, China). All
patients fasted for at least 6 h prior to the intravenous
administration of FDG. Image acquisitions for torso scanning were
started at ~1 h after the injection of 7.4 MBq FDG per kilogram of
body weight, and regional emission images were obtained for 30 min
in the two-dimensional mode. Transmission scanning with three
germanium-68 ring sources was performed for 2 min per bed in
whole-body transmission and for 20 min in regional transmission to
correct attenuation. Images were visually interpreted by consensus
between two experienced nuclear physicians. Standardized uptake
values (SUV) were calculated from the amount of FDG injected, the
body weight and the target tissue uptake in regional attenuation
corrected images.
MTV and TLG of tumors
For the various methods for metabolic volume
measurement, an SUV cut-off of 2.5 was used. This meant that the
PET area was delineated by a circle encompassing regions equal or
greater than a SUV of 2.5. The MTV of each slice was determined by
multiplying the area within the thresholded margin by the CT
interval. The final MTV was calculated by adding the MTVs of each
slice. Maximum and mean SUVs within the MTV were calculated
automatically, and TLG was calculated by multiplying the
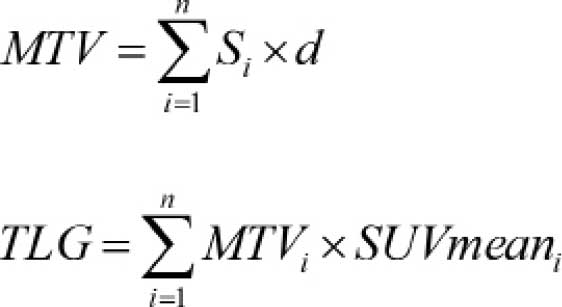
MTV by the mean SUV. The following formulae were
used to calculate MTV and TLG:
Si represents the area with abnormal
metabolism of each slice, d represents the interval of the CT scan,
MTVi represents the MTV of each slice;
SUVmeani represents the mean SUV of each slice and n
represents the number of slices with abnormal metabolism.
Statistical analysis
All data were analyzed using Statistical Package for
the Social Sciences (SPSS) 17.0 software (SPSS, Inc., Chicago, IL,
USA). Differences between groups were analyzed using an independent
two-sample t-test. The Pearson rank correlation analysis was used
to evaluate the correlation between two groups. P<0.05 was used
to indicate a statistically significant difference.
Result
In 21 patients, the mean serum NSE level was
35.38±61.03 ng/ml (range, 8.26–293.80 ng/ml); 11 patients exhibited
normal NSE levels (<17 ng/ml), while the other 10 exhibited
abnormal levels. The mean serum CEA level was 22.58±86.14 ng/ml
(range, 0.67–398.10 ng/ml) and the mean CYFRA 21-1 level was
2.97±1.91 ng/ml (range, 1.11–8.83 ng/ml). The mean MTV was
45.837±58.676 cm3 (range, 0.450–213.786 cm3),
while the mean TLG was 217.417±320.788 cm3 (range,
1.363–1283.235 cm3).
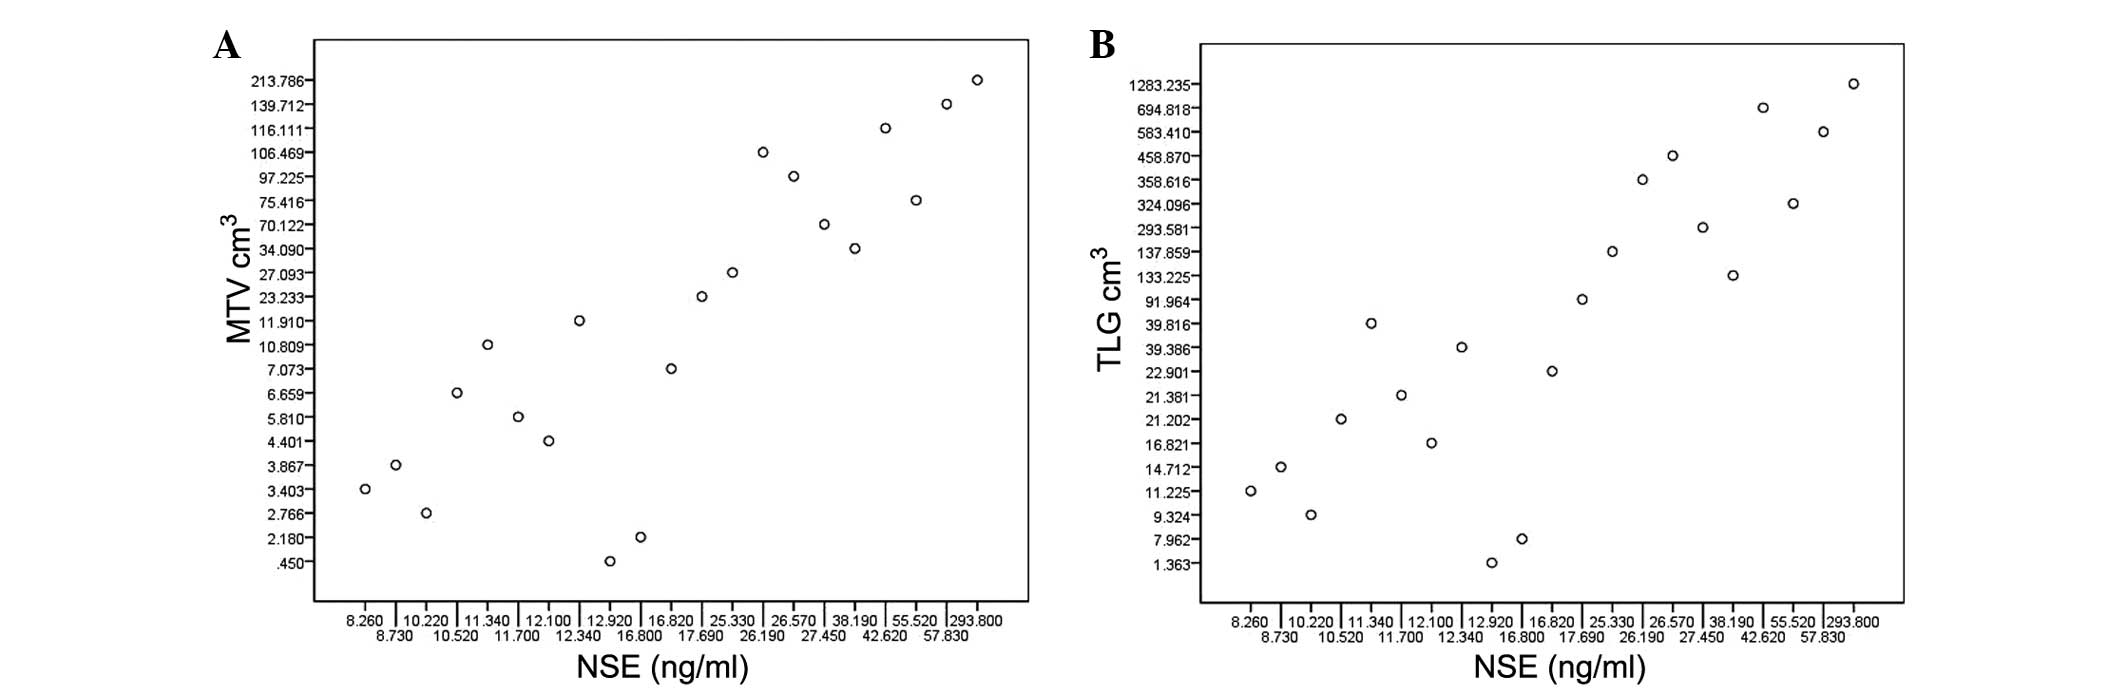
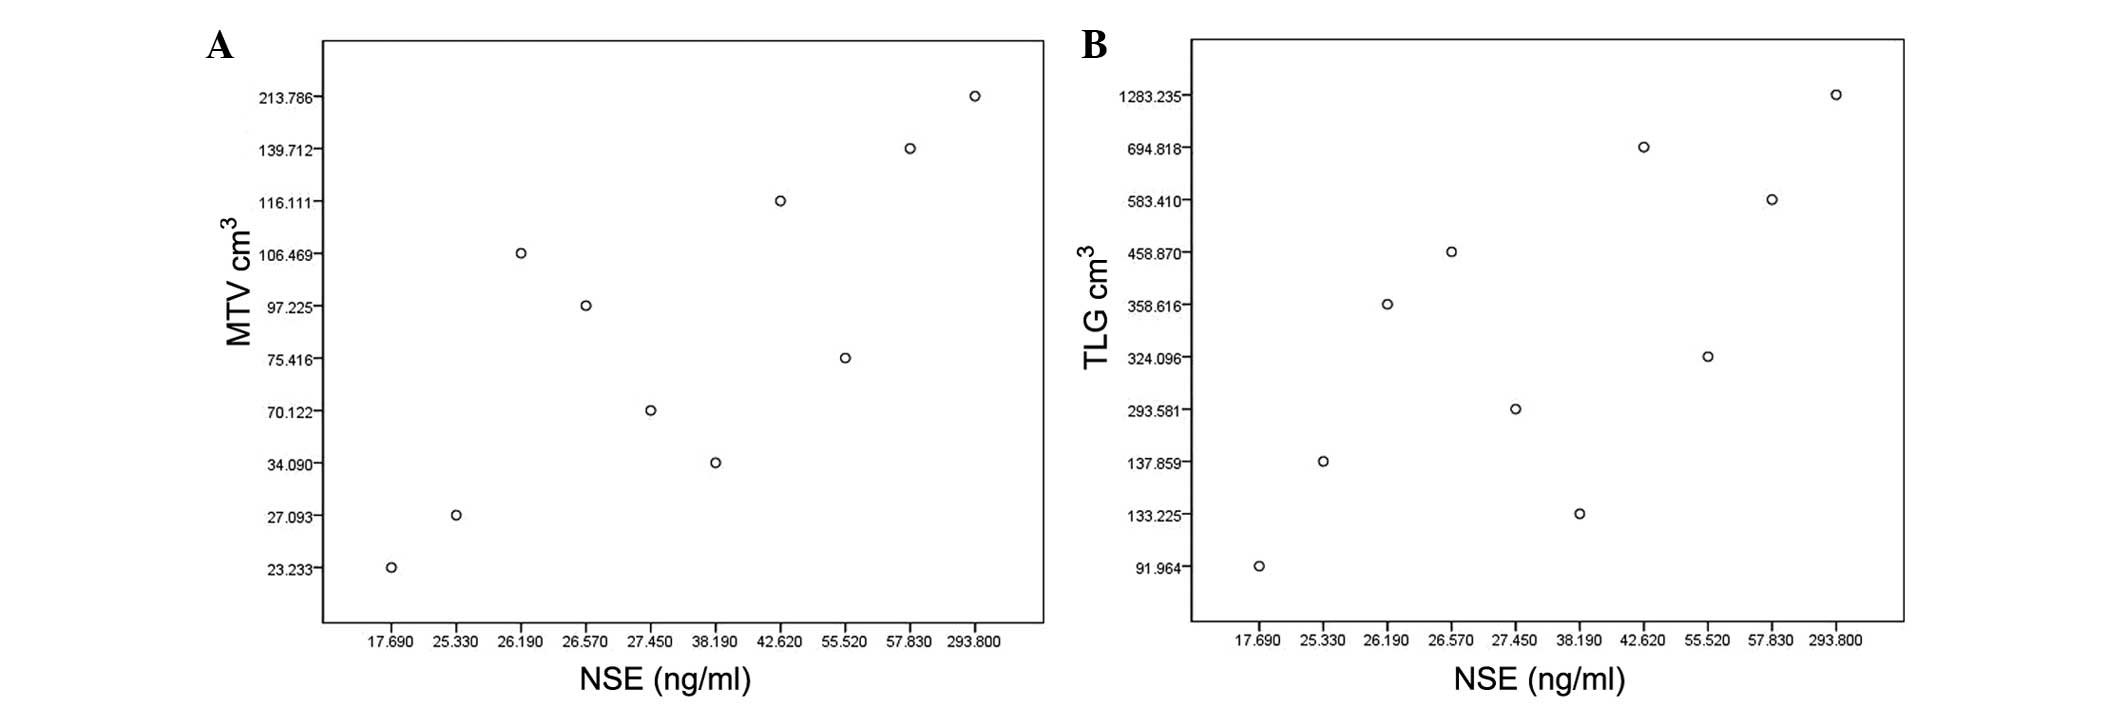
Pearson correlation analyses showed a strong
correlation between the NSE level and MTV or TLG (r=0.787,
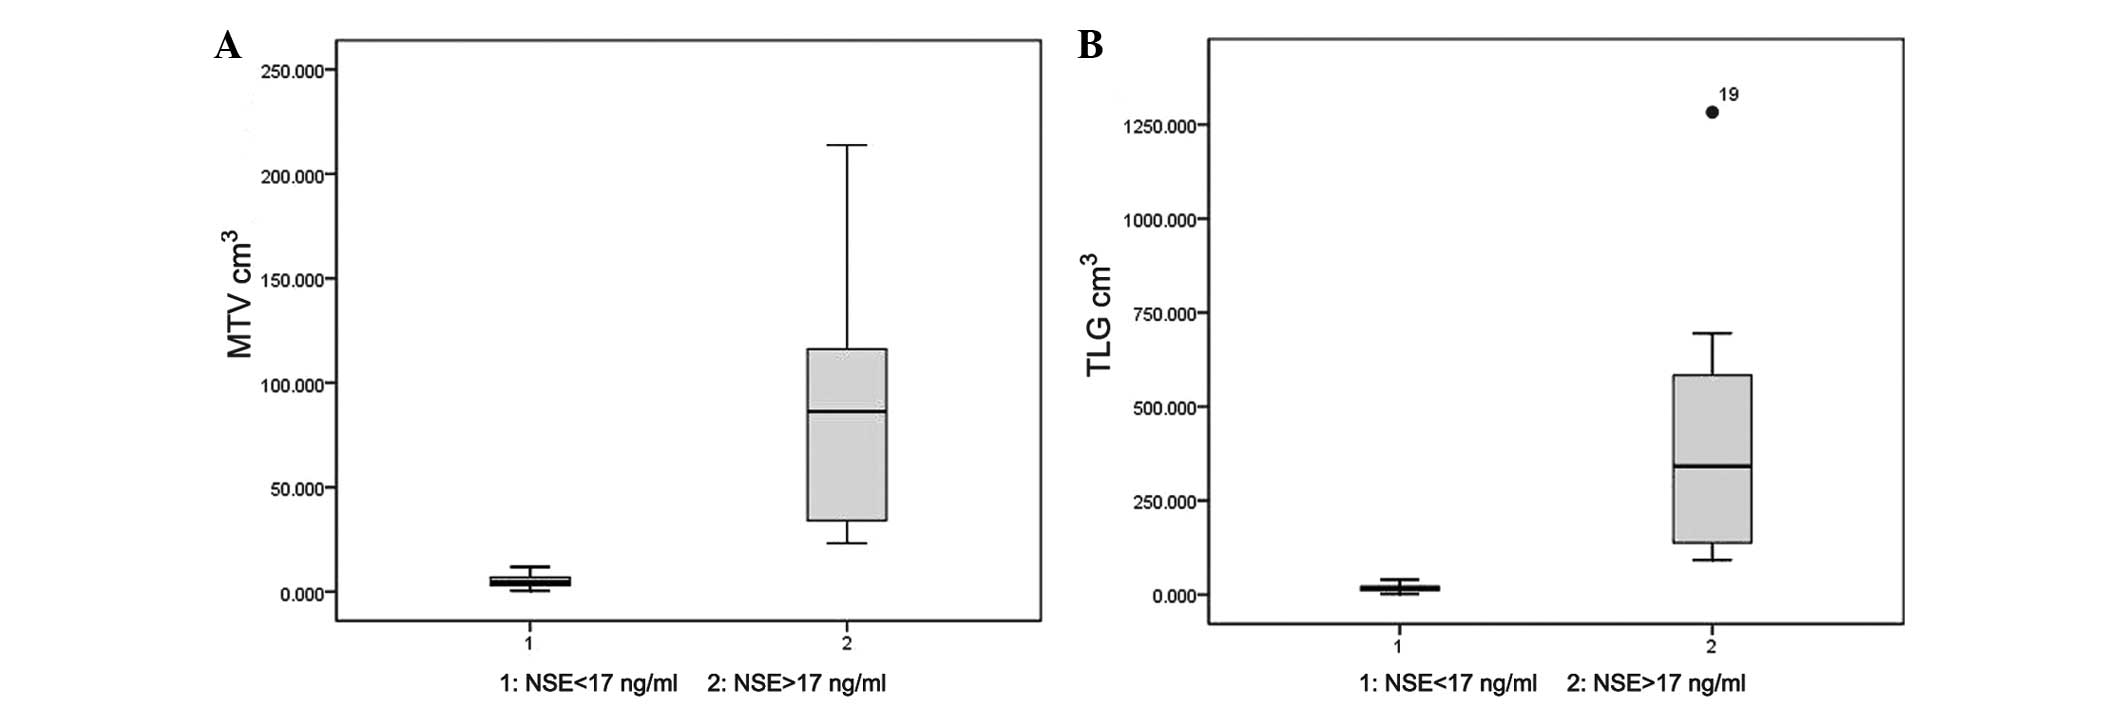
P<0.001; r=0.866, P<0.001, respectively; Fig. 1). The t-test showed that the
MTV and TLG of the patients with abnormal NSE levels were
significantly higher than those of patients with normal NSE levels
(P=0.001 and P=0.002, respectively; Fig.
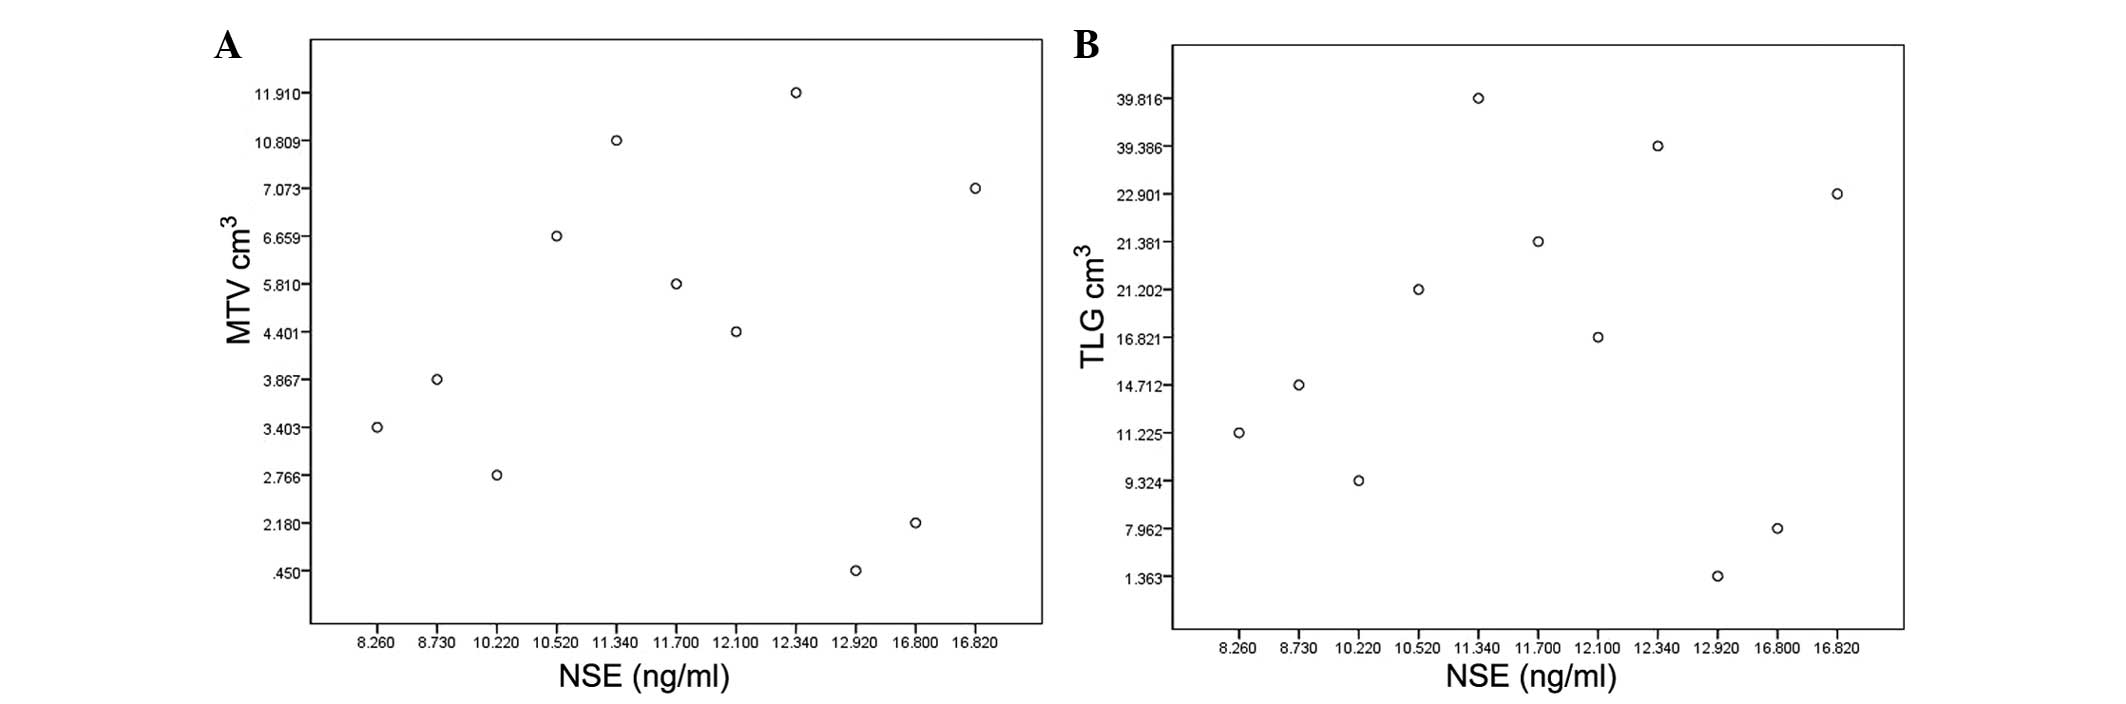
2). In the patients with normal NSE levels, no correlation was
found between NSE and MTV or TLG (r=0.018, P=0.958; r=-0.003,
P=0.92, respectively; Fig. 3), but
the correlation was significant in patients with abnormal NSE
levels (r=0.789, P<0.01; r=0.872, P=0.01, respectively; Fig. 4). In the 17 patients with evaluated
LDH levels, the LDH level was also correlated with MTV and TLG
(r=0.656, P=0.004; r=0.697, P=0.002, respectively). However, no
such correlation was found between CEA level and MTV or TLG
(r=-0.039, P=0.866; r=-0.054, P=0.817, respectively). Similarly, no
correlation was found between CYFRA 21-1 level and MTV or TLG
(r=0.263, P=0.250; r=0.245, P=0.284, respectively).
Discussion
In the present retrospective study, a strong
correlation was found between serum NSE level and MTV or TLG, as
determined by FDG PET in recurrent SCLC patients, while serum CEA
and CYFRA 21-1 levels showed no correlation with MTV or TLG.
Knowledge of the tumor burden is useful in cancer
patients, as total tumor burden is often associated with tumor
response to therapy and has significant effect on the prognosis
(10,11). SCLC is a highly aggressive tumor with
a high relapse rate; therefore, finding a method to accurately
evaluate the tumor burden of recurrent SCLC patients is a high
priority.
CEA, NSE and CYFRA 21-1 are used widely in lung
cancer patients (12). Among these
three tumor markers, NSE is considered to be the most sensitive to
SCLC; this has been confirmed by numerous studies since Carney
et al (13) first proposed NSE
as a tumor marker for SCLC. Serum levels of NSE are elevated in
40–45% of patients with LD and in 85–98% of patients with ED
(14). Bonner et al (15) reported that pretreatment serum NSE
levels may reflect the tumor burden and predict survival, and that
higher NSE level indicate a worse prognosis, suggesting that NSE
level can be used to assess the prognosis of SCLC patients.
Consistent with the aforementioned findings, among the three lung
cancer-related tumor markers studied, the present study also
determined that NSE was the only marker with a correlation with MTV
and TLG, as determined by FDG PET in recurrent SCLC patients.
However, the clinical application of NSE has certain limitations,
as a normal NSE level does not exclude the existence of a tumor.
Therefore, the use of the NSE level as an effective marker for
tumor burden of recurrent SCLC patients is not recognized. A
previous study demonstrated that LDH has prognostic value (16) and may serve as an effective marker in
SCLC. The present study also found that LDH exhibited a correlation
with MTV and TLG in the 17 patients who had LDH data.
Currently, in the clinic, the evaluation of the
tumor burden usually depends on the maximum diameter of the tumor
and the tumor volume, as measured by CT scans. However, CT has
certain shortcomings, such as the inability to distinguish between
tumor and necrotic tissues. Furthermore, small tumors with
diameters similar or smaller than the slice thickness cannot be
visualized on CT imaging. Above all, CT scans usually poorly
represent the tumor burden (17).
These disadvantages can, however, be overcome by the
use of FDG PET. PET imaging has the advantage of being able to
detect and distinguish between slight metabolic changes prior to
structural changes in tissues and organs occurring in vivo.
FDG PET-CT imaging is considered to fuse the functional image of
PET and the anatomical image of CT. Certain studies (18,19) found
that on radiation therapy treatment planning, the sketch of the
tumor volume under PET-CT was changed in >50% of patients
compare with CT-based treatment planning. MTV and TLG are critical
and sensitive indices with regard to tumor metabolism. The
prognostic significance of metabolic parameters measured by FDG
PET-CT, such as MTV, TLG and maximum SUV, has been reported in a
variety of cancers, including lung cancer, esophageal cancer and
lymphoma (20–23). Certainly, in SCLC, metabolic
parameters are also considered to be of prognostic value (24). Furthermore, the retrospective study
conducted by Xie et al found that TLG, which combined MTV
and SUVmean, showed greater prognostic value in nasopharyngeal
carcinoma compared with MTV (25).
The present study showed that TLG exhibited a greater correlation
coefficient than MTV with serum NSE level, which, to a certain
extent, supports the theory that TLG has a greater prognostic value
than MTV.
In the present study, the serum NSE level exhibited
no correlation with MTV or TLG in the patients with normal NSE
levels, while the correlation was significant in the patients with
abnormal NSE levels. It is known that patients with normal NSE
levels usually have relatively small tumors. In such tumor tissue,
the peripheral inflammatory cells and granulation tissue,
particularly activated macrophages and young granulation tissue,
exhibit significant FDG uptake (26).
Therefore, inflammatory cells and granulation tissue may have
greater influence on MTV and TLG in patients with small tumors
compared with large tumors. This may explain why serum NSE levels
showed no correlation with MTV or TLG in the patients with a normal
NSE level.
However, the present study also had certain
limitations, such as the retrospective nature of the study design,
the artificially sketched tumor margin, leading to inevitable
deviation of the MTV and TLG calculations, and the relatively small
number of patients in the cohort. Despite these shortcomings, the
present study has value, as it provides an effective method to
accurately evaluate the tumor burden in patients with recurrent
SCLC.
In conclusion, the present study found a significant
correlation between NSE and MTV or TLG. MTV and TLG, as determined
by FDG PET, can be used effectively to assess the tumor burden in
patients with recurrent SCLC, with TLG being more sensitive than
MTV. When diagnosed as recurrent SCLC, a higher NSE level suggested
a heavier tumor burden in patients with an abnormal NSE level.
Controlled prospective studies in a larger patient cohort is
required to validate these findings. The study could provide the
theoretical foundation for the further application of tumor markers
and FDG PET in patients with recurrent SCLC.
Acknowledgements
The authors would like to thank Dr Zhu Wanqi and Dr
Ma Li for providing assistance with this study. The study was
presented in part as a poster presentation at the 55th Annual
Meeting of the American Society for Radiation Oncology, Oct 22-25,
2013, Atlanta, GA, USA.
References
|
1
|
Parkin DM, Bray F, Ferlay J and Pisani P:
Global cancer statistics, 2002. CA Cancer J Clin. 55:74–108. 2005.
View Article : Google Scholar : PubMed/NCBI
|
|
2
|
van Meerbeeck JP, Fennell DA and De
Ruysscher DK: Small-cell lung cancer. Lancet. 378:1741–1755. 2011.
View Article : Google Scholar : PubMed/NCBI
|
|
3
|
Johnson BE and Jänne PA: Basic treatment
considerations using chemotherapy for patients with small cell lung
cancer. Hematol Oncol Clin North Am. 18:309–322. 2004. View Article : Google Scholar : PubMed/NCBI
|
|
4
|
Simon M, Argiris A and Murren JR: Progress
in the therapy of small cell lung cancer. Crit Rev Oncol Hematol.
49:119–133. 2004. View Article : Google Scholar : PubMed/NCBI
|
|
5
|
Ono A, Naito T, Ito I, Watanabe R, Shukuya
T, Kenmotsu H, Tsuya A, Nakamura Y, Murakami H, Kaira K, et al:
Correlations between serial pro-gastrin-releasing peptide and
neuron-specific enolase levels and the radiological response to
treatment and survival of patients with small-cell lung cancer.
Lung cancer. 76:439–444. 2012. View Article : Google Scholar : PubMed/NCBI
|
|
6
|
Fischer BM, Mortensen J, Langer SW, Loft
A, Berthelsen AK, Petersen BI, Daugaard G, Lassen U and Hansen HH:
A prospective study of PET/CT in initial staging of small-cell lung
cancer: Comparison with CT, bone scintigraphy and bone marrow
analysis. Ann Oncol. 18:338–345. 2007. View Article : Google Scholar : PubMed/NCBI
|
|
7
|
Choi MY, Lee KM, Chung JK, Lee DS, Jeong
JM, Park JG, Kim JH and Lee MC: Correlation between serum CEA level
and metabolic volume as determined by FDG PET in postoperative
patients with recurrent colorectal cancer. Ann Nucl Med.
19:123–129. 2005. View Article : Google Scholar : PubMed/NCBI
|
|
8
|
Simon GR and Wagner H: American College of
Chest Physicians: Small cell lung cancer. Chest. 123(Suppl 1):
259S–271S. 2003. View Article : Google Scholar : PubMed/NCBI
|
|
9
|
World Medical Association: World Medical
Association Declaration of Helsinki: Ethical principles for medical
research involving human subjects. JAMA. 310:2191–2194. 2013.
View Article : Google Scholar : PubMed/NCBI
|
|
10
|
Johnson CR, Khandelwal SR, Schmidt-Ullrich
RK, Ravalese J III and Wazer DE: The influence of quantitative
tumor volume measurements on local control in advanced head and
neck cancer using concomitant boost accelerated superfractionated
irradiation. Int J Radiat Oncol Biol Phys. 32:635–641. 1995.
View Article : Google Scholar : PubMed/NCBI
|
|
11
|
Bradley JD, Ieumwananonthachai N, Purdy
JA, Wasserman TH, Lockett MA, Graham MV and Perez CA: Gross tumor
volume, critical prognostic factor in patients treated with
three-dimensional conformal radiation therapy for non-small-cell
lung carcinoma. Int J Radiat Oncol Biol Phys. 52:49–57. 2002.
View Article : Google Scholar : PubMed/NCBI
|
|
12
|
Harmsma M, Schutte B and Ramaekers FC:
Serum markers in small cell lung cancer: Opportunities for
improvement. Biochim Biophys Acta. 1836:255–272. 2013.PubMed/NCBI
|
|
13
|
Carney DN, Marangos PJ, Ihde DC, Bunn PA
Jr, Cohen MH, Minna JD and Gazdar AF: Serum neuron-specific
enolase: A marker for disease extent and response to therapy of
small-cell lung cancer. Lancet. 1:583–585. 1982. View Article : Google Scholar : PubMed/NCBI
|
|
14
|
Jorgensen LG: Neuron specific enolase in
small cell lung cancer. Clinical and biochemical evaluation. Dan
Med Bull. 46:1–12. 1999.PubMed/NCBI
|
|
15
|
Bonner JA, Sloan JA, Rowland KM Jr, Klee
GG, Kugler JW, Mailliard JA, Wiesenfeld M, Krook JE, Maksymiuk AW,
Shaw EG, et al: Significance of neuron-specific enolase levels
before and during therapy for small cell lung cancer. Clin Cancer
Res. 6:597–601. 2000.PubMed/NCBI
|
|
16
|
Yip D and Harper PG: Predictive and
prognostic factors in small cell lung cancer: Current status. Lung
cancer. 28:173–185. 2000. View Article : Google Scholar : PubMed/NCBI
|
|
17
|
Jennings SGI, Winer-Muram HT, Tarver RD
and Farber MO: Lung tumor growth: Assessment with CT - comparison
of diameter and cross-sectional area with volume measurements.
Radiology. 231:866–871. 2004. View Article : Google Scholar : PubMed/NCBI
|
|
18
|
Ciernik IF, Dizendorf E, Baumert BG,
Reiner B, Burger C, Davis JB, Lütolf UM, Steinert HC and Von
Schulthess GK: Radiation treatment planning with an integrated
positron emission and computer tomography (PET/CT): A feasibility
study. Int J Radiat Oncol Biol Phys. 57:853–863. 2003. View Article : Google Scholar : PubMed/NCBI
|
|
19
|
Bradley J, Thorstad WL, Mutic S, Miller
TR, Dehdashti F, Siegel BA, Bosch W and Bertrand RJ: Impact of
FDG-PET on radiation therapy volume delineation in non-small-cell
lung cancer. Int J Radiat Oncol Biol Phys. 59:78–86. 2004.
View Article : Google Scholar : PubMed/NCBI
|
|
20
|
Liao S, Penney BC, Wroblewski K, Zhang H,
Simon CA, Kampalath R, Shih MC, Shimada N, Chen S, Salgia R, et al:
Prognostic value of metabolic tumor burden on 18F-FDG PET in
nonsurgical patients with non-small cell lung cancer. Eur J Nucl
Med Mol Imaging. 39:27–38. 2012. View Article : Google Scholar : PubMed/NCBI
|
|
21
|
Vu CC, Matthews R, Kim B, Franceschi D,
Bilfinger TV and Moore WH: Prognostic value of metabolic tumor
volume and total lesion glycolysis from 18F-FDG PET/CT in patients
undergoing stereotactic body radiation therapy for stage I
non-small-cell lung cancer. Nucl Med Commun. 34:959–963. 2013.
View Article : Google Scholar : PubMed/NCBI
|
|
22
|
Roedl JB, Halpern EF, Colen RR, Sahani DV,
Fischman AJ and Blake MA: Metabolic tumor width parameters as
determined on PET/CT predict disease-free survival and treatment
response in squamous cell carcinoma of the esophagus. Mol Imaging
Biol. 11:54–60. 2009. View Article : Google Scholar : PubMed/NCBI
|
|
23
|
Oh MY, Chung JS, Song MK, Shin HJ, Lee HS,
Lee SM, Lee GW and Lee SE: Prognostic value of Waldeyer's ring
involvement of diffuse large B-cell lymphoma treated with R-CHOP.
Int J Hematol. 97:397–402. 2013. View Article : Google Scholar : PubMed/NCBI
|
|
24
|
Zhu D, Ma T, Niu Z, Zheng J, Han A, Zhao S
and Yu J: Prognostic significance of metabolic parameters measured
by (18)F-fluorodeoxyglucose positron emission tomography/computed
tomography in patients with small cell lung cancer. Lung cancer.
73:332–337. 2011. View Article : Google Scholar : PubMed/NCBI
|
|
25
|
Xie P, Yue JB, Zhao HX, Sun XD, Kong L, Fu
Z and Yu JM: Prognostic value of 18F-FDG PET-CT metabolic index for
nasopharyngeal carcinoma. J Cancer Res Clin Oncol. 136:883–889.
2010. View Article : Google Scholar : PubMed/NCBI
|
|
26
|
Kubota R, Yamada S, Kubota K, Ishiwata K,
Tamahashi N and Ido T: Intratumoral distribution of
fluorine-18-fluorodeoxyglucose in vivo: High accumulation in
macrophages and granulation tissues studied by
microautoradiography. J Nucl Med. 33:1972–1980. 1992.PubMed/NCBI
|