Introduction
Esophageal carcinoma is a common disease, and
>80% of cases occur in developing countries. In 2008, esophageal
cancer was the eighth most common cancer worldwide and China was
ranked with the fourth highest morbidity rate for esophageal cancer
worldwide with a five-year survival rate of <40% (1). The early symptoms of the disease, which
include difficulty swallowing and esophageal foreign body
sensation, are not obvious, and thus the majority of patients are
diagnosed at an advanced stage (2).
At present, the most common diagnostic techniques involve the
examination of esophageal function, and include imaging analysis
and esophagoscopy (3). The current
treatment methods for esophageal carcinoma include surgery,
radiation therapy, chemotherapy, endoscopic therapy and combined
therapy. Patients with early-stage disease are usually treated with
surgery, while patients with advanced esophageal carcinoma or
unresectable tumors are administered synchronous radiotherapy and
chemotherapy, which may increase the survival rate of patients
(4).
The quantity of new vessels in a tumor and the
permeability of the vessel walls can reflect the activity of the
tumor tissues. Concurrent chemoradiotherapy can inhibit the
expression of vascular endothelial growth factor (VEGF)
effectively, thus preventing the regeneration of new vessels in a
tumor (5–7). Quantitative dynamic contrast-enhanced
magnetic resonance imaging (DCE-MRI) takes advantage of dynamic
enhancement and pharmacokinetic theory, and measures the
Ktrans (volume transfer constant; the rate at which
contrast agent distributes from the plasma to the EES),
Kep (rate contrast; the rate at which the contrast agent
that has diffused to the EES returns to the plasma) and
Ve (the contrast agent percentage in the space of the
extracellular fluid) values in the region of interest (ROI) to
monitor the condition in which the contrast agent penetrates the
vessel wall and the distribution of the contrast agent in the
extravascular extracellular space (EES) (8,9). The
present study describes a novel approach for assessing functional
parameters; a DCE-MRI double ventricle model technique was used to
analyze the variation of quantitative parameters in patients with
stage II–III esophageal carcinoma prior to chemoradiotherapy and at
3 weeks post-treatment, in order to investigate whether
quantitative DCE-MRI can predict an early response in primary
esophageal carcinoma patients undergoing concurrent
chemoradiotherapy.
Subjects and methods
Subjects
A total of 32 patients with stage II–III esophageal
cancer who had undergone concurrent chemoradiotherapy at Henan
Provincial People's Hospital (Zhengzhou, China)between April 2013
and April 2014 were included in this study. The inclusion criteria
were: i) Patients were pathologically confirmed with stage II–III
esophageal squamous carcinoma by esophagoscopy; ii) patients
underwent DCE-MRI using the same equipment prior to
chemoradiotherapy and at 3 weeks post-treatment; and iii) patients
underwent esophageal carcinoma clinical and imaging response
evaluation 1 month after finishing all the treatment courses. An
ROI could not be set in 2 cases due to the large range of necrosis
inside the tumor. The artifacts of another 2 cases were serious
when moving. A further 3 cases failed the imaging test. Finally, 25
cases were selected, including 16 men and 9 women. The age varied
from 52 to 80 years, and the mean age was 68 years. This study was
conducted in accordance with the declaration of Helsinki. This
study was conducted with approval from the Ethics Committee of
Henan Provincial People's Hospital. Written informed consent was
obtained from all participants.
Inspection methods
A 3.0T Discovery 750 MR scanner and 8-channel body
special phased array coil designed by General Electric Company (GE
Healthcare, Bethesda, MD, USA) was utilized. Electrocardiograph and
respiratory gating were adopted by patients who could breathe
normally, and single-shot was adopted by patients who could not
breathe normally. Patients were maintained in the supine position,
and underwent shallow and slow abdominal respiration training prior
to treatment. In normal conditions, a transverse view was obtained
by T2-weighted imaging (T2WI) and T1W1, and a sagittal view was
obtained by T2WI scanning. DCE-MRI was performed using the liver
acquisition with volume acceleration sequence, and the scanning
parameters were as follows: Repetition time, 4 msec; echo time, 1.9
msec; depth of stratum, 3.8 mm; interlayer spacing, 1.8 mm; field
of view, 34×34 cm; and matrix, 256×192. Gadodiamide, a
gadolinium-based contrast agent was injected at a dose of 0.5
mmol/kg. An Ulrich Missouri (Ulrich Medical, Ulm, Germany) injector
was used for the injection at a speed of 3.0 ml/sec through the
detained trocar of the elbow vein before, then 25 ml normal saline
was used as a bolus injection to wash this through. Patients were
scanned for 6 periods (6 sec each) prior to injecting the contrast
agent, then scanning was continued for 54 periods. A total of 60
periods and 960 images were collected, as every period included 16
images. MRI scans were performed 1 month after finishing all the
treatment courses. The sequence and parameters were the same prior
to chemoradiotherapy and at 3 weeks post-treatment.
Measurement and calculation of
parameter values
All the original data was transmitted to an ADW 4.5
workstation (GE Healthcare), and the Cintool software (GE
Healthcare) hemodynamics Tofts two compartment model measured and
calculated the parameter values. Two experienced abdominal imaging
doctors set the ROI manually. Specific methods used included
referring to the warm areas in Ktrans, Kep
and Ve, and moving the ROI in DCE-MRI until the maximal
values of Ktrans, Kep and Ve were
obtained. Areas of cystic change, necrosis and hemorrhage, and
areas containing normal vessels were avoided when setting the ROI.
The positions of the two ROIs were at the same phases, layers and
locations prior to chemoradiotherapy and at 3 weeks
post-treatment.
Curative effect evaluation
criteria
The maximal diameters of the tumor were measured
respectively in MRI scanning images prior to chemoradiotherapy and
at 3 weeks post-treatment. According to the Response Evaluation
Criteria In Solid Tumors (10), the
patients was divided into those with tumors exhibiting a complete
response (CR) and those with a partial response (PR).
Statistical analysis
SPSS 19.0 statistical software (SPSS Inc., Chicago,
IL, USA) was used to compare the variation of quantitative
parameters between the CR and PR groups prior to chemoradiotherapy
and at 3 weeks post-treatment. Two independent sample Mann-Whitney
U tests were adopted. P<0.05 indicated that the differences were
statistically significant. The ROC of the Ktrans,
Kep and Ve parameter values prior to
chemoradiotherapy and at 3 weeks post-treatment was drawn to obtain
the area under the curve and the maximal Youden's index, thus
finding out the best parameter for predicting an early response in
primary esophageal carcinoma, and its diagnostic susceptibility and
specificity.
Results
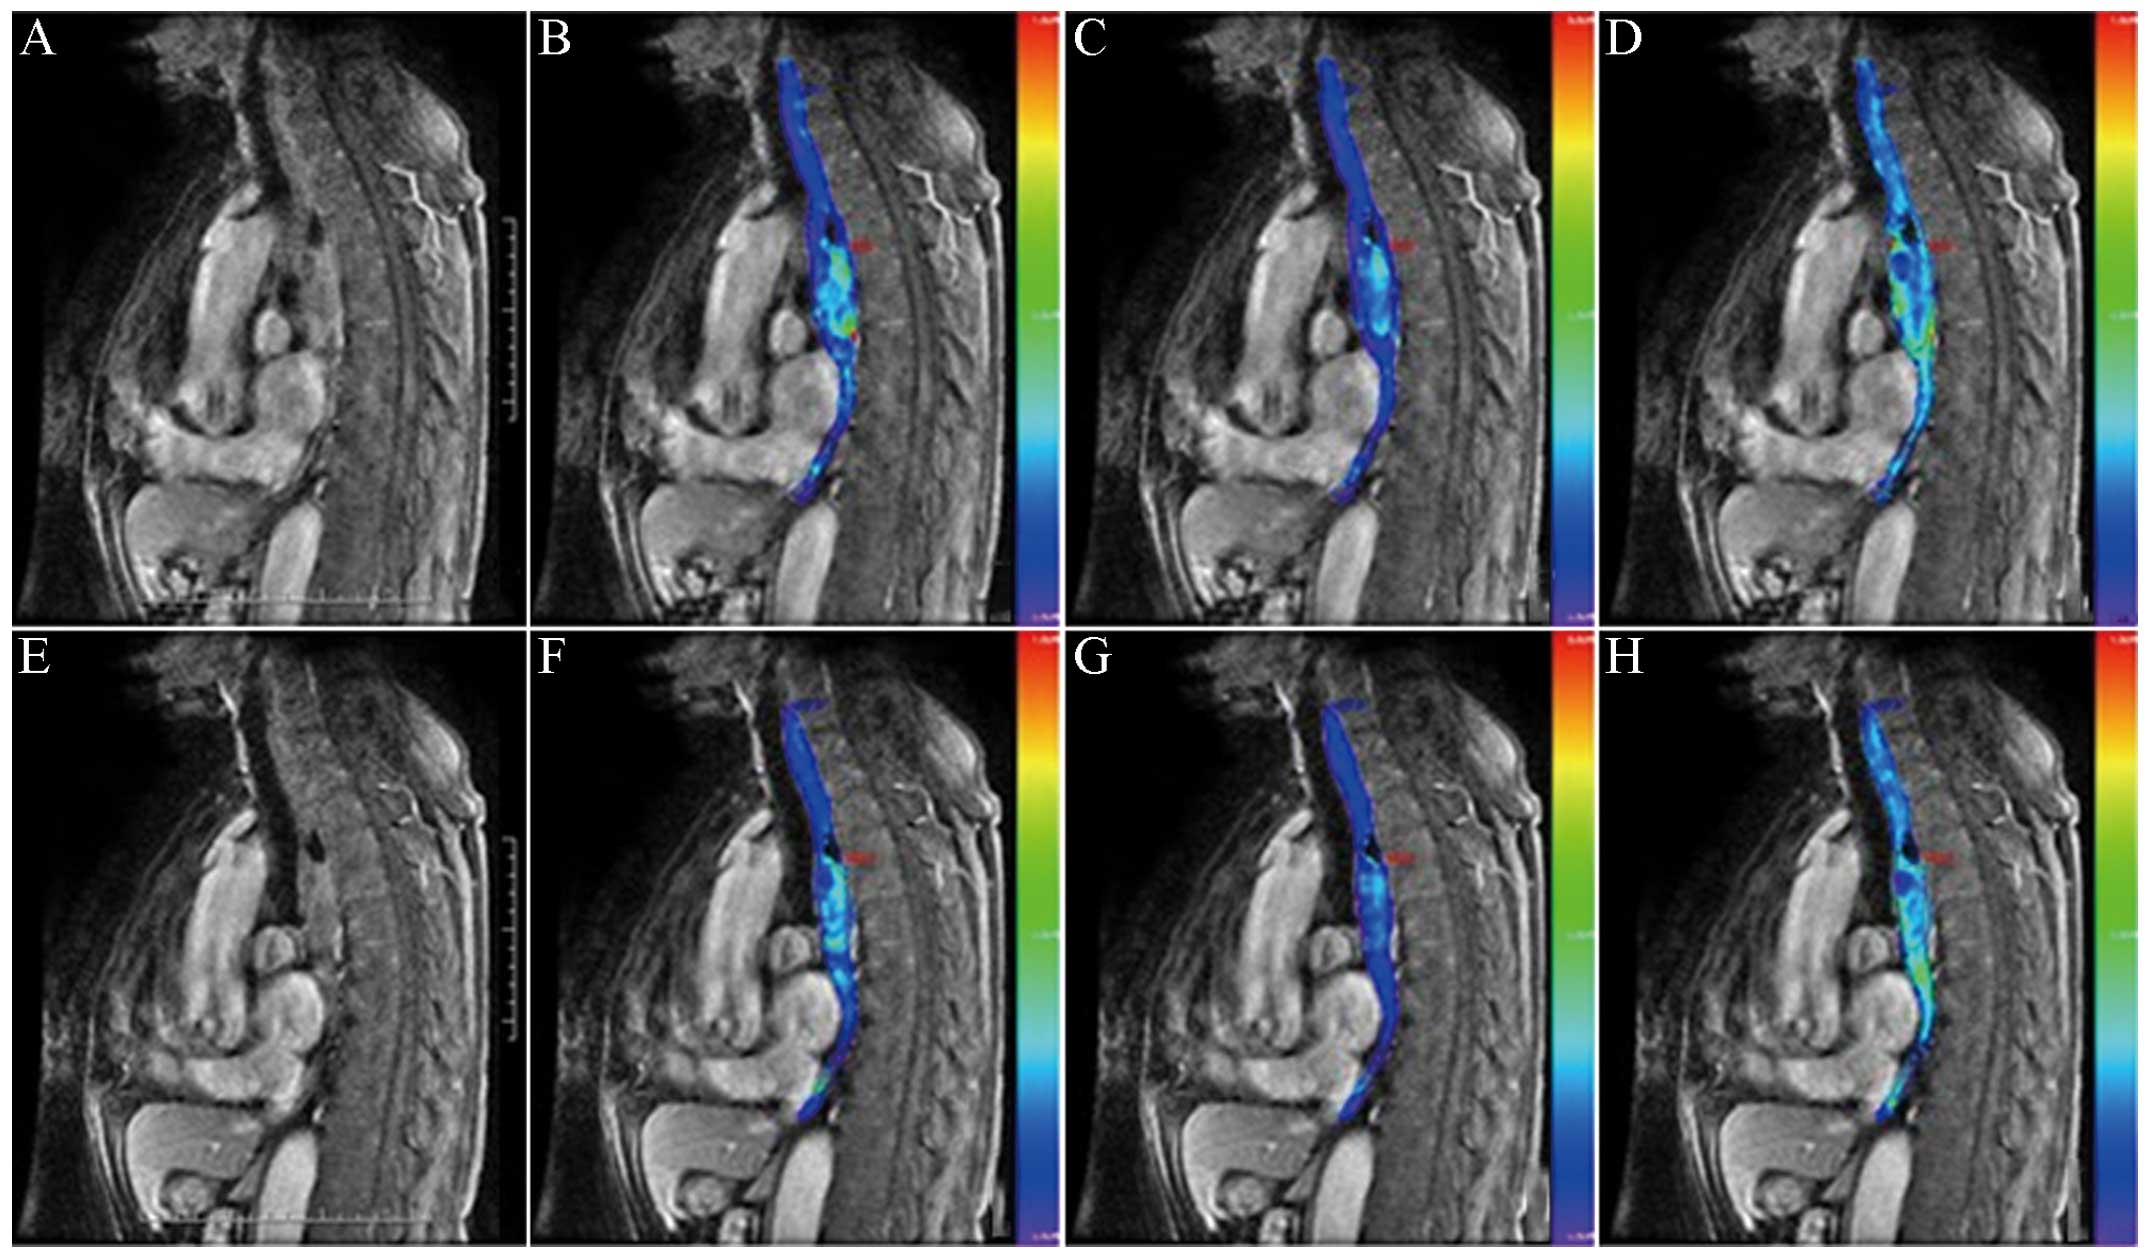
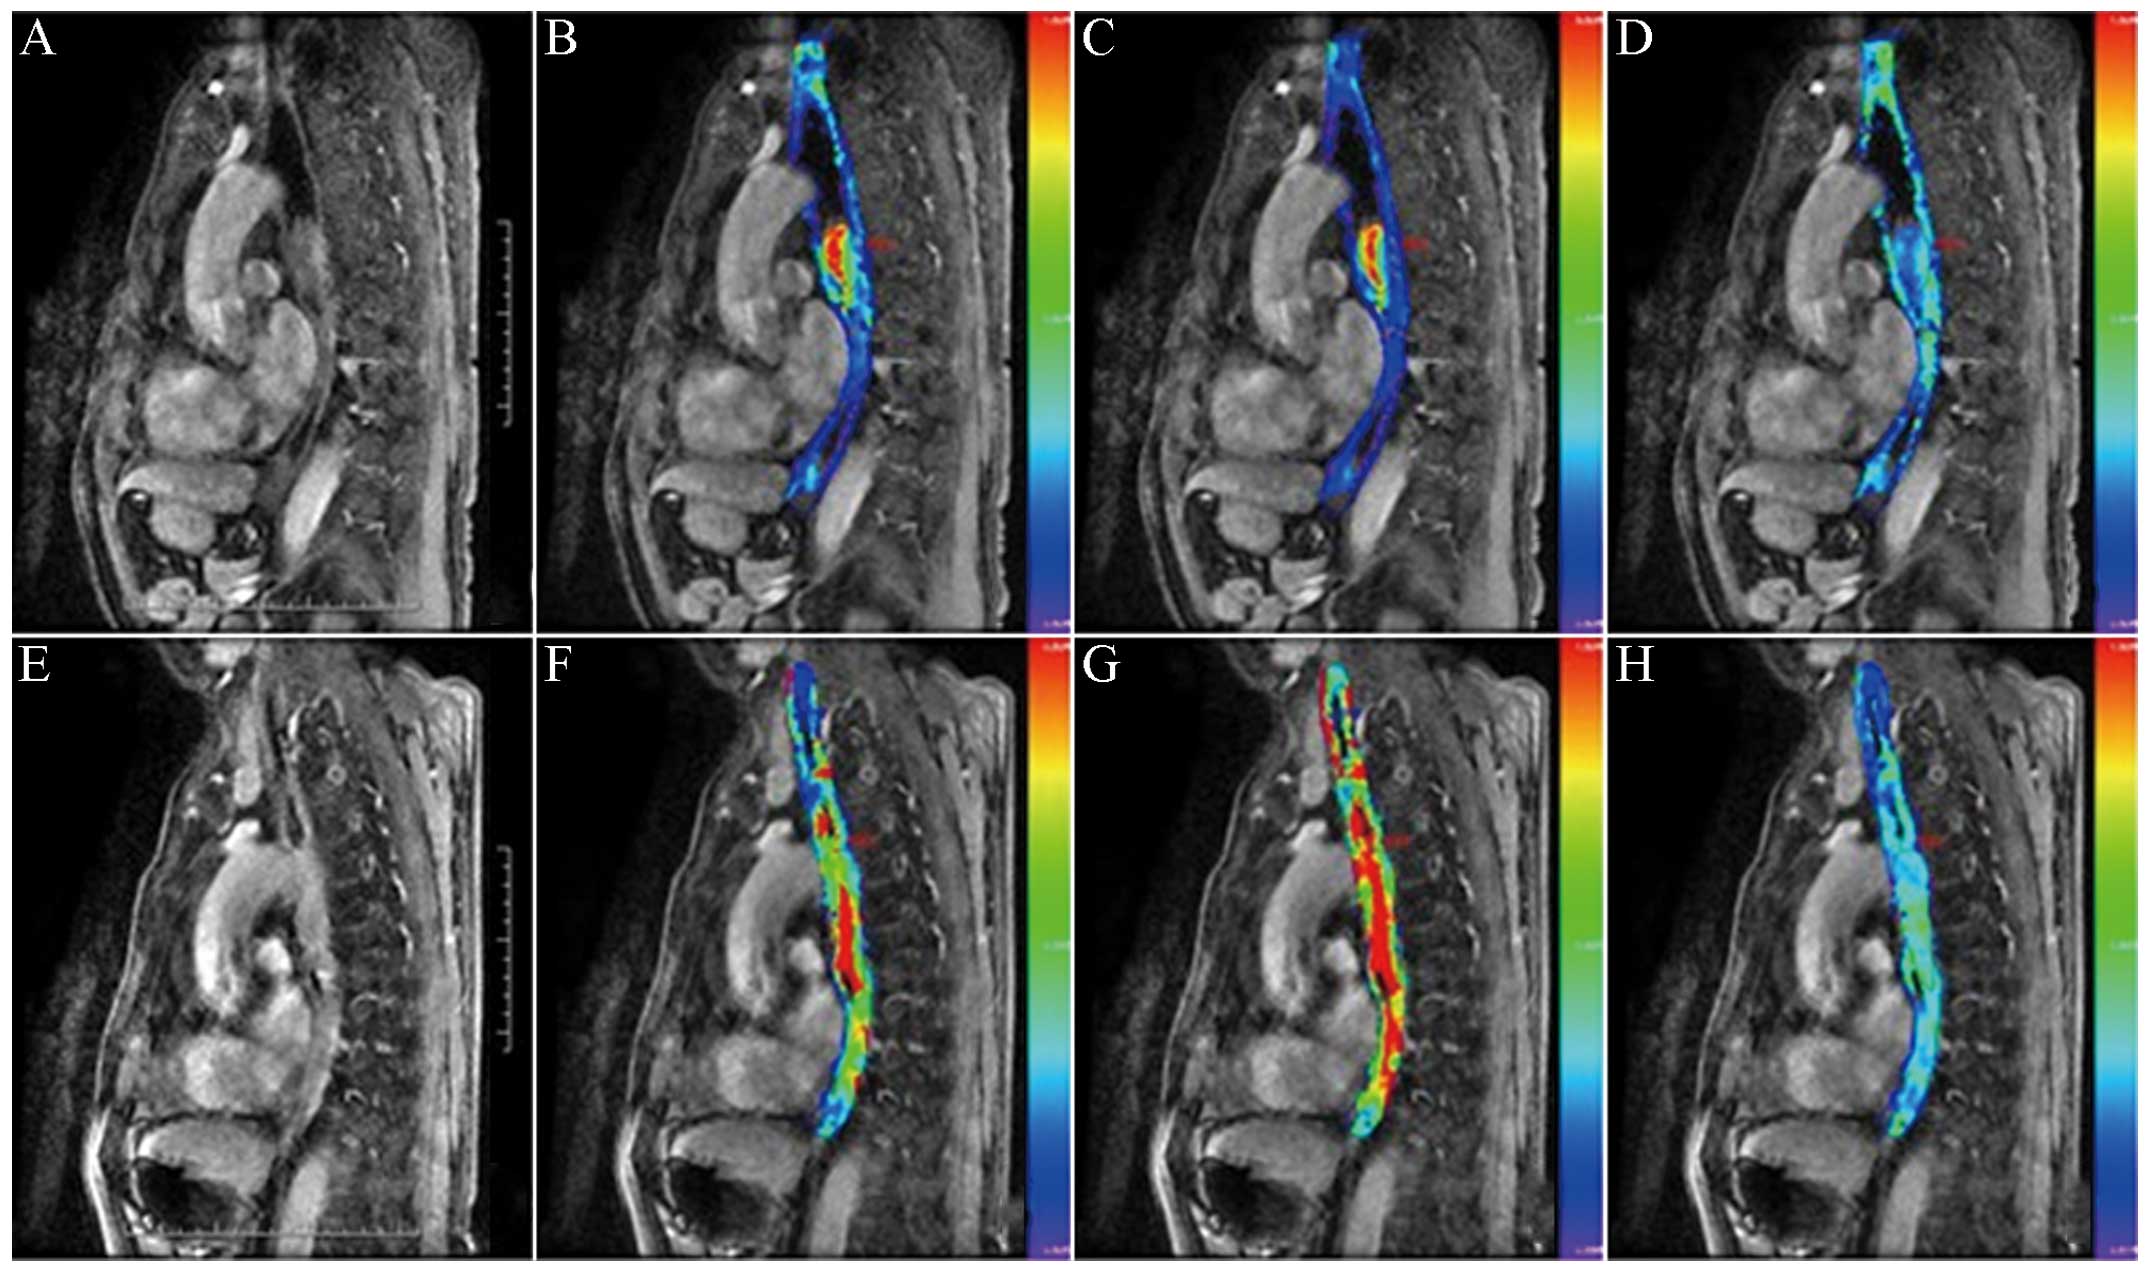
Among the 25 patients with stage II–III esophageal
carcinoma, 17 cases were designated to the CR group (Fig. 1) and 8 cases were designated to the PR
group (Fig. 2). Among the parameters,
for pseudocolor images, if the color was warmer, the parameter
value (Kep) would be higher; otherwise, the parameter
value would be lower.
No statistically significant difference in parameter
values was identified between the 2 groups prior to
chemoradiotherapy (Table I). At 3
weeks post-treatment, the values of Ktrans and
Kep in the CR group decreased, but the values of
Ktrans and Kep in the PR group increased,
there was statistical significance between the two groups for these
two parameters (both P<0.05). The values of Ve in the
CR group increased (P<0.05), and the values of Ve in
the PR group increased marginally; however, there was no
statistical significance between groups (P>0.05) (Table II).
 | Table I.Comparison of parameter values between
the CR and PR groups prior to chemoradiotherapy (mean ± standard
deviation). |
Table I.
Comparison of parameter values between
the CR and PR groups prior to chemoradiotherapy (mean ± standard
deviation).
| Group | Case | Ktrans
(/min) | Kep
(/min) | Ve |
|---|
| CR | 17 | 0.54±0.17 | 1.12±0.46 | 0.37±0.14 |
| PR | 8 | 0.25±0.11 | 1.07±0.37 | 0.40±0.22 |
| U value |
| −2.598 | 1.012 | −0.324 |
| P-value |
|
0.038 | 0.331 |
0.755 |
| Table II.Comparison of parameter values between
the CR and PR groups at 3 weeks post-chemoradiotherapy treatment
(mean ± standard deviation). |
Table II.
Comparison of parameter values between
the CR and PR groups at 3 weeks post-chemoradiotherapy treatment
(mean ± standard deviation).
| Group | Case | Ktrans
(/min) | Kep
(/min) | Ve |
|---|
| CR | 17 | 0.33±0.11 | 0.86±0.31 | 0.66±0.05 |
| PR | 8 | 0.62±0.22 | 1.19±0.39 | 0.45±0.19 |
| U value |
| −3.319 | −1.719 | −2.628 |
| P-value |
|
0.006 |
0.119 |
0.021 |
ROC analysis of the parameter values prior to
chemoradiotherapy and at 3 weeks post-treatment showed that the
Ktrans values prior to chemoradiotherapy and
Ktrans and Ve values at 3 weeks
post-treatment were the better predictive parameters in the CR
group. The areas below the curve were 0.648, 0.741 and 0.796,
respectively. At 3 weeks post-treatment, the susceptibility and
specificity of Kep was 77.8 and 66.7%, respectively,
(the diagnostic range was 0.933) (Table
III).
| Table III.Relevant receiver operating
characteristic parameters of quantitative parameter values
predicting an early response prior to and at 3 weeks
post-chemoradiotherapy. |
Table III.
Relevant receiver operating
characteristic parameters of quantitative parameter values
predicting an early response prior to and at 3 weeks
post-chemoradiotherapy.
| Parameter | Area under the
curve | Maximal Youden's
index | Testing
threshold | Susceptibility,
% | Specificity, % |
|---|
| Prior to
chemoradiotherapy |
|
|
|
|
|
|
Ktrans | 0.648 | 44.5 | 0.388 | 77.8 | 66.7 |
|
Kep | 0.407 | 22.3 | 1.083 | 55.6 | 66.7 |
|
Ve | 0.630 | 33.4 | 0.303 | 66.7 | 66.7 |
| At 3 weeks
post-treatment |
|
|
|
|
|
|
Ktrans | 0.741 | 33.4 | 0.385 | 66.7 | 66.7 |
|
Kep | 0.796 | 44.5 | 0.933 | 77.8 | 66.7 |
|
Ve | 0.481 | 11.1 | 0.692 | 44.4 | 66.7 |
Discussion
According to the statistical report data on global
carcinoma in 2008, China was ranked with the fourth highest
morbidity rate for esophageal carcinoma worldwide (1). Squamous carcinoma is the main
pathological type of esophagus carcinoma in China, and features
high-grade malignancy, rapid development, poor treatment effects
and a high recurrence rate (11).
Consequently, 80% of patients are in the intermediate and advanced
stages when first presenting to a doctor (12). Currently, the best treatment for
esophagus carcinoma of intermediate and advanced stages is
concurrent chemoradiotherapy (13).
Non-invasive imageological examinations are the main method to
evaluate the early response of esophagus carcinoma. Clinically,
barium meals and computed tomography scans are used to observe the
variation in the tumor volume to evaluate the treatment effect.
However, it is difficult to reflect the early response of a tumor
objectively and accurately, as radiotherapy often causes reactive
edema of tissue surrounding the tumor, and the tumor size does not
vary markedly or appears as pseudoedema (14). At the molecular level, DCE-MRI takes
advantage of dynamics enhancement images and the pharmacokinetics
model. It also takes consideration of the fact that the
concentration of contrast agent varies as time progresses, and
acknowledges the exchange process of contrast agent inside and
outside the vessels, thus describing certain hemodynamics
information quantitatively, such as the generation and permeability
of carcinoma capillaries (15). This
technology has been applied to the grading and effect evaluation of
certain malignant tumors, including glioma, breast carcinoma and
prostate carcinoma (16–18). By analyzing variations in surrounding
parameter values of a DCE-MRI pharmacokinetics model in patients
with esophageal squamous carcinoma prior to and following
chemoradiotherapy, the present study aimed to investigate the
assessment and predictive abilities of an early response in primary
esophageal carcinoma patients undergoing concurrent
chemoradiotherapy.
DCE-MRI quantitative parameters consisted of: i)
Ktrans ii) Kep; and iii) Ve. The
three quantitative parameters are linked in the following equation:
Kep= Ktrans / Ve. According to
Tofts pharmacokinetics two compartment model, plasma was selected
as the central compartment and EES as the rim compartment, thus
deducing the following equation: Ct = Ktrans(Cp(t) × e-
Kep × t) (8). In the
equation, Ct(t) was the rate of time of contrast agent
concentration inside the tissue. Cp(t) was the rate of time of
contrast agent concentration in the vessels near to the carcinoma.
C(t) and Cp(t) were obtained respectively from the variation in T1
signal in the tissues and vessels, and then the Ktrans,
Kep and Ve values were obtained through the
curve fitting calculation of numerous parameters (9). This technology features the advantages
of security, economy and the ability for repetitive use. It can be
used to diagnose carcinoma qualitatively, to grade malignancy, to
evaluate the effects of carcinoma and to develop antineoplastic
drugs (19).
The cellular metabolic cycle is three weeks, and at
that time, an early response to chemoradiotherapy should have
theoretically appeared. However, the side-effects of
chemoradiotherapy may lead to edema. It is difficult to reflect the
response of treatment objectively, if only depending on observing
the carcinoma morphology. The results of the present study showed
that there was a statistical difference between the CR and PR
groups for the pharmacokinetics parameter values of
Ktrans and Ve when undergoing
chemoradiotherapy for three weeks. Therefore, DCE-MRI could detect
the variation in esophageal carcinoma at the microcirculation
level. These results were in agreement with those found by Chang
et al (20). This study
suggested that DCE-MRI quantitative imaging could distinguish
between normal esophageal carcinoma and malignant carcinoma, and
the Ktrans values of the mass declined markedly prior to
and following chemoradiotherapy. According to the study,
chemoradiotherapy could inhibit the expression of VEGF in the tumor
vessels, thus preventing the generation of new tumor vessels.
However, in the present study, it was found that chemoradiotherapy
could also inhibit the generation of tumor cells, leading to the
increase in the extracellular space and an increase in the
volumetric proportion of the EES. This was represented by the
increasing Ve values in the study results. Carcinoma
Kep values decreased after three weeks of
chemoradiotherapy, but the variation was not marked. This had a
certain association with the choice of ROI, as the heterogeneity
inside the tumor affected the measurement of the results to a
certain extent. The data showed that the patients who had higher
Ktrans values prior to chemoradiotherapy exhibited a
better treatment response compared with those who had lower
Ktrans values prior to chemoradiotherapy. This agreed
with the previous study results on the chemoradiotherapy response
associated with breast, rectal, pancreatic, hepatocellular and
renal carcinoma (21–24). After undergoing chemoradiotherapy, the
Ktrans, Kep and Ve values of the 8
cases in the PR group increased slightly in the present study.
Therefore, chemoradiotherapy did not change the local blood
perfusion of the tumor tissues and the vascular permeability.
Consequently, for patients who are not sensitive to
chemoradiotherapy, the treatment plan should be adjusted as soon as
possible to obtain an effective treatment time. Through comparing
the abilities of different parameter values for predicting the
early response of esophageal carcinoma patients undergoing
chemoradiotherapy, the best parameters after three weeks of
treatment were the Ktrans and Kep values.
The present study had certain disadvantages: i) The
quantity of the sample was small, which may lead to a certain
degree of bias in the results; ii) for the patients who did not
have a clear esophageal lump, the choice of ROI was not exact; iii)
in order to balance space resolution, time resolution was set at 6
sec, however, it was able meet the requirement of processing
software after Cintool; and iv) there were numerous scan sequences
of DCE-MRI, and the scanning parameters were also not consistent.
Therefore, the degree of variation in imaging was larger, and this
also affected the measurement of the parameter values.
In conclusion, quantitative DCE-MRI allows the
perfusion of tumor tissue to be monitored in a non-invasive manner
and thus, it may be applied to monitor tissues following
radiotherapy treatment for esophageal carcinoma. Furthermore, the
quantitative parameters, Ktrans and Kep, may
be used to monitor the early clinical effects of esophageal
carcinoma, which may lead to more objective and timely assessment
of treatment. However, the Ve parameter exhibited no
clear advantages in assessing treatment efficacy, and thus requires
further study.
Acknowledgements
The authors would like to thank GE Healthcare Life
Sciences (Beijing, China) for their technical assistance.
References
|
1
|
Ferlay J, Shin HR, Bray F, Forman D,
Mathers C and Parkin DM: Estimates of worldwide burden of cancer in
2008: GLOBOCAN 2008. Int J Cancer. 127:2893–2917. 2010. View Article : Google Scholar : PubMed/NCBI
|
|
2
|
Domper Arnal MJ, Ferrández Arenas Á and
Lanas Arbeloa Á: Esophageal cancer: Risk factors, screening and
endoscopic treatment in Western and Eastern countries. World J
Gastroenterol. 21:7933–7943. 2015.PubMed/NCBI
|
|
3
|
He J and Shao K: The epidemiology, current
status of management, challenge and future strategy for esophageal
cancer in China. Zhong Guo Ai Zheng Za Zhi. 21:501–504. 2011.(In
Chinese).
|
|
4
|
Haefner MF, Lang K, Krug D, Koerber SA,
Uhlmann L, Kieser M, Debus J and Sterzing F: Prognostic factors,
patterns of recurrence and toxicity for patients with esophageal
cancer undergoing definitive radiotherapy or chemo-radiotherapy. J
Radiat Res. 56:742–749. 2015. View Article : Google Scholar : PubMed/NCBI
|
|
5
|
Wong RK and Malthaner R: Withdrawn.
Combined chemotherapy and radiotherapy (without surgery) compared
with radiotherapy alone in localized carcinoma of the esophagus.
Cochrane Database Syst Rev. 1:CD0020922010.PubMed/NCBI
|
|
6
|
Lu WB, Yu JP, Ni XC, Wang J, Jin JH, Deng
LH, Deng JZ, Sun ZQ and Sun SP: Relation between tumor pathologic
response to concurrent chemo-radiotherapy and changes of serum VEGF
level and its influence on the efficacy and prognosis in patients
with esophageal carcinoma. Zhong Hua Fang She Yi Xue Yu Fang Hu Za
Zhi. 33:299–302. 2013.(In Chinese).
|
|
7
|
Beierle EA, Strande LF and Chen MK: VEGF
upregulates Bcl-2 expression and is associated with decreased
apoptosis in neuroblastoma cells. J Pediatr Surg. 37:467–471. 2002.
View Article : Google Scholar : PubMed/NCBI
|
|
8
|
Tofts PS, Brix G, Buckley DL, Evelhoch JL,
Henderson E, Knopp MV, Larsson HB, Lee TY, Mayr NA, Parker GJ, et
al: Estimating kinetic parameters from dynamic contrast-enhanced
T(1)-weighted MRI of a diffusable tracer: Standardized quantities
and symbols. J Magn Reson Imaging. 10:223–232. 1999. View Article : Google Scholar : PubMed/NCBI
|
|
9
|
Oberholzer K, Pohlmann A, Schreiber W,
Mildenberger P, Kunz P, Schmidberger H, Junginger T and Düber C:
Assessment of tumor microcirculation with dynamic contrast-enhanced
MRI in patients with esophageal cancer: Initial experience. J Magn
Reson Imaging. 27:1296–1301. 2008. View Article : Google Scholar : PubMed/NCBI
|
|
10
|
Eisenhauer EA, Therasse P, Bogaerts J,
Schwartz LH, Sargent D, Ford R, Dancey J, Arbuck S, Gwyther S,
Mooney M, et al: New response evaluation criteria in solid tumours:
Revised RECIST guideline (version 1.1). Eur J Cancer. 45:228–247.
2009. View Article : Google Scholar : PubMed/NCBI
|
|
11
|
Cortés González R and Villaseñor Caloca R:
Esophageal cancer. Rev Gastroenterol Mex. 62:149–159. 1997.(In
Spanish). PubMed/NCBI
|
|
12
|
Greer SE, Goodney PP, Sutton JE and
Birkmeyer JD: Neoadjuvant chemoradiotherapy for esophageal
carcinoma: A meta-analysis. Surgery. 137:172–177. 2005. View Article : Google Scholar : PubMed/NCBI
|
|
13
|
Al-Sarraf M, Martz K, Herskovic A,
Leichman L, Brindle JS, Vaitkevicius VK, Cooper J, Byhardt R, Davis
L and Emami B: Progress report of combined chemoradiotherapy versus
radiotherapy alone in patients with esophageal cancer: An
intergroup study. J Clin Oncol. 15:277–284. 1997.PubMed/NCBI
|
|
14
|
Yoon DH, Jang G, Kim JH, Kim YH, Kim JY,
Kim HR, Jung HY, Lee GH, Song HY, Cho KJ, et al: Randomized phase 2
trial of S1 and oxaliplatin-based chemoradiotherapy with or without
induction chemotherapy for esophageal cancer. Int J Radiat Oncol
Biol Phys. 91:489–496. 2015. View Article : Google Scholar : PubMed/NCBI
|
|
15
|
Shin SU, Lee JM, Yu MH, Yoon JH, Han JK,
Choi BI, Glaser KJ and Ehman RL: Prediction of esophageal varices
in patients with cirrhosis: Usefulness of three-dimensional MR
elastography with echo-planar imaging technique. Radiology.
272:143–153. 2014. View Article : Google Scholar : PubMed/NCBI
|
|
16
|
Jia ZZ, Zhang J, Tang WJ, Wu XH, Gu HM,
Geng DY and Chen XR: Assessing the microvascular permeability of
brain glioma by DCE-MRI. Zhong Guo Yi Xue Ji Suan Ji Cheng Xiang Za
Zhi. 19:293–297. 2013.(In Chinese).
|
|
17
|
Esposito A, Palmisano A, Maffi P, Malosio
ML, Nano R, Canu T, De Cobelli F, Piemonti L, Ironi G, Secchi A and
Del Maschio A: Liver perfusion changes occurring during pancreatic
islet engraftment: A dynamic contrast-enhanced magnetic resonance
study. Am J Transplant. 14:202–209. 2014. View Article : Google Scholar : PubMed/NCBI
|
|
18
|
He W, Liu Y, Liu JY and Lu M: Prostate
cancer: Diagnostic value of quantitative analysis by dynamic
contrast-enhanced MR at 3.0 T. Zhong Hua Fang She Xue Za Zhi.
48:215–218. 2014.(In Chinese).
|
|
19
|
Zhao LY, Zhang RZ, Zhou CW, Li J and Wang
L: Quantitative dynamic contrast enhanced MR in the prediction of
response in breast cancer patients undergoing neoadjuvant
chemotherapy. Zhong Hua Fang She Xue Za Zhi. 47:704–708. 2013.(In
Chinese).
|
|
20
|
Chang EY, Li X, Jerosch-Herold M, Priest
RA, Enestvedt CK, Xu J, Springer CS Jr and Jobe BA: The evaluation
of esophageal adenocarcinoma using dynamic contrast-enhanced
magnetic resonance imaging. J Gastrointest Surg. 12:166–175. 2008.
View Article : Google Scholar : PubMed/NCBI
|
|
21
|
Padhani AR, Hayes C, Assersohn L, Powles
T, Makris A, Suckling J, Leach MO and Husband JE: Prediction of
clinicopathologic response of breast cancer to primary chemotherapy
at contrast-enhanced MR imaging: Initial clinical results.
Radiology. 239:361–374. 2006. View Article : Google Scholar : PubMed/NCBI
|
|
22
|
George ML, Dzik-Jurasz AS, Padhani AR,
Brown G, Tait DM, Eccles SA and Swift RI: Non-invasive methods of
assessing angiogenesis and their value in predicting response to
treatment in colorectal cancer. Br J Surg. 88:1628–1636. 2001.
View Article : Google Scholar : PubMed/NCBI
|
|
23
|
Akisik MF, Sandrasegaran K, Bu G, Lin C,
Hutchins GD and Chiorean EG: Pancreatic cancer: Utility of dynamic
contrast-enhanced MR imaging in assessment of antiangiogenic
therapy. Radiology. 256:441–449. 2010. View Article : Google Scholar : PubMed/NCBI
|
|
24
|
Hahn OM, Yang C, Medved M, Karczmar G,
Kistner E, Karrison T, Manchen E, Mitchell M, Ratain MJ and Stadler
WM: Dynamic contrast-enhanced magnetic resonance imaging
pharmacodynamic biomarker study of sorafenib in metastatic renal
carcinoma. J Clin Oncol. 26:4572–4578. 2008. View Article : Google Scholar : PubMed/NCBI
|