Introduction
Head and neck squamous cell carcinoma (HNSCC) is
located in the upper aerodigestive tract. Although it is the sixth
most common neoplasm in the world, advances in multi-modality
treatments, including surgery, radiation and chemotherapy, have not
increased the 5-year survival rate of ~50% over the past 35 years
(1,2).
Identifying biomarkers in the blood or other body fluids of an
individual may aid in the diagnosis of disease and predict
treatment outcomes in patients with HNSCC (3,4). In a
cross-sectional study, analysis of a candidate biomarker uses
single time-point sampling from population data (5). By contrast, a longitudinal analysis
involves using multiple samples from a single patient at various
time points; therefore, this type of analysis reveals quantitative
alterations in the candidate biomarker in the patient, which may be
associated with improved health, treatment outcomes and clinical
status of the patient (6). However,
to quantify a candidate biomarker in a longitudinal study, a
standardized assay that supports robust and consistent inter-assay
data collection is critical for statistical analyses (7).
Flow cytometry is a laser-based technology for the
analysis of physical and chemical properties of cells or cellular
components. Advances in flow cytometer designs and novel
fluorochromes for the chemical conjugation of antibodies have
facilitated robust, multi-parametric analysis at a single cell
level. The technology has been widely used in basic research
(8), clinical analysis of patient
immune responses (9), hematological
malignancies and minimal residue disease (10–12), and
enumeration of lymphocyte populations in immunodeficient diseases
and cancer (13,14).
The present study aimed to evaluate whether the
expression of cluster of differentiation (CD) 3ζ in peripheral T
cells from patients with HNSCC may serve as a biomarker for the
early detection of recurrent or persistent HNSCC in a longitudinal
study. The present study used commercially available anti-CD3ζ
antibodies in flow cytometry to determine CD3ζ expression in a
cohort population of patients with HNSCC prior to and following
clinical treatments. However, while comparing the longitudinal data
obtained over multiple time points, the present study observed that
numerous ranges of CD3ζ expression were exhibited in the flow
cytometric assays. The present study developed and described a
method that conducts longitudinal flow cytometric analysis of a
candidate biomarker, such as CD3ζ, in patients with HNSCC.
Materials and methods
Cohort of patients with HNSCC
In total, 24 patients with HNSCC, which consisted of
15 male and 9 female patients, were evaluated in the current study.
The age range of the patients was 21–94 years, with a median age of
64 years. Histological analysis revealed that 95.83% of the
patients possessed cancers of a squamous origin. In total, 16
patients were treated using a single treatment modality, including
surgery, radiation or chemotherapy, and 8 patients were treated
using a combination of various treatment modalities, including
surgery with radiation or chemotherapy (Table I). Peripheral blood (10–15 ml) was
collected from the 24 patients and also from 24 healthy control
donors. Peripheral blood mononuclear cells (PBMCs) were isolated
using Ficoll gradient centrifugation, as previously described
(15,16). The present study was approved by the
Research Ethics Board at the University of Manitoba (Winnipeg, MB,
Canada).
 | Table I.Clinical pathological characteristics
of 24 patients with head and neck squamous cell carcinoma. |
Table I.
Clinical pathological characteristics
of 24 patients with head and neck squamous cell carcinoma.
| Characteristics | n |
|---|
| Total | 24 |
| Gender |
|
| Male | 15 |
|
Female | 9 |
| Age, years |
|
|
Median | 64 |
|
Range | 21–94 |
| Histological
type |
|
| Squamous
cell | 23 |
| Merkel
cell | 1 |
| Treatment |
|
|
Surgery | 13 |
|
Chemo | 1 |
| Surgery +
chemo + radiation | 4 |
| Surgery +
radiation | 1 |
|
Radiation | 1 |
| Chemo +
radiation | 4 |
Antibodies and flow cytometry
Sequential staining was performed to evaluate CD3ζ
expression in T cells using flow cytometry. Surface CD3ε, a marker
of T cells, was stained using specific fluorescein isothiocyanate
(FITC) mouse anti-human CD3 monoclonal antibody (clone, UCHT1; cat
no. 55916; dilution, 1:66; BD Biosciences, Franklin Lakes, NJ,
USA). Following surface staining, PBMCs were fixed in 1%
paraformaldehyde (Sigma-Aldrich, Ontario, Canada)for 10 min at room
temperature, followed by two rounds of washing with
phosphate-buffered saline (PBS). In total, 2 ml of cell
permeabilization buffer (0.1% saponin and 0.05% sodium azide in
PBS; Sigma-Aldrich) was added to the PBMCs. The PBMCs were kept on
ice for 15 min in the dark, washed once with cell permeabilization
buffer and resuspended in 0.2 ml of the cell permeabilization
buffer. The expression of CD3ζ was detected intracellularly, using
a specific phycoerythrin (PE)-conjugated monoclonal antibody
(clone, 2H2D9; ca no. IM3169; dilution, 1:10; Beckman Coulter,
Inc., Brea, CA, USA). An immunoglobulin (Ig)-G1 isotype control
(eBiosciences, San Diego, CA, USA) was used to distinguish specific
CD3ζ binding from non-specific binding during flow cytometry. The
optimal amount of antibody was determined by titration and the
cells were analyzed by BD FACSCanto™II flow cytometer (BD
Biosciences). A total of 10,000 events were acquired and the
expression levels of CD3ζ in T cells (gated on CD3ε+)
were analyzed using FlowJo software, version 9.6.2 (FlowJo, LLC,
Ashland, OR, USA) by the mean florescence intensity (MFI).
Freezing and thawing of PBMCs
PBMCs were isolated from the whole blood of healthy
donors and HNSCC patients using Ficoll gradient centrifugation, as
previously described (15,16), and washed once in complete medium,
consisting of RPMI-1640, penicillin/streptomycin/L-Glutamine and
10% fetal bovine serum (Thermofisher Scientific, Inc., Ontario,
Canada). Viable cell numbers were determined by a B4005
hemocytometer and trypan blue viable cell exclusion dye (VWR
International, Ontario, Canada) (17). PBMCs were cryopreserved at −196°C in
aliquots in complete medium, which contained a final concentration
of 10% dimethyl sulfoxide, using a Mr. Frosty™ Freezing Container
(Thermo Fisher Scientific, Inc., Waltham, MA, USA), according to
the manufacturer's protocol. The cryopreserved PBMC was removed
from liquid nitrogen, and rapidly thawed in a 37°C water bath prior
to the cells being transferred to 10 ml pre-warm complete media.
The cell pellet was collected and resuspended in 1 ml of fresh,
warm complete media at 37°C. The viable cell count was determined,
and the thawed cells were used directly for flow cytometric
assays.
Internal control for flow
cytometry
The present study collected PBMCs from 5 healthy
donors. The PBMCs of the healthy donors were pooled and stored in
small aliquots in liquid nitrogen until use. In each flow
cytometric assay, one of these vials was thawed (0.5×10⁶
cells) and used in the staining process along with the patient
samples. To evaluate the intra and inter-assay variation, the same
internal control was thawed and the CD3ζ expression was analyzed 3
times using flow cytometry at 3 time points in weekly intervals.
The MFI of the CD3ζ chain expression was measured within an
individual experiment for intra-assay variability and between
multiple experiments for inter-assay variability.
Determination of cell viability and
exclusion of dead cells from the analysis
To determine the cell viability and to exclude the
dead cells from the analysis, Fixable Viability Dye eFluor® 780
(eBioscience, Inc., San Diego, CA, USA) was used, according to the
manufacturer's protocol. The cells were washed with flow buffer
(0.05% FBS, 10% sodium azide in PBS) and surface staining was
performed using an anti-CD3ε monoclonal antibody. The cells were
then kept in the dark at 4°C for an additional 30 minutes prior to
intracellular staining for CD3ζ. Live T cells, gated from the dead
cells using either the fixable viability dye or forward
scatter/side scatter (FSC/SSC), were analyzed for CD3ζ chain
expression.
Data normalization
CD3ζ expression (expressed as the MFI) was
determined in the PBMCs of the internal control, healthy controls
and patients using an individual flow cytometric assay. Data
normalization was performed by transforming the MFI values of the
test samples (patients and healthy donor) to a common scale using
the following equation: Final relative fluorescence intensity = MFI
of the test sample/MFI of the internal control.
Normality and statistical
analysis
Normality and statistical analyses of the data were
performed using the GraphPad Prism 5 software (GraphPad Software,
Inc., La Jolla, CA, USA), termed the normality test. The
D'Agostino-Pearson omnibus test was performed to investigate
whether the data passed the normality test. An unpaired
t-test was applied to the data that passed the normality
test. The Mann-Whitney test was used on data that did not pass the
normality test.
Results
Flow cytometric analysis of CD3ζ chain
expression
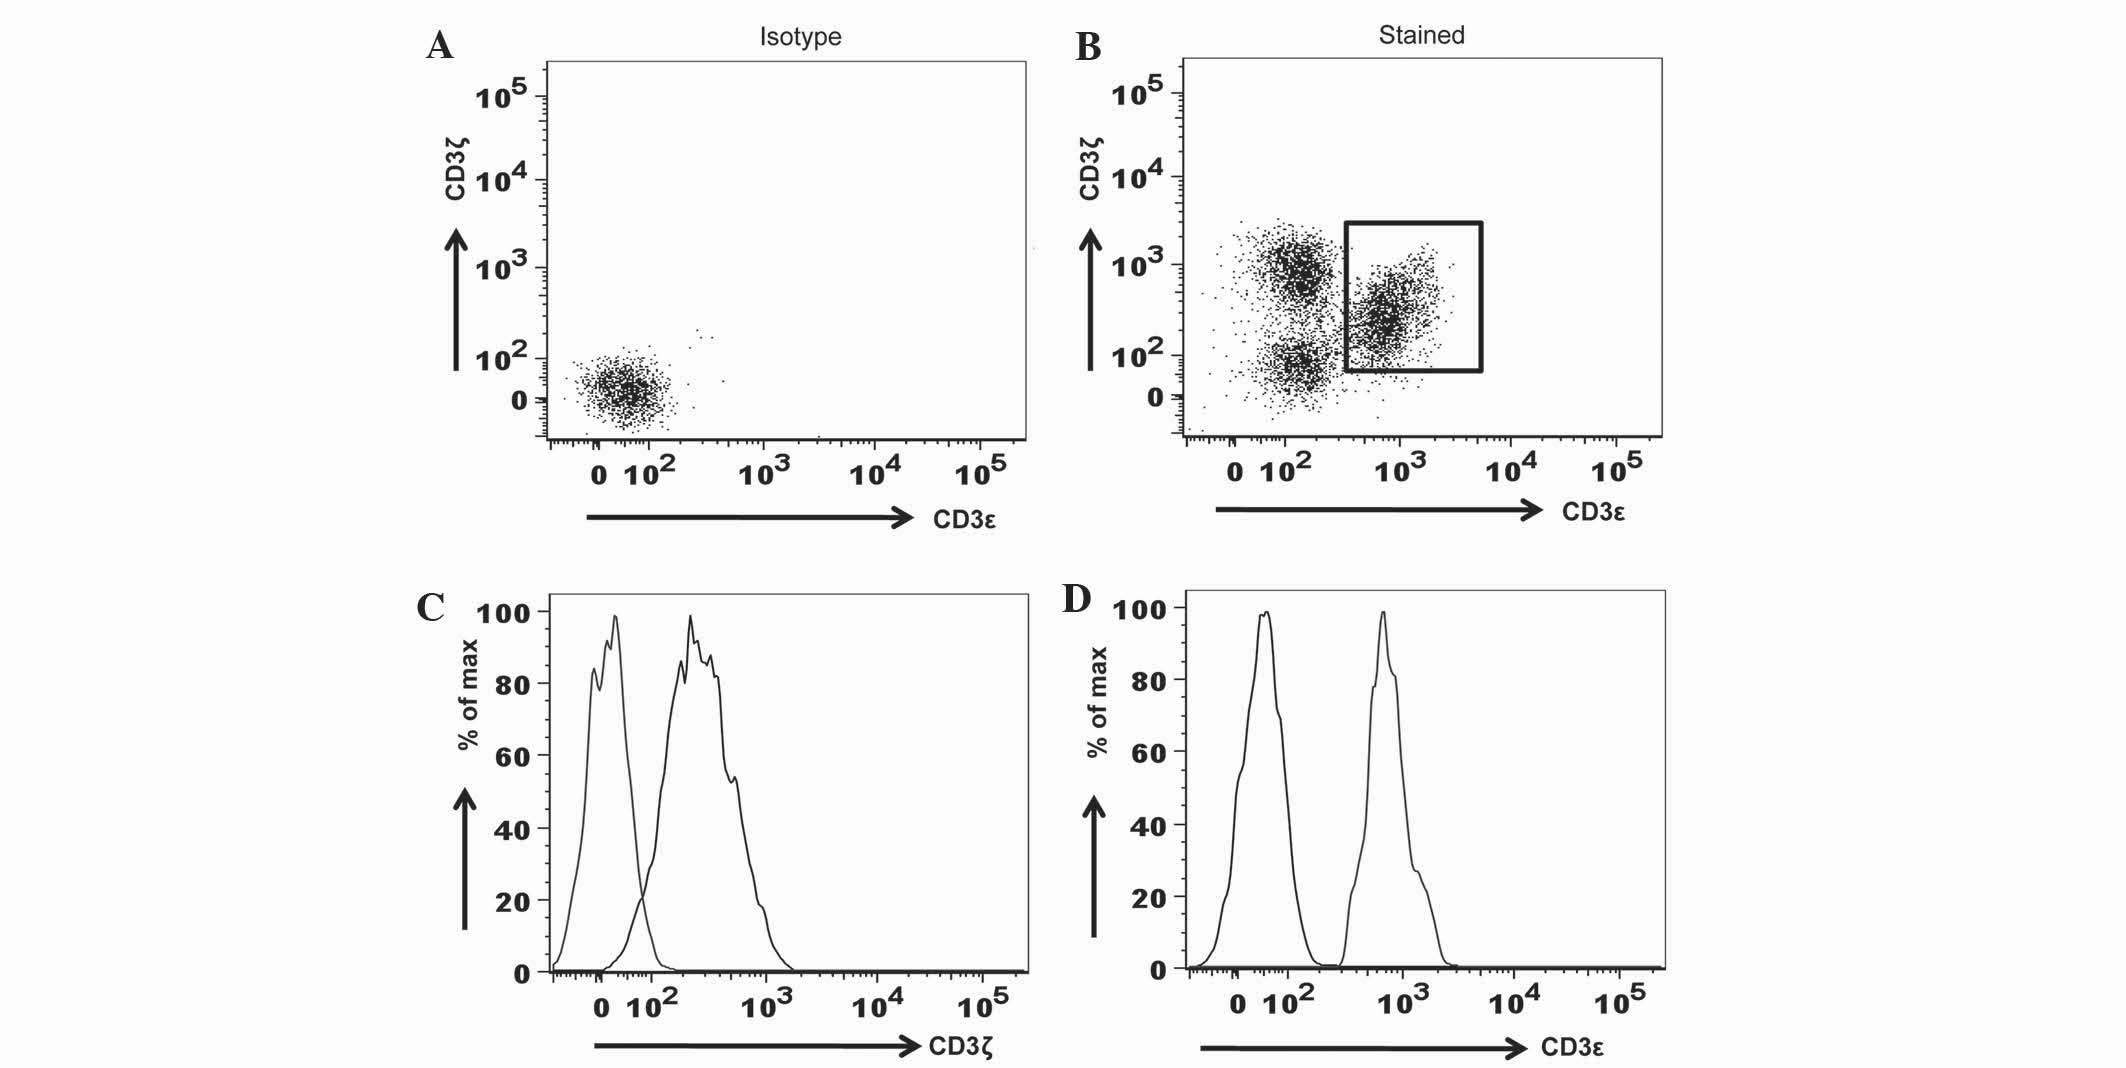
To evaluate the specificity of anti-CD3 antibodies
in flow cytometry, fluorochrome-conjugated isotype controls,
consisting of the PE-mouse IgG1/κ antibody for CD3ζ detection and
the FITC-IgG1/κ antibody for CD3ε detection, were used in the
surface and intracellular staining of PBMC. The present study
demonstrated that, when compared to the isotype controls, anti-CD3ζ
and anti-CD3ε antibodies were specific (Fig. 1).
Freezing and thawing of PBMCs may
induce cell death and affect the present analysis
Using a commercial fixable viability dye, the
present study observed that the percentage of dead cells in the
thawed samples were in the range of 2–23% (Fig. 2). To measure CD3ζ chain expression
using MFI in live cells, the present study separated live cells
from dead cells using the viability dye prior to the analysis of
CD3ζ expression in the CD3ε+ T cells. In addition, the
present study compared the differences in CD3ζ expression when the
live cells were gated by either the viability dye or the FSC/SSC
properties of the total cells acquired. The present study observed
that there were no significant differences in the MFI determined by
these two methods of live cell gating (Fig. 2).
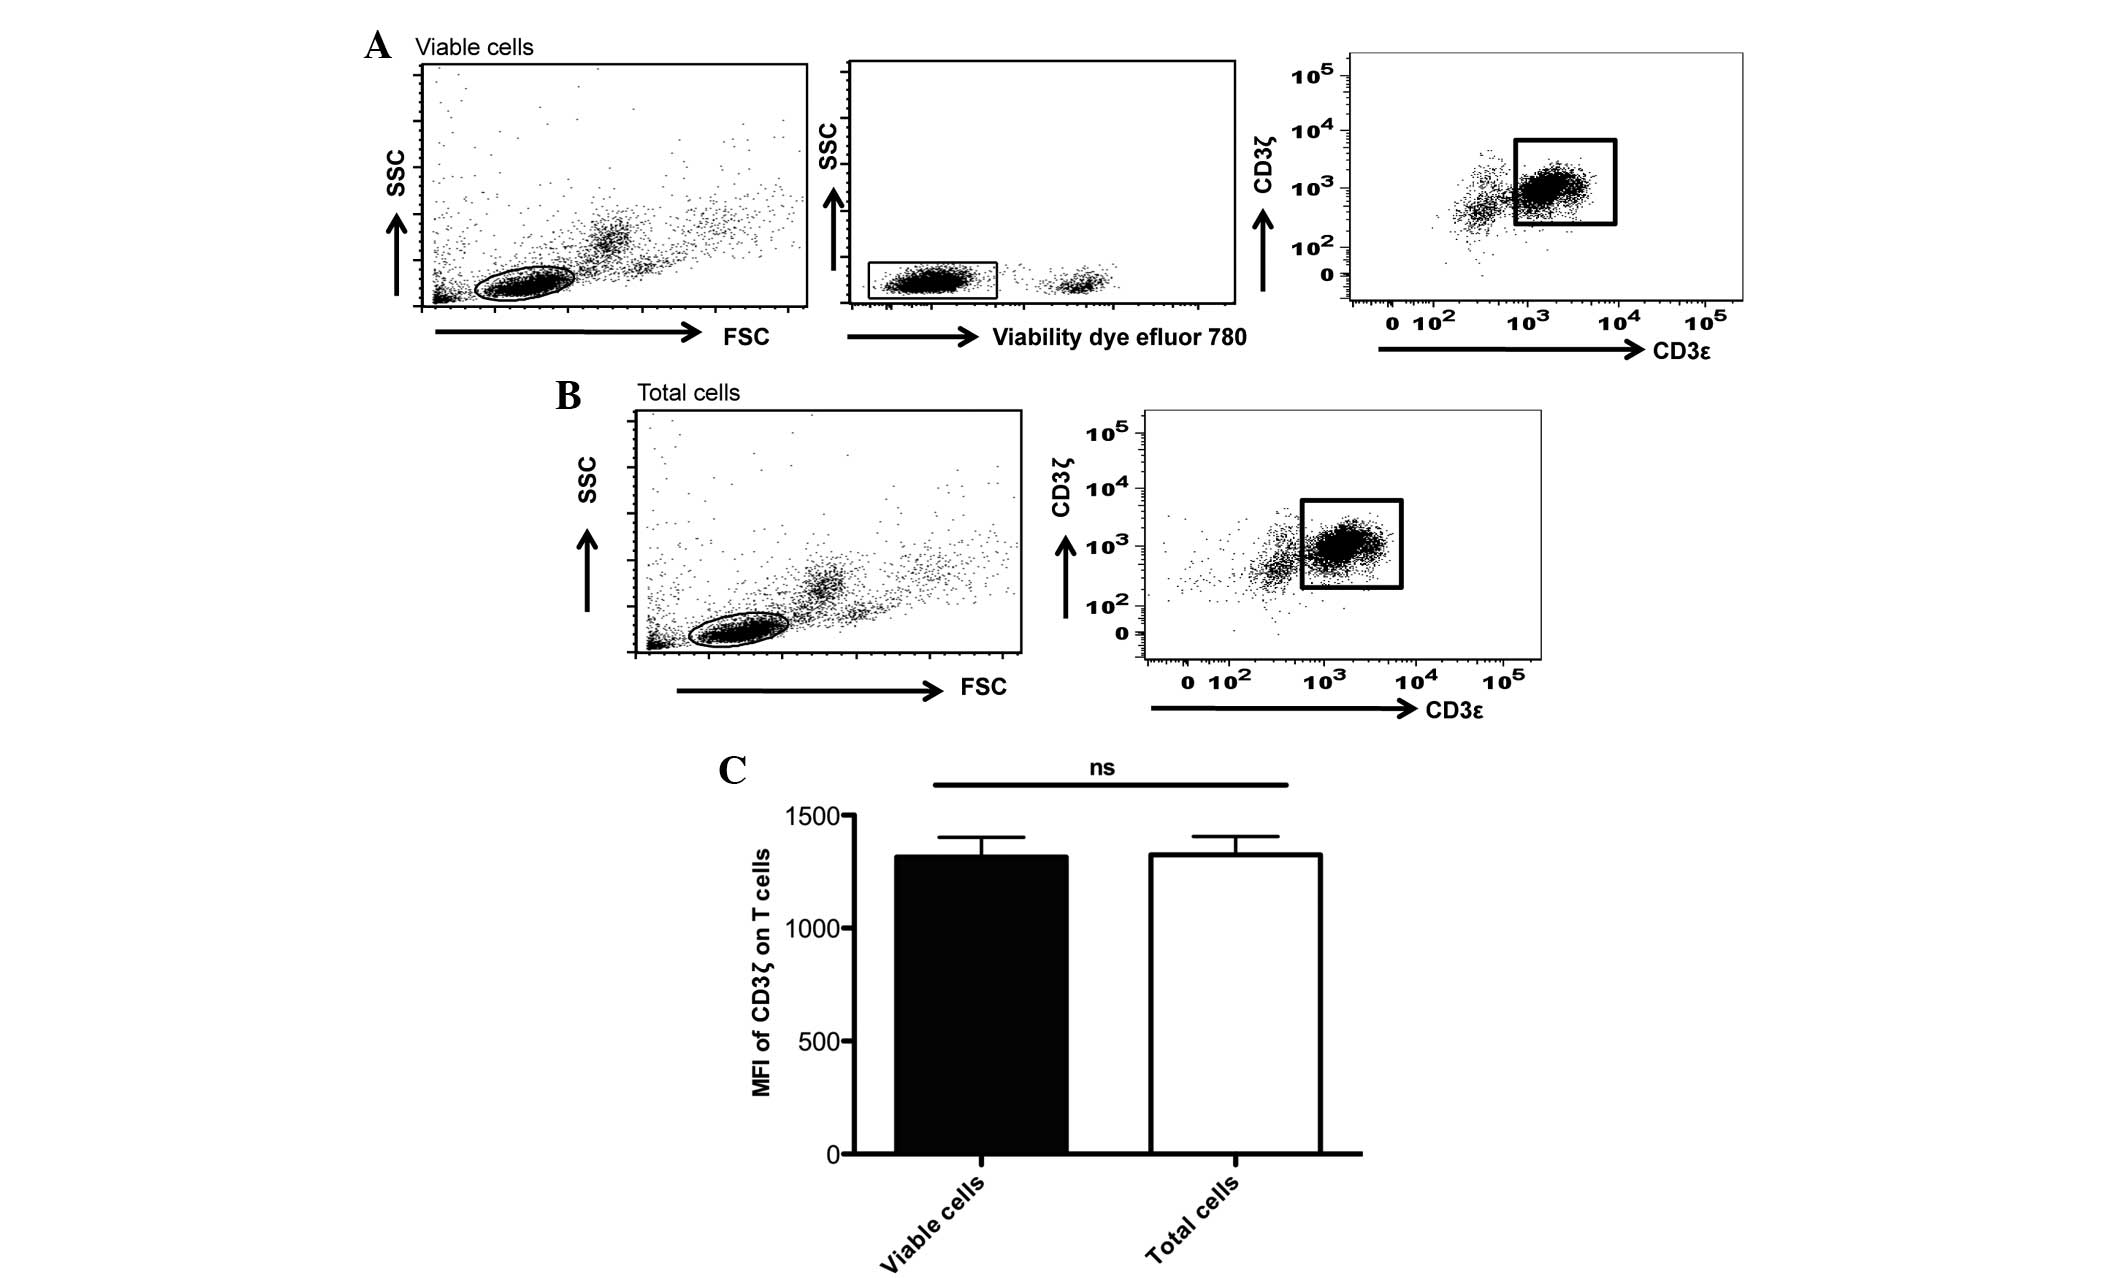 | Figure 2.Live-cell gating by either viability
dye or forward/scatter properties of the total cells acquired did
not affect the MFI analyses of the CD3ζ chain expression. (A) MFI
of the CD3ζ chain measured in the viable cells, gated by viability
dye. In total, 0.5×10⁶ cells of the thawed peripheral
blood mononuclear cells were washed in PBS and resuspended in 200
µl of serum-free PBS. A total of 0.2 µl fixable viability dye was
added to the cells, incubated for 30 min at 4°C prior to subsequent
washing and surface and intracellular staining of CD3ε and CD3ζ,
respectively. Using BD FACS flow cytometry 10,000 events were
acquired. Based on FSC/SSC properties, lymphocyte populations were
gated for subsequent discriminations of dead and viable cells by
the Fixable Viability Dye eFluor® 780 (eBioscience, Inc.). Only the
viable cells were gated in the MFI analyses of the CD3ζ chain in
CD3ε+/CD3ζ+ cells. (B) MFI of the CD3ζ chain
was determined by live-cell gating using the FSC/SSC properties of
the total cells. Live lymphocyte populations were gated by their
FSC/SSC properties. MFI of the CD3ζ chain in the
CD3ε+/CD3ζ+ T cells were determined. (A and
B) These experiments were generated from the same experiment,
except the use of the viability dye in (A). (C) No significant
difference in the MFI of the CD3ζ expression in the
CD3ε+/CD3ζ+ cells was observed when the two
methods of live-cell gating were compared. The statistical analysis
was performed using Student's t-test (GraphPad Prism 5; 5
experiments were performed in total). MFI, mean fluorescence
intensity; CD, cluster of differentiation; PBS, phosphate-buffered
saline; FSC/SSC, foward scatter/side scatter; ns,
non-significant. |
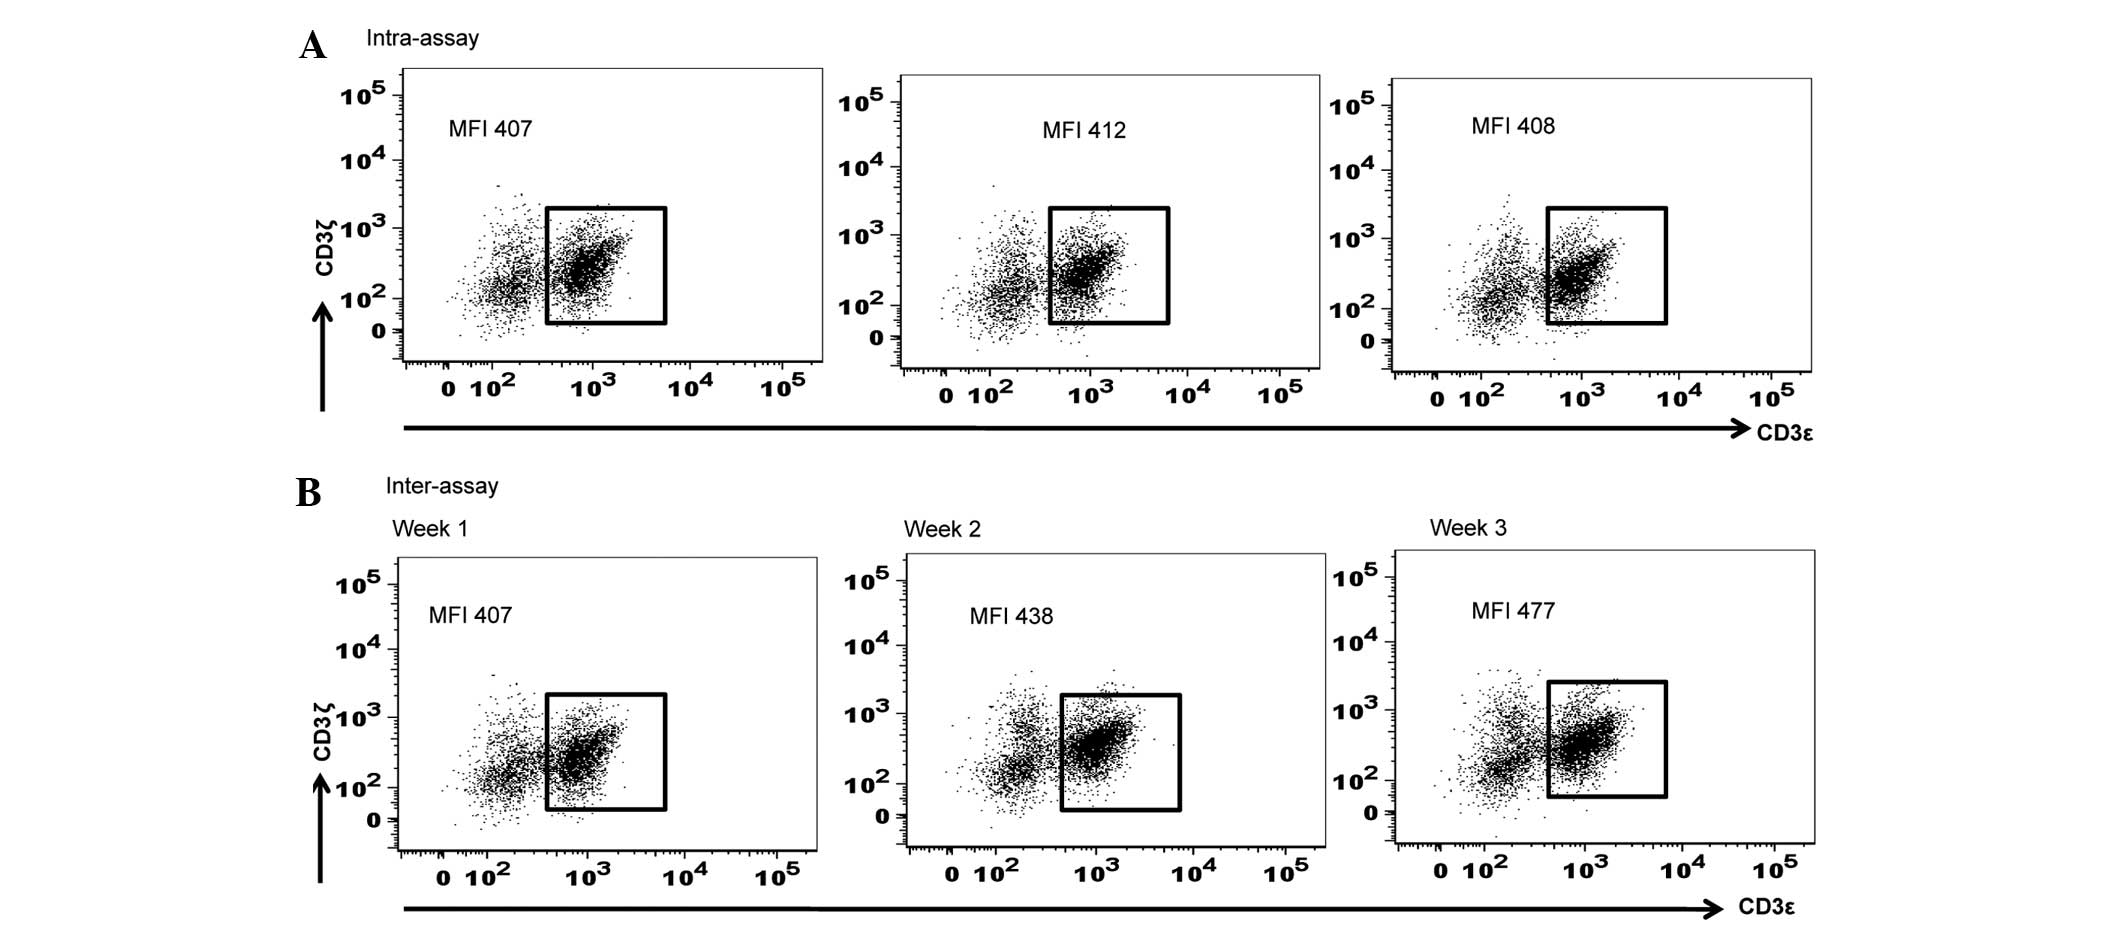
Subsequently, the present study calculated the
standard deviation for the inter-assay and intra-assay variations
in MFI of CD3ζ expression using various aliquots of the identical
PBMC sample thawed and assayed at various time points (weekly
intervals for 3 consecutive weeks) for the inter-assay, and
triplicate measurements of 1 aliquot of PBMC sample thawed and
assayed in a single flow cytometric assay for the intra-assay. The
ranges of the variations observed within an assay and between
multiple assays were 407–412 and 407–477, respectively. The
standard deviations for intra-assay and inter-assay were 2.16 and
28.6, respectively (Fig. 3).
Data analysis with or without
normalization
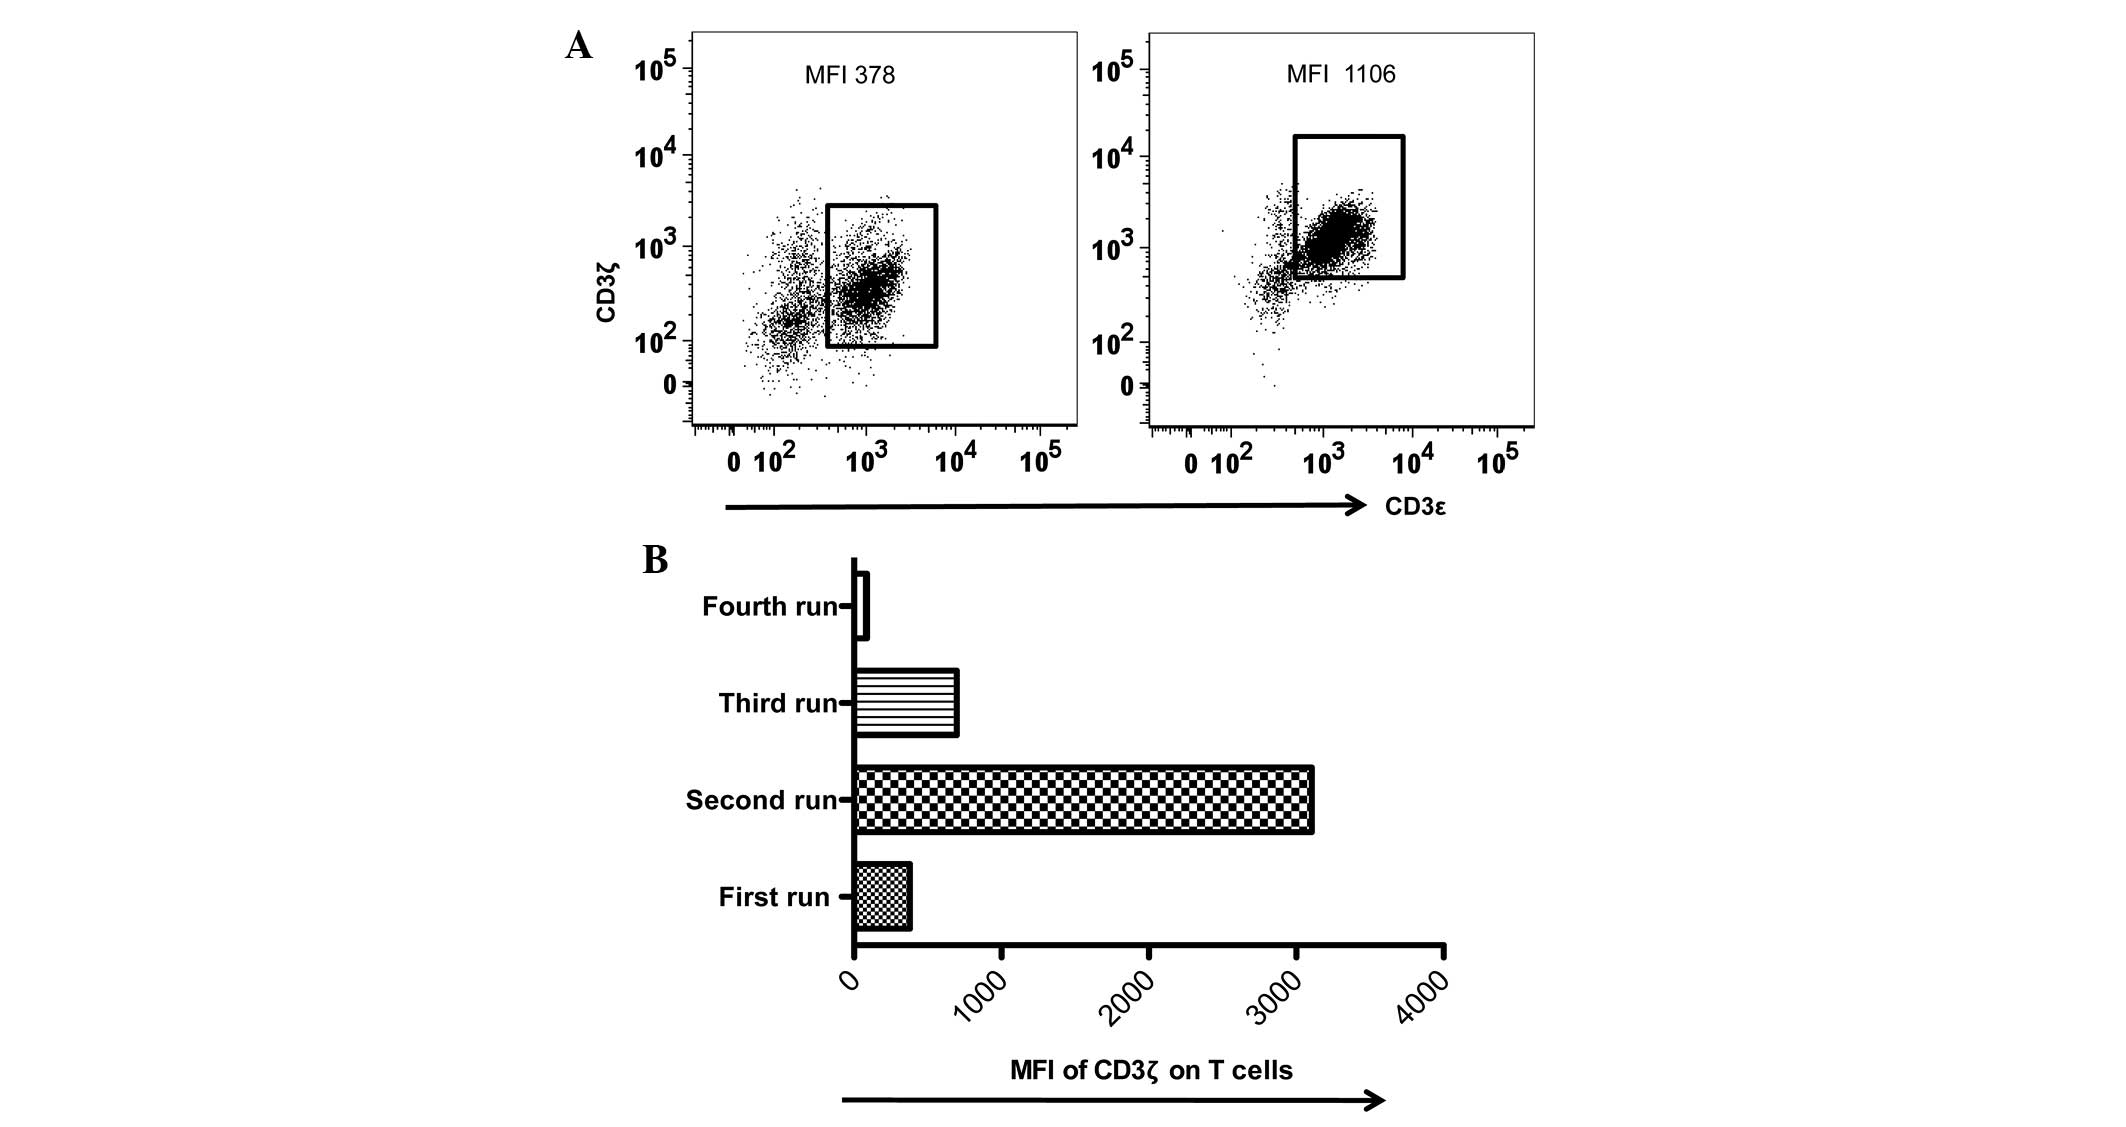
Despite efforts to perform flow cytometric assays
under identical conditions, the present study observed larger
inter-assay variations in the MFI values of CD3ζ expression during
the last 36 months. The present study noted that the MFI values of
CD3ζ expression of the identical internal control varied between
378 and 1,106. It was reasoned that an internal control provided
not only a quick way to examine MFI variations acquired using
various equipment or the same equipment under identical
photomultiplier (PMT) voltages, but also a reference value for data
normalization in the inter-assays (Table
II). Therefore, the present study applied a normalization
procedure to the data sets of CD3ζ expression in the PBMC samples
of the patients with HNSCC, which represented a low range (MFI,
378; Table III) and a high range of
CD3ζ MFI (MFI, 1,106; Table IV). In
addition, the present study incorporated a data set collected under
an extreme MFI (MFI, 3,106; Fig. 4;
Table V) to additionally test the
normalization procedure. As revealed in Tables III–V,
normalization transformed the data in the low, high and extreme MFI
groups into more consistent values.
| Table II.Raw and normalized data of the MFI of
CD3ζ expression in CD3+ T lymphocytes. |
Table II.
Raw and normalized data of the MFI of
CD3ζ expression in CD3+ T lymphocytes.
|
| Internal control | Sample |
|---|
|
|
|
|
|---|
| Run no. | Prior to
normalization | Following
normalization | Prior to
normalization | Following
normalization |
|---|
| 1 | 378 | 1.00 | 281 | 0.74 |
| 2 | 1106 | 1.00 | 2213 | 0.71 |
| 3 | 3106 | 1.00 | 999 | 0.90 |
| Table III.Data normalization of the MFI of CD3ζ
on CD3+ T lymphocytes in a low MFI range prior to and
following data normalization. |
Table III.
Data normalization of the MFI of CD3ζ
on CD3+ T lymphocytes in a low MFI range prior to and
following data normalization.
|
| Prior to
normalization | Following
normalization |
|---|
|
|
|
|
|---|
| Value | Patient | Healthy donor | Patient | Healthy donor |
|---|
| MFI | 185 | 253 | 0.48 | 0.66 |
|
| 248 | 238 | 0.65 | 0.62 |
|
| 209 | 256 | 0.55 | 0.67 |
|
| 260 | 378 | 0.68 | 1.00 |
|
| 282 | 392 | 0.74 | 1.03 |
|
| 282 | 340 | 0.74 | 0.89 |
|
| 257 | 304 | 0.67 | 0.80 |
|
| 212 | 238 | 0.56 | 0.62 |
| Table IV.Data normalization of the MFI of the
CD3ζ on CD3+ T lymphocytes in a high MFI range prior to
and following data normalization. |
Table IV.
Data normalization of the MFI of the
CD3ζ on CD3+ T lymphocytes in a high MFI range prior to
and following data normalization.
|
| Prior to
normalization | Following
normalization |
|---|
|
|
|
|
|---|
| Value | Patient | Healthy donor | Patient | Healthy donor |
|---|
| MFI | 611 | 1,271 | 0.55 | 1.14 |
|
| 515 | 1,106 | 0.46 | 1.00 |
|
| 597 | 1,337 | 0.53 | 1.20 |
|
| 989 |
675 | 0.89 | 0.61 |
|
| 601 |
880 | 0.54 | 0.79 |
|
| 614 |
820 | 0.55 | 0.74 |
|
| 566 |
583 | 0.51 | 0.52 |
|
| 471 |
674 | 0.42 | 0.60 |
| Table V.Data normalization of the MFI of the
CD3ζ on CD3+ T lymphocytes in an extreme MFI range prior
to and following data normalization. |
Table V.
Data normalization of the MFI of the
CD3ζ on CD3+ T lymphocytes in an extreme MFI range prior
to and following data normalization.
|
| Prior to
normalization | Following
normalization |
|---|
|
|
|
|
|---|
| Value | Patient | Healthy donor | Patient | Healthy donor |
|---|
| MFI | 2,096 | 2,758 | 0.67 | 0.88 |
|
| 2,019 | 2,694 | 0.65 | 0.86 |
|
| 2,356 | 2,701 | 0.75 | 0.86 |
|
| 2,276 | 3,364 | 0.73 | 1.08 |
|
| 2,092 | 3,106 | 0.67 | 1.00 |
|
| 1,972 | 2,358 | 0.63 | 0.75 |
|
| 2,215 | 2,108 | 0.71 | 0.67 |
|
| 2,113 | 2,080 | 0.68 | 0.66 |
Analysis of CD3ζ expression in healthy
controls and patients with HNSCC
Previous small cross-sectional studies have reported
a reduced level of the CD3ζ chain in the peripheral blood
lymphocytes of patients compared with healthy controls (12,13).
Therefore, the present study compared the MFI of CD3ζ expression in
the healthy controls and the HNSCC patients prior to and following
the normalization process. The present study measured the MFI of
CD3ζ expression in the CD3ε+ T lymphocytes of the
healthy control individual and patient samples and normalized the
data using the internal control under identical conditions in each
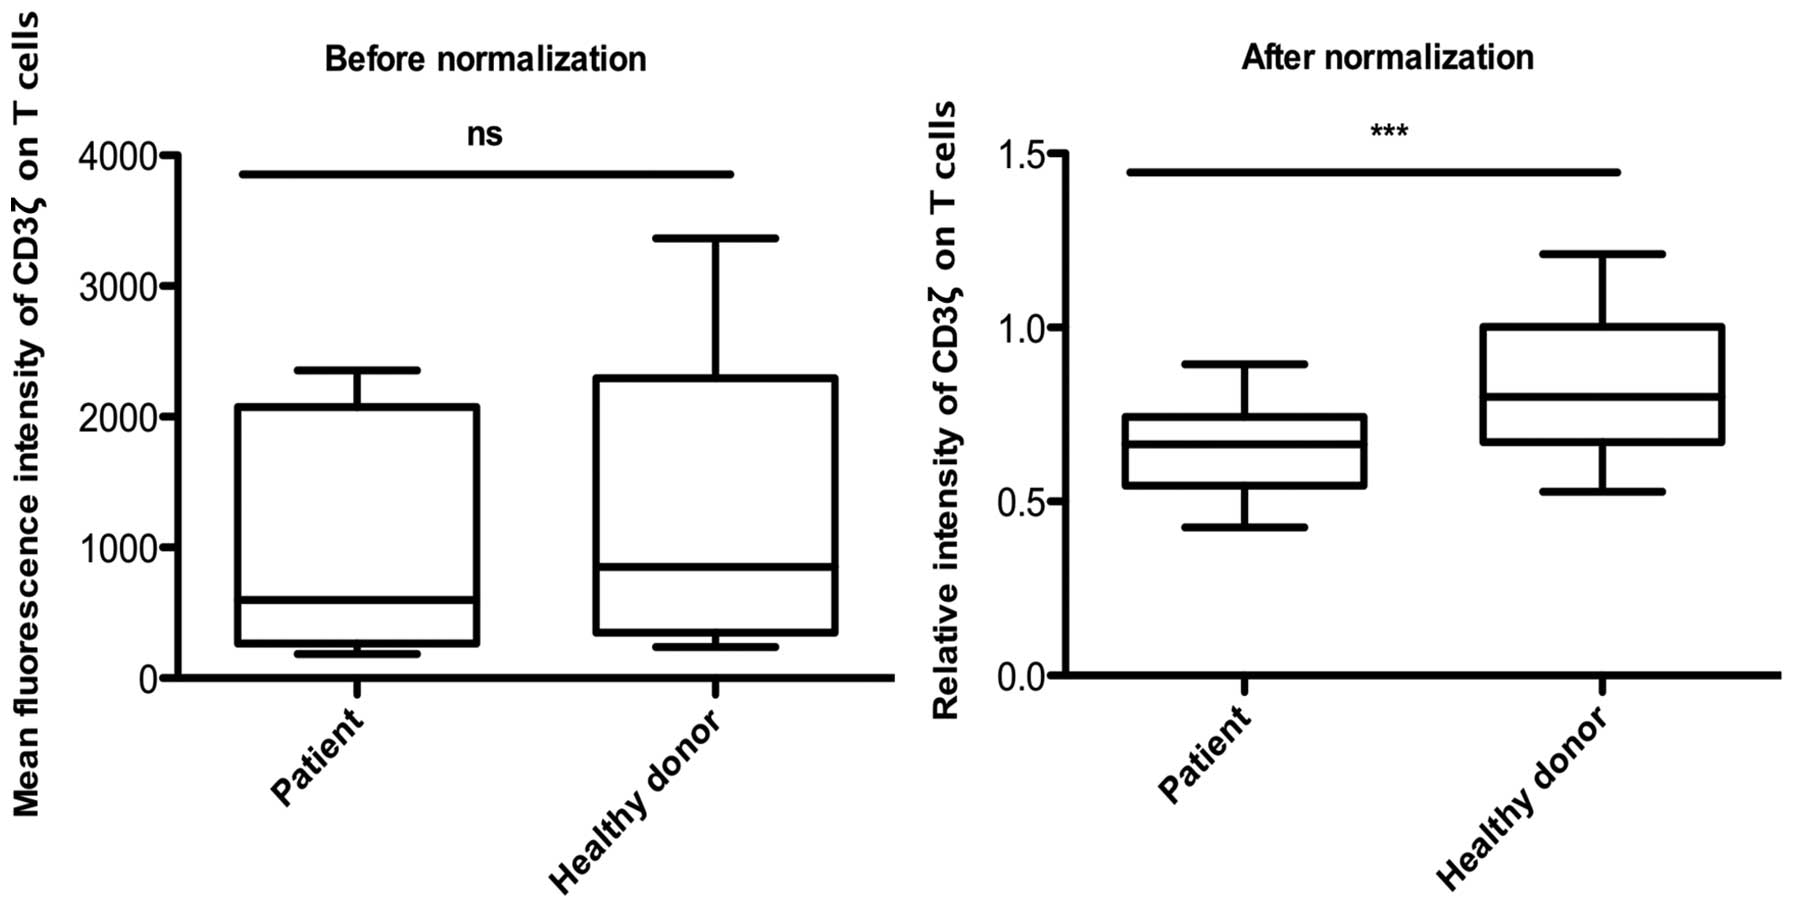
experiment. Prior to normalization, no significant difference was
observed between the MFI of CD3ζ expression in the healthy controls
and the patients with HNSCC. By contrast, following normalization,
CD3ζ expression was observed to be significantly decreased in the
patients with HNSCC compared with the healthy controls (Fig. 5). Subsequently, the present study
validated the normalization procedure in the analyses of CD3ζ
expression in a longitudinal study. The present study used
longitudinal PBMC samples from a single patient to illustrate the
feasibility of using the normalization procedure in a longitudinal
study. As revealed in Fig. 6, the use
of the internal control during normalization standardized the flow
cytometric CD3ζ MFI data acquired at various time points, which in
turn allowed each subsequent follow-up sample to be compared to the
previous sample, including the baseline data obtained prior to the
patient receiving any type of clinical treatment (Fig. 6).
Discussion
The CD3ζ chain is involved in signal transduction
and T cell activation (16–18). Growing evidence suggests that ζ-chain
degradation in cancer and other malignancies may negatively
regulate T cell function (16,19);
however, there has not been sufficient evidence to validate the use
of ζ-chain expression as a biomarker of disease prognosis. With the
wide use of flow cytometry in clinical trials, it is essential to
follow gold-standard procedure to quantify biomarkers of disease.
The current study developed and validated a method that used an
internal control and a normalization procedure to monitor the
expression levels of CD3ζ in a HNSCC patient cohort over multiple
time-points using flow cytometry.
In a review that summarized a general flow cytometry
equipment setup, Maecker et al suggested certain setup
controls for use in flow cytometric analysis as follows: Gating
controls to define positive signals and the use of biological
controls, including healthy donors to compare alterations of any
factor associated with alterations in the health of patients
(20). The present longitudinal study
consisted of an additional internal control for inter-assay
variations. PBMC collected from a healthy donor was aliquoted and
cryopreserved in multiple aliquots. Each aliquot was used as an
internal control; the control was prepared for anti-CD3ζ staining
and run alongside other test samples under specific experimental
and flow cytometric conditions.
Increasing the PMT voltage is directly proportional
to the strength of signals generated from a certain amount of
light, and increasing or decreasing the PMT voltage directly
affects the output signals and ultimately adds complexity to result
analysis (21). Therefore, it is
recommended to keep the PMT voltage constant for longitudinal
studies. The present study observed that the inter-assay variations
assayed in the short term, such as weekly intervals, was reasonably
small (Fig. 3). However, despite
trying to keep the PMT voltage constant in each flow cytometric
analysis, the present study observed that the same internal control
produced different MFI values under the same PMT voltage at various
time points in a long-term longitudinal study (Fig. 4). These variations may have arisen due
to various factors, including a slight alteration in PMT voltage
upon each calibration, batch-to-batch variation of the
fluorochrome-conjugated anti-CD3ζ antibodies and laser sensitivity.
Therefore, a standardized procedure to normalize data obtained in
inter-assays was required so that the MFI values were in a
consistent range for statistical analyses.
Using a small sample size of healthy control
individuals and patients with HNSCC, the present study compared the
MFI of CD3ζ expression in the PBMCs of these two groups, with or
without applying the normalization procedure. Prior to
normalization, statistical analysis indicated that the distribution
of data was not normal. There was no statistically significant
difference between the CD3ζ expression in the PBMCs of the healthy
individuals and patients with HNSCC (Fig.
5). However, following normalization, the present study
observed that the distribution of the data became normal. In
accordance with previous studies (12,13), the
present study identified that the downregulation of the normalized
MFI of the CD3ζ chain on T cells was statistically significant
compared with the healthy donors (Fig.
5). Transforming the raw data, which had various ranges of MFI,
into a normalized scale allowed all the variations in MFI values to
become closer in range. This eliminated, not only the effect of
inconsistent values generated at multiple cytometric assays, but
also enabled a direct comparison of CD3ζ expression data collected
at various time-points. Consequently, this method allowed the
present study to observe alterations in the expression levels of
the molecule of interest using flow cytometry in a longitudinal
study (Fig. 6). The standardized
method of measuring CD3ζ expression in frozen PBMC using flow
cytometry may allow alterations in biomarkers of interest to be
tracked by flow cytometry in a large cohort of patients with HNSCC
in a longitudinal study.
Acknowledgements
The present study was supported by the Manitoba
Medical Service Foundation and Health Science Center Foundation,
University of Manitoba (Grant no. G00314660).
References
|
1
|
Ferlay J, Shin HR, Bray F, Forman D,
Mathers C and Parkin DM: Estimates of worldwide burden of cancer in
2008: GLOBOCAN 2008. Int J Cancer. 127:2893–2917. 2010. View Article : Google Scholar : PubMed/NCBI
|
|
2
|
Parkin DM, Bray F, Ferlay J and Pisani P:
Global cancer statistics, 2002. CA Cancer J Clin. 55:74–108. 2005.
View Article : Google Scholar : PubMed/NCBI
|
|
3
|
Chau CH, Rixe O, McLeod H and Figg WD:
Validation of analytic methods for biomarkers used in drug
development. Clin Cancer Res. 14:5967–5976. 2008. View Article : Google Scholar : PubMed/NCBI
|
|
4
|
Schmalfuss F and Kolominsky-Rabas PL:
Personalized medicine in screening for malignant disease: A review
of methods and applications. Biomark Insights. 8:9–14. 2013.
View Article : Google Scholar : PubMed/NCBI
|
|
5
|
Sexton WM, Lin Y, Kryscio RJ, Dawson DR,
Ebersole JL and Miller CS: Salivary biomarkers of periodontal
disease in response to treatment. J Clin Periodontol. 38:434–441.
2011. View Article : Google Scholar : PubMed/NCBI
|
|
6
|
Lovestone S and Thambisetty M: Blood-based
biomarkers of Alzheimer's disease: Challenging but feasible.
Biomark Med. 4:65–79. 2010. View Article : Google Scholar : PubMed/NCBI
|
|
7
|
Latosinska A, Bhat A and Frantzi M:
Clinical proteomic biomarkers: Relevant issues on study design
& technical considerations in biomarker development. Clin
Transl Med. 3:72014. View Article : Google Scholar : PubMed/NCBI
|
|
8
|
Mahmood S, Kanwar N, Tran J, Zhang ML and
Kung SK: SHP-1 phosphatase is a critical regulator in preventing
natural killer cell self-killing. PLoS One. 7:e442442012.
View Article : Google Scholar : PubMed/NCBI
|
|
9
|
Best LM, van Veldhuyzen Zanten SJ,
Bezanson GS, Haldane DJ and Malatjalian DA: Serological detection
of Helicobacter pylori by a flow microsphere immunofluorescence
assay. J Clin Microbiol. 30:2311–2317. 1992.PubMed/NCBI
|
|
10
|
Deptala A and Mayer SP: Detection of
minimal residual disease. Methods Cell Biol. 64:385–420. 2001.
View Article : Google Scholar : PubMed/NCBI
|
|
11
|
Dunphy CH: Contribution of flow cytometric
immunophenotyping to the evaluation of tissues with suspected
lymphoma? Cytometry. 42:296–306. 2000. View Article : Google Scholar : PubMed/NCBI
|
|
12
|
Paietta E: Assessing minimal residual
disease (MRD) in leukemia: A changing definition and concept? Bone
Marrow Transplant. 29:459–465. 2002. View Article : Google Scholar : PubMed/NCBI
|
|
13
|
Bagwell CB, Clark GM, Spyratos F,
Chassevent A, Bendahl PO, Stål O, Killander D, Jourdan ML, Romain
S, Hunsberger B and Baldetrop B: Optimizing flow cytometric DNA
ploidy and S-phase fraction as independent prognostic markers for
node-negative breast cancer specimens. Cytometry. 46:121–135. 2001.
View Article : Google Scholar : PubMed/NCBI
|
|
14
|
de Vries E, Noordzij JG, Kuijpers TW and
van Dongen JJ: Flow cytometric immunophenotyping in the diagnosis
and follow-up of immunodeficient children. Eur J Pediatr.
160:583–591. 2001. View Article : Google Scholar : PubMed/NCBI
|
|
15
|
Kulkarni DP, Wadia PP, Pradhan TN, Pathak
AK and Chiplunkar SV: Mechanisms involved in the down-regulation of
TCR zeta chain in tumor versus peripheral blood of oral cancer
patients. Int J Cancer. 124:1605–1613. 2009. View Article : Google Scholar : PubMed/NCBI
|
|
16
|
Whiteside TL: Down-regulation of
zeta-chain expression in T cells: A biomarker of prognosis in
cancer? Cancer Immunol Immunother. 53:865–878. 2004. View Article : Google Scholar : PubMed/NCBI
|
|
17
|
Ioannides CG and Whiteside TL: T cell
recognition of human tumors: Implications for molecular
immunotherapy of cancer. Clin Immunol Immunopathol. 66:91–106.
1993. View Article : Google Scholar : PubMed/NCBI
|
|
18
|
Siegel AC and Louis KS: Cell viability
analysis using trypan blue: Manual and automated methods. Methods
Mol Biol. 740:7–12. 2011. View Article : Google Scholar : PubMed/NCBI
|
|
19
|
Mizoguchi H, O'Shea JJ, Longo DL, Loeffler
CM, McVicar DW and Ochoa AC: Alterations in signal transduction
molecules in T lymphocytes from tumor-bearing mice. Science.
258:1795–1798. 1992. View Article : Google Scholar : PubMed/NCBI
|
|
20
|
Travis J: Do tumor-altered T cells depress
immune responses? Science. 258:1732–1733. 1992. View Article : Google Scholar : PubMed/NCBI
|
|
21
|
Maecker HT and Trotter J: Flow cytometry
controls, instrument setup, and the determination of positivity.
Cytometry A. 69:1037–1042. 2006. View Article : Google Scholar : PubMed/NCBI
|