Introduction
The epithelial-to-mesenchymal transition (EMT) is a
central molecular mechanism that is known to be involved in a wide
range of physiological and pathophysiological processes. In cancer,
EMT is crucial in the development of metastases (1) as it induces the transformation of
carcinoma cells into mesenchymal cells. This process is accompanied
by changes in cell morphology and structure, altered signaling
pathways, and increased cell migration and invasiveness (2).
EMT is associated with structural changes, which
comprise downregulation of epithelial markers (such as E-cadherin)
and upregulation of mesenchymal markers (such as vimentin,
N-cadherin or smooth-muscle actin). Transcription factors,
including Twist, Snail1 and Slug, are upregulated in parallel,
reflecting the implementation of the epithelial-to-mesenchymal
transition (3,4). Among the various signaling pathways
involved in EMT and metastatic spread, the transforming growth
factor β (TGFβ) pathway has been demonstrated to serve a key role
(5). It has been established that
TGFβ activates mesenchymal transformation, and TGFβ has also been
identified as a crucial cytokine involved in tumor-related
features, such as cell invasion and intercellular communication
within the cancer microenvironment. Among other effects, TGFβ
activates the SMAD2/3 cascade, causing a subsequent upregulation of
transcription factors that finally results in mesenchymal
transformation (4,6). Due to its involvement in the complex
tumor-stroma interaction, EMT may be a central target for novel
anti-metastatic therapeutic approaches.
Recent studies have demonstrated that cancer cell
growth is affected by the antidiabetic agent metformin (7), which has been shown to reduce the risk
of cancer in patients with diabetes type 2 (8). A number of pathways may represent
potential targets for the anticancer effects of metformin (9). Recent investigation has indicated that
metformin is able to inhibit EMT (10). Additionally, in endometrial cancer
cell lines, metformin is able to reduce the potential for cell
migration (11).
Salinomycin is a polyether ionophore that was
originally used as an antibiotic to prevent infectious diseases in
poultries (12). Recently, cytotoxic
effects of this drug on human neoplastic cells have been
demonstrated in various types of cancer (13–16). These
cytotoxic effects are partially caused by the killing of human
cancer stem cells (13,14) based on various molecular interactions,
including the downregulation of the expression of oncogenes such as
MYC and ERG (17). In addition to its
effect on stem cells, salinomycin inhibits cancer cell migration
(17).
The experimental approach used in the present study,
using NSCLC cell lines, is based on the hypothesis that TGFβ is
able to induce EMT in NSCLC cell lines, causing a phenotypical
transformation of epithelial cancer cells into EMT-transformed
mesenchymal-like cells, with a subsequent increase in migration
ability. Furthermore, we hypothesized that the simultaneous
treatment of NSCLC cells with TGFβ and metformin or salinomycin may
inhibit EMT. Western blot analyses were performed to detect changes
in epithelial and mesenchymal markers following treatment of NSCLC
cell lines with TGFβ in combination with metformin or salinomycin.
A cell migration assay was conducted to analyze the invasive
capacity of transformed vs. non-transformed cells, and an MTS assay
was performed to examine relevant sublethal doses of metformin and
salinomycin for these experiments.
Materials and methods
Cell lines & reagents
The A549 human NSCLC cell line (#ACC-107) was
purchased from Deutsche Sammlung von Mikroorganismen und
Zellkulturen GmbH (DSMZ; Braunschweig, Germany), and the HCC4006
human NSCLC cell line (#CRL-2871) was purchased from the American
Type Culture Collection (ATCC-LGC; Wesel, Germany). The two cell
lines were cultured in Dulbecco's modified Eagle's medium (DMEM)
with low glucose (GE Healthcare Life Sciences, Vienna, Austria),
supplemented with 10% fetal calf serum (FCS; Sigma-Aldrich, Munich,
Germany) and 100 U/ml penicillin, 100 µg/ml streptomycin and 2 mM
L-glutamine (PAA Laboratories; GE Healthcare Life Sciences). The
cells were cultivated in cell culture flasks (Falcon®;
Becton-Dickinson Austria GmbH, Schwechat, Austria) at 37°C in an
atmosphere of 5% CO2 until the desired cell confluence
for further experiments was reached.
TGFβ was obtained from R&D Systems (Vienna,
Austria) and prepared according to the manufacturer's
recommendation. Metformin and salinomycin were obtained from
Sigma-Aldrich. The two drugs were dissolved in sterile water and
stored at −20°C until use as aliquots of 100 mM (metformin) and 1
mM (salinomycin).
EMT induction and inhibition
Cells were seeded at a density of 60% (A549) and 80%
(HCC4006) per well to obtain equal cell densities after 48 h.
Following incubation overnight, the cells were stimulated with TGFβ
(10 ng/ml) in starving medium (1% FCS) and subsequently incubated
for 48 h until protein extraction for western blot analyses. For
scratch assays, TGFβ stimulation (10 ng/ml) for 48 h was performed
subsequent to scratching.
To attempt to induce EMT inhibition, metformin at
concentrations of 0.1 mM and 1 mM for A549 cells, and 1 mM and 10
mM for HCC4006 cells, and salinomycin at concentrations of 1 µM and
0.1 µM for both cell lines, were added alone or in combination with
TGFβ for 48 h for western blot analyses and scratch assays.
Determination of metabolic
activity
For growth inhibition studies, an MTS assay was used
(CellTiter 96® AQueous Non-Radioactive Cell Proliferation Assay;
Promega, Madison, WI, USA). Cells were seeded at a concentration of
5,000 cells/well in a 96-well microplate and incubated overnight at
37°C and in an atmosphere of 5% CO2. Fresh medium and
substances in the appropriate concentrations were added and
incubated in the same conditions again for 48 h. Subsequently, 10
µl MTS substrate solution for each 100 µl culture medium per well
was added. The microplates were incubated for 4 h at 37°C and with
5% CO2, before optical density was measured at 490 nm
with a microplate reader (Tecan Infinite® M200 PRO; Tecan Group,
Männerdorf, Switzerland). Untreated cells were used as the control,
adding the same amount of drug-free solvent (distilled water) as in
the highest drug concentration.
Protein extraction and western
blot
For protein extraction, cells were cultivated in
12-well plates at densities of 50,000 cells/well (A549) and 70,000
cells/well (HCC4006) to obtain equal cell densities after 48 h.
After cultivation with the substances as mentioned above, medium
was removed from the culture plates. Cells were then rinsed three
times with phosphate-buffered saline and incubated for 2 h on ice
with 150 µl radioimmunoprecipitation assay buffer containing a
protease inhibitor cocktail (working concentration, 1%; #P8340;
Sigma-Aldrich). Lysate was centrifuged at 15,000 × g for 10 min at
4°C. The total protein concentration was determined by using a
Pierce™ bicinchoninic acid assay Kit (Thermo Fisher Scientific,
Carlsbad, CA, USA) using bovine serum albumin as a standard.
Proteins (30 µg) were electrophoretically separated and blotted
according to standard procedures. Briefly, protein lysate (30 µl
containing 30 µg of total protein) and 6 µl 6X Laemmli buffer
(Bio-Rad Laboratories, Inc., Munich, Germany) were mixed and heated
at 95°C for 5 min. Proteins were separated using a 10% sodium
dodecyl sulfate (SDS)-polyacrylamide gel electrophoresis separation
gel at 180 V for 1 h (running buffer consisted of 1.44% glycine,
0.3% Tris and 0.1% SDS). For western blot analysis, a nylon
membrane (Amersham HybondTM-N+; GE Healthcare Life Sciences, Little
Chalfont, UK) was used and proteins were transferred with transfer
buffer (Novex Tris-Glycine; Invitrogen; Thermo Fisher Scientific)
at 25 V for 90 min at 6°C. Subsequent to blotting, membranes were
washed with washing buffer (0.9% NaCl, 0.6% Tris, 0.1% Tween) and
were then blocked for 1 h at room temperature with a blocking
buffer (washing buffer containing 5% milk powder).
Membranes were incubated with primary antibodies in
blocking buffer at 6°C overnight. Subsequently, membranes were
washed with washing buffer and incubated with the secondary
antibody in blocking buffer at room temperature for 1 h. After
final washing, membranes were treated with ECL Select western
blotting detection reagent (GE Healthcare). Primary antibodies
against human GAPDH (polyclonal rabbit; #G9545; Sigma-Aldrich),
E-cadherin (monoclonal rabbit IgG; #3195) and vimentin (monoclonal
rabbit IgG; #5741), a horseradish peroxidase (HRP)-linked goat
anti-rabbit IgG secondary antibody (#7074) and a HRP-linked goat
anti-biotin antibody (#7075) (all from Cell Signaling Technology,
Cambridge, UK) were used. Primary antibodies were used at a
concentration of 1:2,000, whilst secondary antibody and
biotinylated protein ladder antibody were diluted 1:10,000. Blots
were exposed and documented using the Molecular Imager Gel Doc XR
Systems (Bio-Rad Laboratories, Inc., Boston, MA, USA). Unstimulated
and untreated cells were used as the negative control, whereas
TGFβ-stimulated and untreated cells were used as the positive
control.
Scratch assay
The scratch assay was performed according to a
modified version of the method described by Liang et al
(18). Cells were seeded in 12-well
culture plates with low-glucose DMEM supplemented with 10% FCS and
cultivated until subconfluence. Subsequently, cells were starved in
standard low-glucose DMEM with reduced FCS (1%) for 24 h. On the
following day, the cell monolayer was scraped with a 200 µl pipette
tip held at an angle of 45°. Culture plates were then washed twice
with low-glucose DMEM containing 1% FCS, and 500 µl of this medium
was then added per well.
Following this procedure, the first image of each
well was captured. According to the current experimental approach,
cells were treated with or without TGFβ, metformin and/or
salinomycin in starving medium as described, and were incubated for
48 h. Following this incubation, the second images were taken from
the exact same location as the first picture for each well.
The free area of the scratch of each picture was
measured using ImageJ (v1.44; National Institutes of Health,
Bethesda, MD, USA). The first and second images of each well were
compared and the difference of the free area was calculated.
Unstimulated and untreated cells were used as the negative control,
whereas TGFβ-stimulated and untreated cells were used as the
positive control.
Statistical analysis
For the dose-response curves and the quantitative
analyses of the scratch assays, the mean value and the standard
error of the mean are presented. The data were analyzed by the
Mann-Whitney U test and P<0.05 was considered to indicate a
statistically significant difference.
Results
Determination of drug
concentration
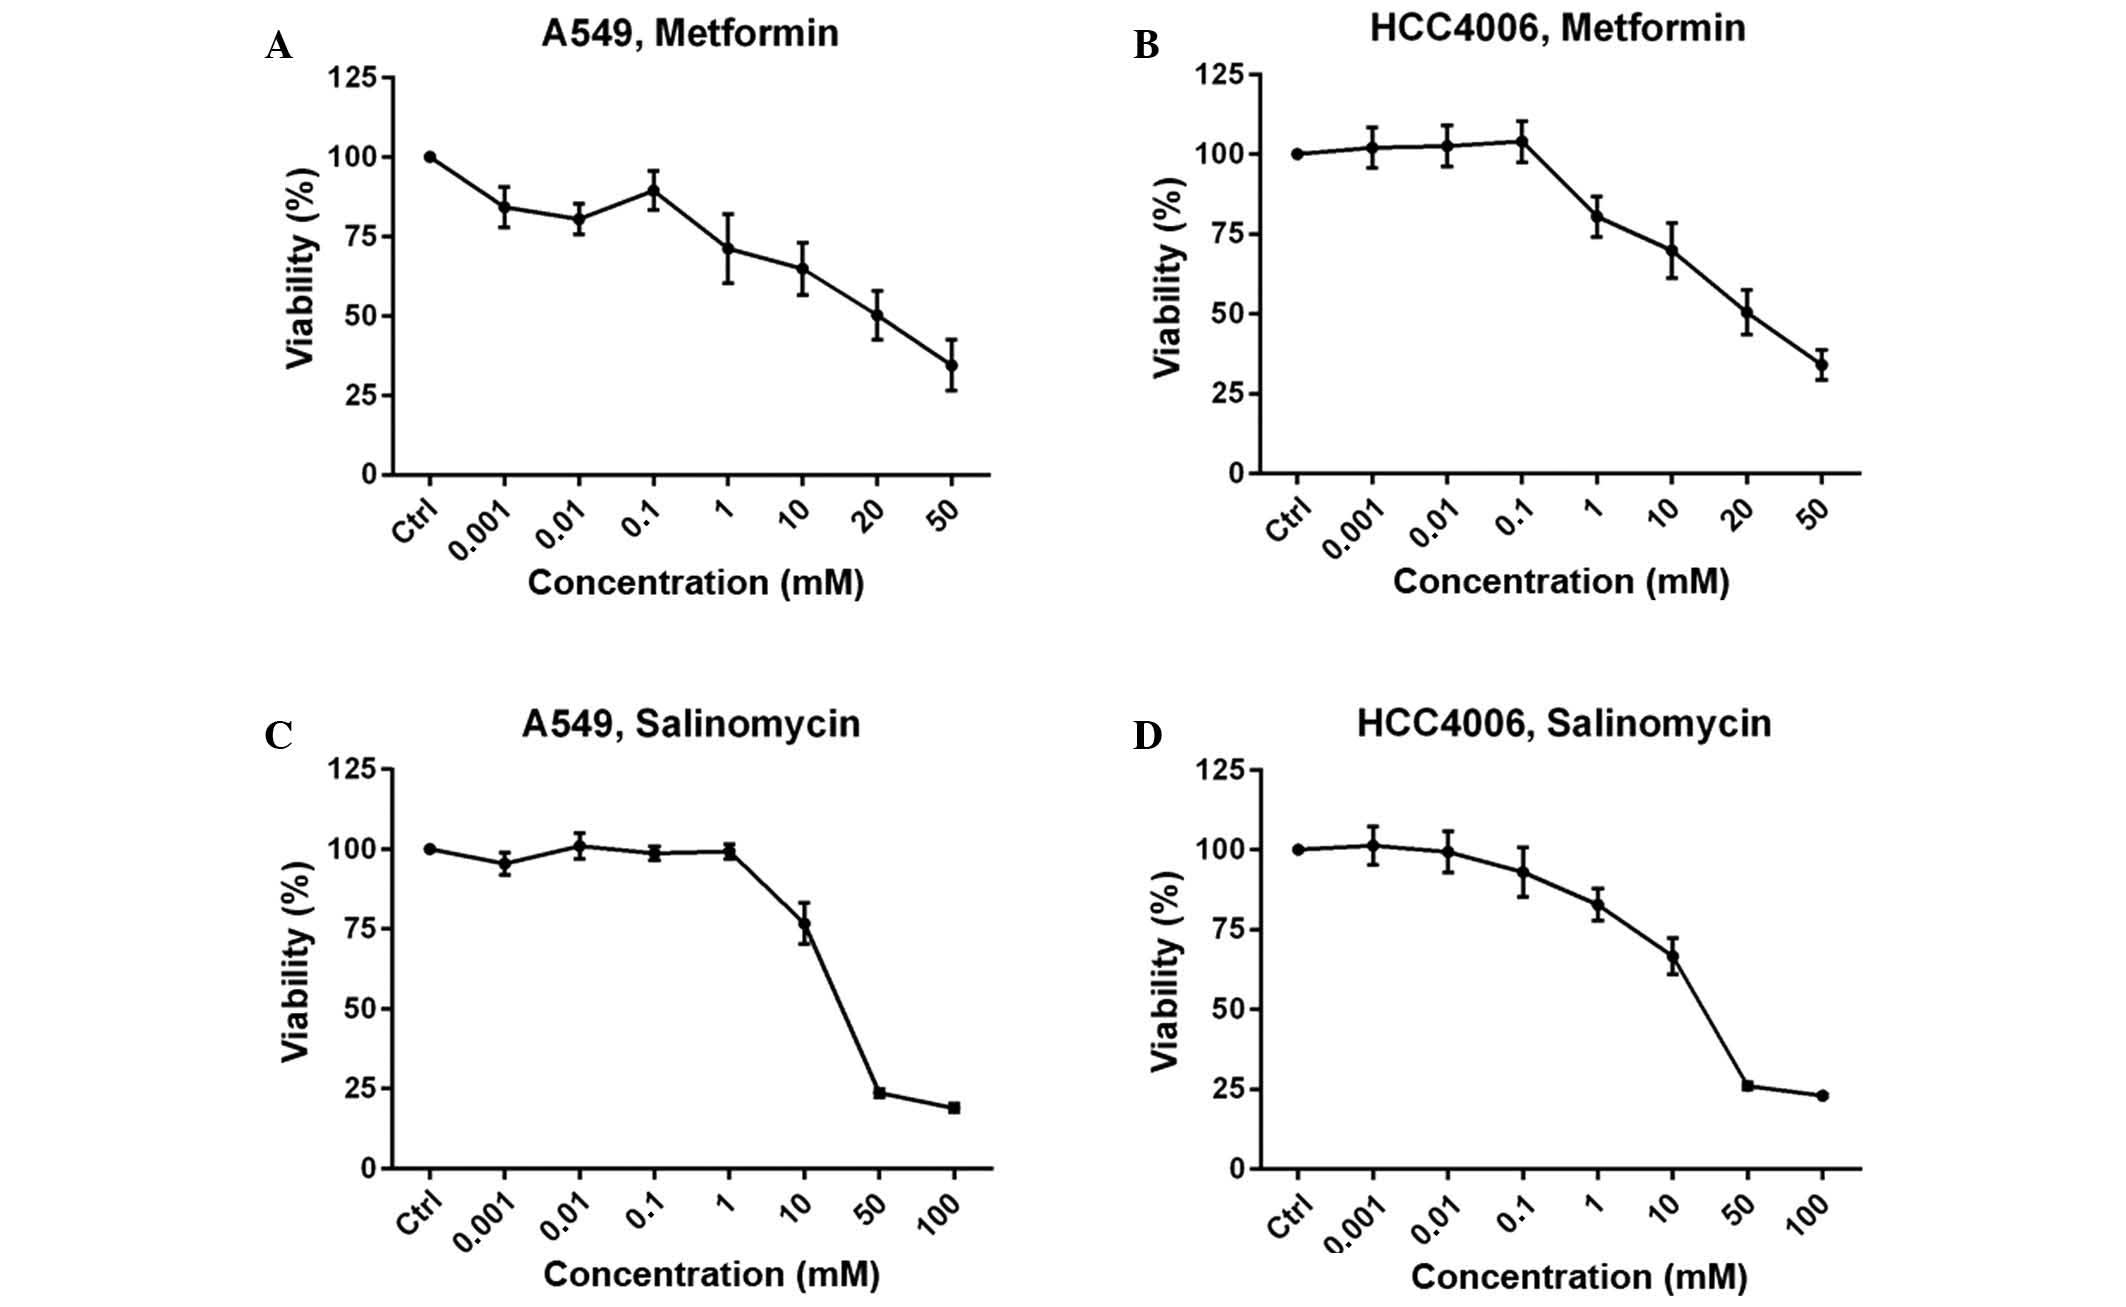
The MTS assay was performed to determine the drug
concentration of metformin and salinomycin for use in the western
blot and migration analyses. Growth inhibition is expressed as the
percentage of the absorbance values of the untreated control group.
The two cell lines yielded a concentration-dependent dose-response
curve. Two concentrations that produced >70% growth inhibition
were selected for further experiments to guarantee the use of
sublethal doses. For metformin, 0.1 mM and 1 mM concentrations were
used for the A549 cell line (Fig.
1A), and 1 and 10 mM were used for the HCC4006 cells (Fig. 1B). For salinomycin, 0.1 µM and 1 µM
were selected as the concentrations for further experiments for
both cell lines (Fig. 1C and D).
Expression of EMT markers
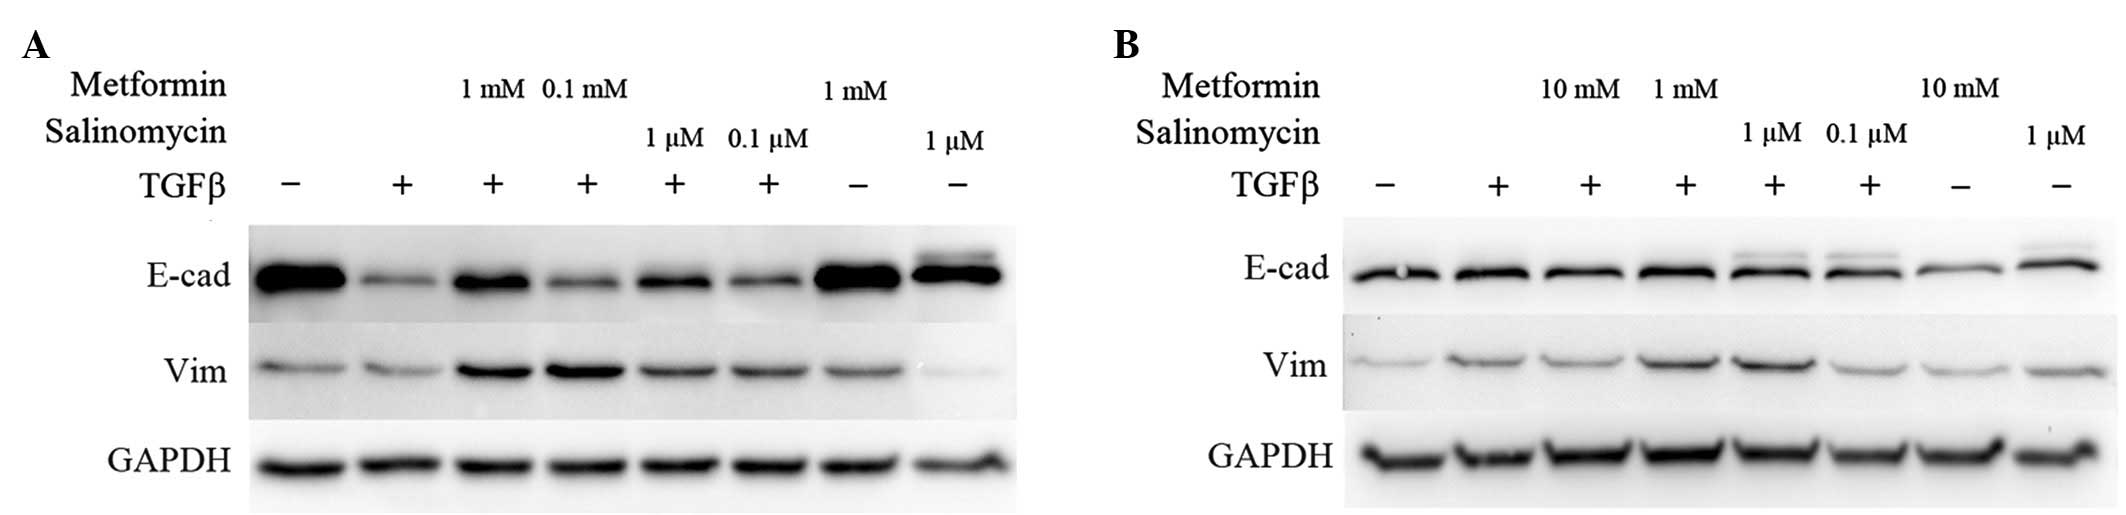
Western blot analyses were performed to analyze the
expression of EMT-specific proteins. E-cadherin expression
represents an epithelial phenotype while vimentin was chosen as an
indicator for a mesenchymal phenotype (3). Unstimulated cells with or without the
higher dose of metformin or salinomycin treatment for 48 h were
compared to TGFβ-stimulated cells that were simultaneously
incubated with metformin or salinomycin for 48 h.
In untreated A549 cells, strong E-cadherin
expression was detected, whereas vimentin was barely expressed. The
application of 1 mM metformin or 1 µM salinomycin caused no
modification in E-cadherin expression, while a slight
downregulation of vimentin in salinomycin treated cells was
observed (Fig. 2A).
In TGFβ-stimulated A549 cells, a downregulation of
E-cadherin was detected. Stimulated cells that were treated with 1
mM metformin exhibited marked upregulation of E-cadherin
expression, and slight vimentin upregulation compared with
untreated TGFβ-stimulated cells (Fig.
2A). Treatment of TGFβ-stimulated A549 cells with 0.1 mM
metformin induced a slight upregulation of E-cadherin and vimentin.
TGFβ-stimulated A549 cells treated with 1 µM salinomycin
demonstrated an increase in E-cadherin expression compared with
untreated TGFβ-stimulated cells. In addition, the expression of
vimentin was also upregulated. The addition of 0.1 µM salinomycin
led to a marginal increase in E-cadherin and vimentin expression in
comparison to untreated TGFβ-stimulated A549 cells (Fig. 2A).
Untreated and unstimulated HCC4006 cells exhibited
strong expression of E-cadherin, while vimentin was weakly
expressed. Treatment with 10 mM metformin caused no distinct
alteration of the expression of E-cadherin and vimentin. The
application of 1 µM salinomycin decreased the E-cadherin
expression, but marginally enhanced vimentin expression (Fig. 2B).
Stimulation of HCC4006 cells with TGFβ resulted in
an upregulation of vimentin; however, no difference in E-cadherin
expression in comparison to untreated cells was observed (Fig. 2B). Treatment of TGFβ-stimulated cells
with 10 mM metformin had no effect on E-cadherin expression, but
caused a downregulation of vimentin compared to untreated
TGFβ-stimulated cells. Application of 1 mM metformin led to a
marginal upregulation of vimentin in comparison to untreated
TGFβ-stimulated cells (Fig. 2B).
Treatment of TGFβ-stimulated HCC4006 cells with 1 µM salinomycin
resulted in an enhancement of vimentin expression and an unaffected
E-cadherin status. Application of 0.1 µM salinomycin caused
TGFβ-stimulated cells to downregulate their vimentin expression to
the level of untreated cells (Fig.
2B).
Inhibition of EMT mediated cell
migration
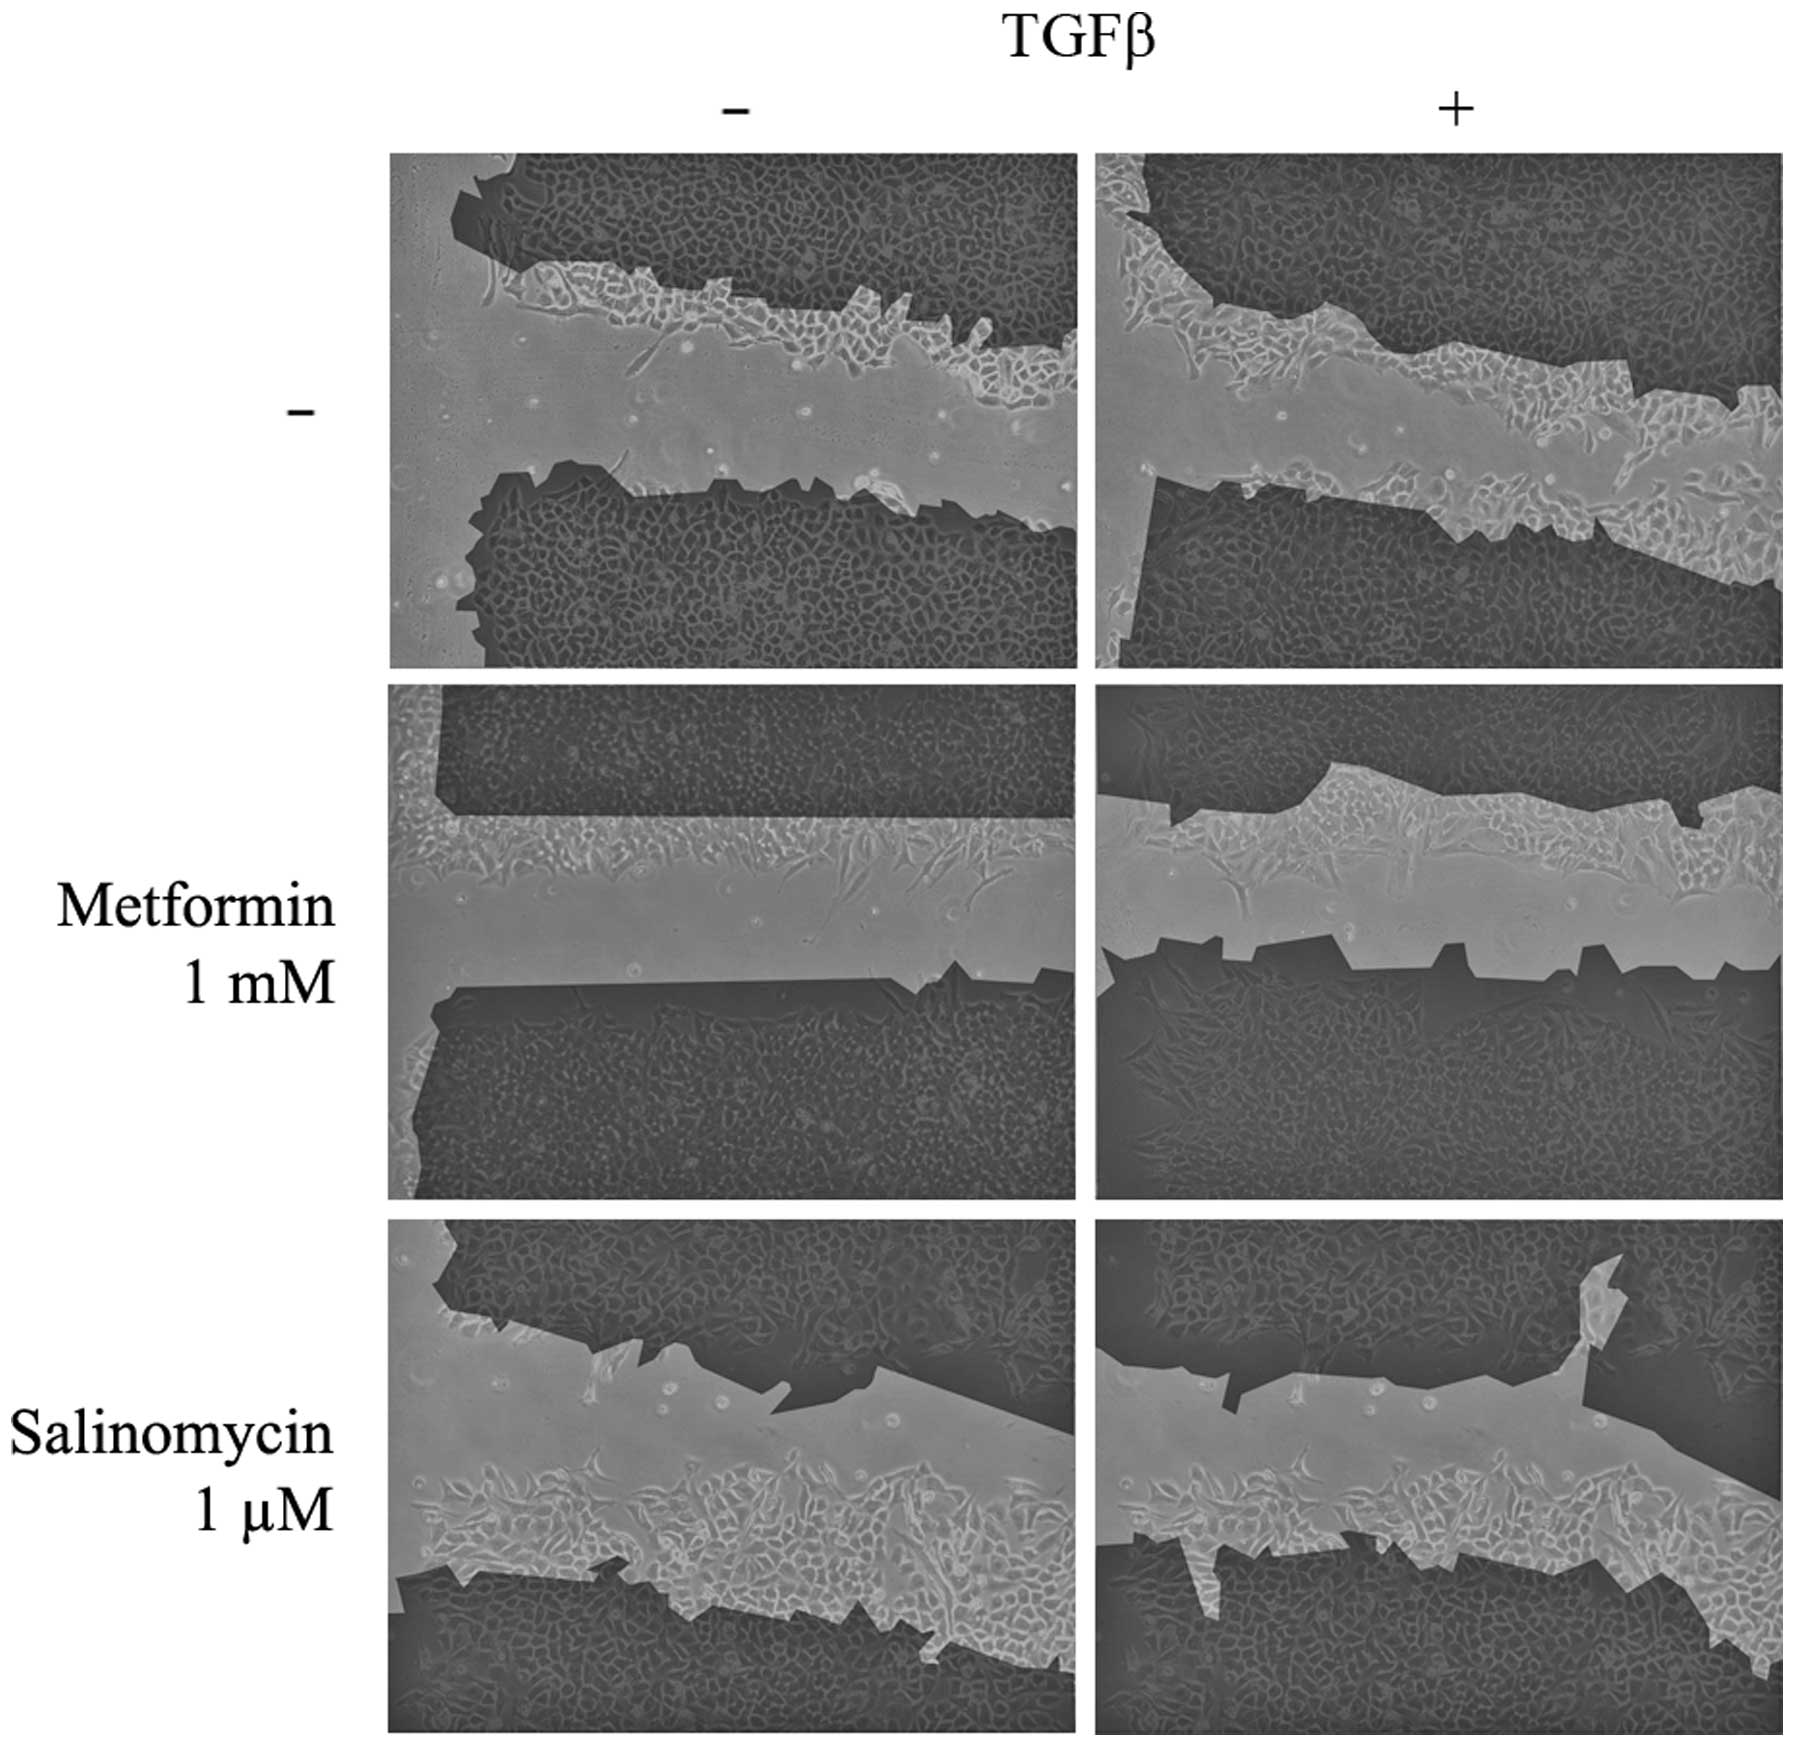
Scratch assays were performed to analyze the
functional effects of EMT and its possible inhibition. Untreated
and unstimulated (control) A549 cells barely migrated into the
unoccupied area of the scratch. Unstimulated cells treated with 1
µM salinomycin demonstrated a similar migration rate to the control
(P=0.786), whereas treatment with 1 mM metformin resulted in a
slight but significant (P=0.036) inhibition of migration (Figs. 3 and 4A).
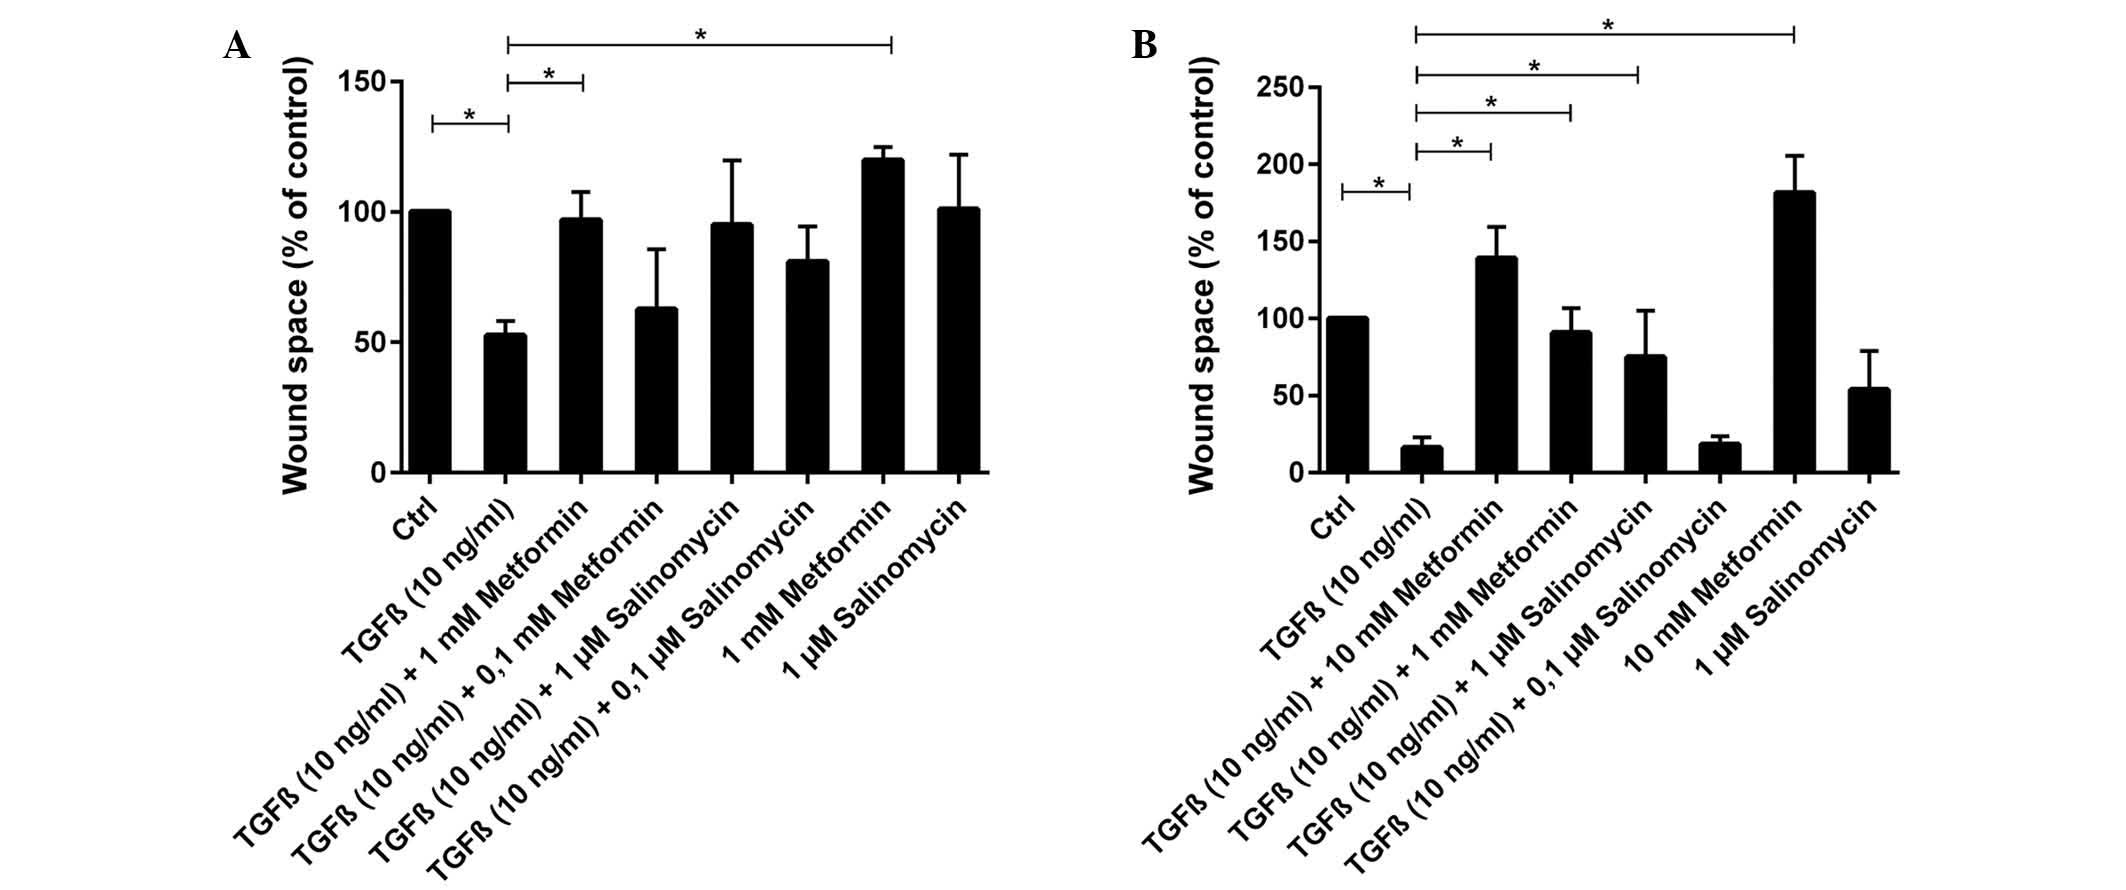
In contrast to unstimulated cells, TGFβ-stimulated
A549 cells exhibited a high migration rate and the scratch area was
significantly reduced to 53% of the control group (P=0.004;
Figs. 3 and 4A). TGFβ-stimulated cells that were treated
simultaneously with metformin had a strongly reduced migration rate
compared with untreated TGFβ-stimulated cells. Treatment with 1 mM
metformin induced complete inhibition of migration (P=0.024),
whilst 0.1 mM metformin led to a slight but non-significant
reduction (P=0.905; Fig. 4A).
Treatment with the two concentrations of salinomycin, 1 and 0.1 µM,
also resulted in a non-significant reduction of migration compared
with untreated TGFβ-stimulated cells (1 µM, P=0.381; 0.1 µM,
P=0.167; Figs. 3 and 4A). In A549 cells treated with 1 µM
salinomycin, 95% of the scratched area, relative to the control
group, remained free of cells, whilst 0.1 µM salinomycin resulted
in a free area of 81%.
Untreated and unstimulated HCC4006 cells exhibited
slight migratory activity (Fig. 4B).
However, treatment of unstimulated cells with 10 mM metformin
induced a nearly complete inhibition of migration (P=0.048), with
an increase of the free area to 182% of the control (Fig. 4B). When unstimulated HCC4006 cells
were treated with 1 µM salinomycin, 54% of the scratched area
remained free relative to the control group (P=0.167; Fig. 4B).
Migration increased significantly under TGFβ
stimulation (P=0.004), with the scratched area free from migrated
cells decreasing to 16% of the control area (Fig. 4B). HCC4006 cells that were
simultaneously treated with TGFβ and 10 mM metformin exhibited a
significant reduction in migration (Fig.
4B), with the free area reaching 139% relative to the control
group (P=0.036, compared to TGFβ stimulated cells). The addition of
1 mM metformin to TGFβ-stimulated cells also caused a significant
decrease in migration compared with untreated TGFβ-stimulated cells
(P=0.036; Fig. 4B). Addition of 1 µM
salinomycin to unstimulated cells caused a moderate migration
inhibition, with 75% of the scratch remaining free (P=0.071;
Fig. 4B). Treatment of
TGFβ-stimulated cells with 0.1 µM salinomycin did not effect a
decrease of migration compared with untreated TGFβ-stimulated
cells, and 18% of the scratched area remained free from migrated
cells (P=0.786).
Discussion
EMT is a crucial mechanism in the process of
metastatic tumor spread. Invasiveness and migration in cancer cells
are essential requirements for metastatic growth and may be
modified by altering the cellular mechanisms that are regulated by
EMT (19,20). The TGFβ-triggered signaling cascade
reflects a critical pathway for EMT induction in a number of
pathophysiological processes, including lung and myocardial
fibrosis (21,22) or cancer growth (23). The crucial role of EMT has recently
been identified to in the context of the mechanism of metastatic
tumour spread (24). Therefore, EMT
pathways represent potential new targets for inhibition of tumor
progression. As metformin and salinomycin have been previously
demonstrated to inhibit EMT (10,16), these
substances were selected for investigation in the current in
vitro studies. Two different epithelial NSCLC cell lines, A549
and HCC4006, were used for the investigations.
The results demonstrated that metformin is able to
inhibit TGFβ-related EMT in A549 and HCC4006 cells, resulting in a
persisting epithelial phenotype and reduced cell migration.
Furthermore, these data provide evidence that metformin inhibits
EMT when used at sublethal doses, suggesting that it inhibits
cellular signalling pathways rather than killing EMT transformed
cells.
Metformin also inhibits cell migration in
differentiated epithelial cancer cells, as indicated by the
decreased cell migration observed in non-EMT transformed cells
following the application of metformin. The effect of metformin on
non-EMT transformed cells is observed more distinctly in HCC4006
cells than in A549 cells. While recent publications provide
evidence for the EMT-inhibitory potential of metformin (10,25,26), the
current data also demonstrate, for the first time, the
metformin-dependent inhibition of cell migration in differentiated
epithelial cancer cells.
In the current study, salinomycin was seen to
inhibit the EMT-inducing effect of TGFβ when used at the lower
dose, while the higher dose further enhanced the mesenchymal
phenotype in HCC4006 cells. In A549 and HCC4006 cells, cell
migration was decreased. Although evidence for EMT-inhibitory
effects of salinomycin exists (16),
other literature also confirms the current data suggesting that
escalating doses of salinomycin correlate with an upregulation of
vimentin and downregulation of E-cadherin (27). These findings may be explained by a
possible non-correspondence between EMT and certain cell abilities,
such as invasion, in these cell lines (27). In EMT-transformed A549 cells treated
with salinomycin, the present investigations of protein expression
and migration revealed different results compared to those for
HCC4006 cells. Although cell migration in A549 cells is more
strongly inhibited by the higher dose of salinomycin, both vimentin
and E-cadherin are upregulated. This divergent effect in the two
cell lines may have two explanations. Firstly, salinomycin may
inhibit cell migration and influence TGFβ-related EMT by
interfering with different signalling pathways. Alternatively,
established epithelial and mesenchymal markers like E-cadherin and
vimentin may not be adequate to analyze the effects of salinomycin
on EMT-transformed cells. Further studies must be performed to
elucidate the exact mechanisms of salinomycin treatment on EMT.
In summary, the present study provides evidence that
metformin and salinomycin have the potential to specifically block
TGFβ-induced EMT in NSCLC and inhibit EMT-induced cell migration in
NSCLC cell lines. To the best of our knowledge, these results
highlight for the first time that these two substances are
effective EMT-inhibiting agents in NSCLC. To what extent such
strategies may be transferred to the clinic remains to be analyzed
in further investigations.
References
|
1
|
Iwatsuki M, Mimori K, Yokobori T, Ishi H,
Beppu T, Nakamori S, Baba H and Mori M: Epithelial-mesenchymal
transition in cancer development and its clinical significance.
Cancer Sci. 101:293–299. 2010. View Article : Google Scholar : PubMed/NCBI
|
|
2
|
Tsai JH and Yang J: Epithelial-mesenchymal
plasticity in carcinoma metastasis. Genes Dev. 27:2192–2206. 2013.
View Article : Google Scholar : PubMed/NCBI
|
|
3
|
Thiery JP and Sleeman JP: Complex networks
orchestrate epithelial-mesenchymal transitions. Nat Rev Mol Cell
Biol. 7:131–142. 2006. View
Article : Google Scholar : PubMed/NCBI
|
|
4
|
Medici D, Hay ED and Olsen BR: Snail and
Slug promote epithelial-mesenchymal transition through
beta-catenin-T-cell factor-4-dependent expression of transforming
growth factor-beta3. Mol Biol Cell. 19:4875–4887. 2008. View Article : Google Scholar : PubMed/NCBI
|
|
5
|
Xu J, Lamouille S and Derynck R:
TGF-beta-induced epithelial to mesenchymal transition. Cell Res.
19:156–172. 2009. View Article : Google Scholar : PubMed/NCBI
|
|
6
|
Moustakas A: Smad signalling network. J
Cell Sci. 115:3355–3356. 2002.PubMed/NCBI
|
|
7
|
Dowling RJ, Niraula S, Stambolic V and
Goodwin PJ: Metformin in cancer: Translational challenges. J Mol
Endocrinol. 48:R31–R43. 2012. View Article : Google Scholar : PubMed/NCBI
|
|
8
|
Evans JM, Donnelly LA, Emslie-Smith AM,
Alessi DR and Morris AD: Metformin and reduced risk of cancer in
diabetic patients. BMJ. 330:1304–1305. 2005. View Article : Google Scholar : PubMed/NCBI
|
|
9
|
Kourelis TV and Siegel RD: Metformin and
cancer: New applications for an old drug. Med Oncol. 29:1314–1327.
2012. View Article : Google Scholar : PubMed/NCBI
|
|
10
|
Cufi S, Vazquez-Martin A,
Oliveras-Ferraros C, Martin-Castillo B, Joven J and Menendez JA:
Metformin against TGFβ-induced epithelial-to-mesenchymal transition
(EMT): From cancer stem cells to aging-associated fibrosis. Cell
Cycle. 9:4461–4468. 2010. View Article : Google Scholar : PubMed/NCBI
|
|
11
|
Tan BK, Adya R, Chen J, Lehnert H, Cassia
Sant LJ and Randeva HS: Metformin treatment exerts antiinvasive and
antimetastatic effects in human endometrial carcinoma cells. J Clin
Endocrinol Metab. 96:808–816. 2011. View Article : Google Scholar : PubMed/NCBI
|
|
12
|
Naujokat C, Fuchs D and Opelz G:
Salinomycin in cancer: A new mission for an old agent. Mol Med Rep.
3:555–559. 2010. View Article : Google Scholar : PubMed/NCBI
|
|
13
|
Bardsley MR, Horváth VJ, Asuzu DT, Lorincz
A, Redelman D, Hayashi Y, Popko LN, Young DL, Lomberk GA, Urrutia
RA, et al: Kitlow stem cells cause resistance to
Kit/platelet-derived growth factor alpha inhibitors in murine
gastrointestinal stromal tumors. Gastroenterology. 139:942–952.
2010. View Article : Google Scholar : PubMed/NCBI
|
|
14
|
Fuchs D, Daniel V, Sadeghi M, Opelz G and
Naujokat C: Salinomycin overcomes ABC transporter-mediated
multidrug and apoptosis resistance in human leukemia stem cell-like
KG-1a cells. Biochem Biophys Res Commun. 394:1098–1104. 2010.
View Article : Google Scholar : PubMed/NCBI
|
|
15
|
Fuchs D, Heinold A, Opelz G, Daniel V and
Naujokat C: Salinomycin induces apoptosis and overcomes apoptosis
resistance in human cancer cells. Biochem Biophys Res Commun.
390:743–749. 2009. View Article : Google Scholar : PubMed/NCBI
|
|
16
|
Gupta PB, Onder TT, Jiang G, Tao K,
Kuperwasser C, Weinberg RA and Lander ES: Identification of
selective inhibitors of cancer stem cells by high-throughput
screening. Cell. 138:645–659. 2009. View Article : Google Scholar : PubMed/NCBI
|
|
17
|
Ketola K, Hilvo M, Hyötyläinen T, Vuoristo
A, Ruskeepää AL, Orešič M, Kallioniemi O and Iljin K: Salinomycin
inhibits prostate cancer growth and migration via induction of
oxidative stress. Br J Cancer. 106:99–106. 2012. View Article : Google Scholar : PubMed/NCBI
|
|
18
|
Liang CC, Park AY and Guan JL: In
vitro scratch assay: A convenient and inexpensive method for
analysis of cell migration in vitro. Nat Protoc. 2:329–333.
2007. View Article : Google Scholar : PubMed/NCBI
|
|
19
|
De Craene Band Berx G: Regulatory networks
defining EMT during cancer initiation and progression. Nat Rev
Cancer. 13:97–110. 2013. View
Article : Google Scholar : PubMed/NCBI
|
|
20
|
Larue L and Bellacosa A:
Epithelial-mesenchymal transition in development and cancer: Role
of phosphatidylinositol 3′ kinase/AKT pathways. Oncogene.
24:7443–7454. 2005. View Article : Google Scholar : PubMed/NCBI
|
|
21
|
Kuwahara F, Kai H, Tokuda K, Kai M,
Takeshita A, Egashira K and Imaizumi T: Transforming growth
factor-beta function blocking prevents myocardial fibrosis and
diastolic dysfunction in pressure-overloaded rats. Circulation.
106:130–135. 2002. View Article : Google Scholar : PubMed/NCBI
|
|
22
|
Willis BC and Borok Z: TGF-beta-induced
EMT: Mechanisms and implications for fibrotic lung disease. Am J
Physiol Lung Cell Mol Physiol. 293:L525–L534. 2007. View Article : Google Scholar : PubMed/NCBI
|
|
23
|
Heldin CH, Vanlandewijck M and Moustakas
A: Regulation of EMT by TGFβ in cancer. FEBS Lett. 586:1959–1970.
2012. View Article : Google Scholar : PubMed/NCBI
|
|
24
|
Massagué J: TGFbeta in cancer. Cell.
134:215–230. 2008. View Article : Google Scholar : PubMed/NCBI
|
|
25
|
Vazquez-Martin A, Oliveras-Ferraros C,
Cufi S, Del Barco S, Martin-Castillo B and Menendez JA: Metformin
regulates breast cancer stem cell ontogeny by transcriptional
regulation of the epithelial-mesenchymal transition (EMT) status.
Cell Cycle. 9:3807–3814. 2010. View Article : Google Scholar : PubMed/NCBI
|
|
26
|
Zhao Z, Cheng X, Wang Y, Han R, Li L,
Xiang T, He L, Long H, Zhu B and He Y: Metformin inhibits the
IL-6-induced epithelial-mesenchymal transition and lung
adenocarcinoma growth and metastasis. PloS One. 9:e958842014.
View Article : Google Scholar : PubMed/NCBI
|
|
27
|
Kuo SZ, Blair KJ, Rahimy E, Kiang A,
Abhold E, Fan JB, Wang-Rodriguez J, Altuna X and Ongkeko WM:
Salinomycin induces cell death and differentiation in head and neck
squamous cell carcinoma stem cells despite activation of
epithelial-mesenchymal transition and Akt. BMC Cancer. 12:5562012.
View Article : Google Scholar : PubMed/NCBI
|