Introduction
Glioma is the most commonly occurring highly
malignant primary brain tumor; however, the molecular pathways
resulting in glioma pathogenesis remain unclear (1). Although major advancements have been
made in the management of malignant gliomas, of which glioblastomas
represent the final grade of malignancy, a poor prognosis remains
characteristic of the tumors (2).
This poor prognosis in malignant gliomas is due to the active
migration of the glioma cells, often over long distances, through
the narrow extracellular spaces in the brain; this makes the cells
elusive targets for effective surgical treatment (2). It has been clinically and experimentally
indicated that invasive malignant glioma cells exhibit a decreased
proliferation rate and a relative apoptotic resistance compared
with the highly cellular tumor center; this contributes to the
resistance of the tumors to conventional pro-apoptotic chemotherapy
and radiotherapy (2). Apoptotic
resistance is a consequence of changes at the transcriptional,
post-transcriptional and genomic level of proteins, protein kinases
and their transcription factor (TF) effectors (2).
TFs and microRNAs (miR/miRNAs) are the two most
characterized gene regulators that have been shown to be
significant in the regulation of genes. However, high throughput
screening is rare for the interaction associations between TFs,
miRNAs and target genes in gliomas (3). TFs promote or suppress the transcription
of genes through binding to the upstream regions of the genes. TFs
regulate the transcription of genes in a direct manner and
occasionally cooperate with other proteins. TFs and miRNAs are
therefore prominent regulators for gene expression (4). miRNAs are small non-coding RNAs that act
as negative gene regulators. Alterations in miRNA expression have
been indicated to be involved in the pathogenesis and development
of the majority of human malignancies (5). miRNAs are involved in numerous
biological processes, including proliferation, differentiation and
apoptosis. miRNAs can also target genes to regulate a number of
different biological processes, thus providing experimentally
validated data for associated databases. The host genes of miRNAs
are the genes that the miRNAs locate to. Parallel transcription of
miRNAs and their host transcripts, and two different
transcriptional miRNA classes (exonic and intronic) have been
identified. Intronic miRNAs and their host genes exhibit close
associations (6).
The present study was centered on the associations
between the elements in glioma, and the associations among these
genes, miRNAs and their host genes were extracted. Three levels of
networks, which were termed the differentially-expressed network,
the related network and the global network were attained. The
global network was constructed to represent all associations.
However, this network was so complex that pathways associated with
glioma could not be clearly found. Therefore, pathways concerning
the differentially-expressed elements and predicted TFs were used
to complete the study, which is of great significance in
distinguishing the key nodes and pathways of glioma.
Materials and methods
Material collection and data
processing
The miRNA and target gene datasets were collected
from DIANA-Tarbase 5.0 (diana.imis.athena-innovation.gr/DianaTools/index.php?r=tarbase/index)
and miRTarBase (mirtarbase.mbc.nctu.edu.tw/). The official symbols
from the National Center for Biotechnology Information (NCBI)
database (ncbi.nlm.nih.gov/gene/) were used in the present
study. This complete data was considered as dataset
F1.
The validated dataset of the TFs and the
corresponding miRNAs regulated by these TFs was collected from
TransmiR (7). This complete data was
considered as dataset F2.
The host gene miRNAs were extracted from miRbase
(8) and the NCBI. Official symbols
and identifications were assigned to each host gene. The complete
data was considered as dataset F3.
The differentially-expressed genes for glioma were
mainly extracted from the Kyoto Encyclopedia of Genes and Genomes
pathway database (www.genome.jp/kegg/pathway.html). The glioma pathway
map was obtained, which shows all the validated mutated glioma
genes. The relevant literature regarding the mutated genes of
glioma was also manually searched. The related genes and pertinent
literature were collected from the GeneCards database (http://www.genecards.org/) (9). Additionally, the popular TFs were
extracted using the P-match method (10). This system combines pattern matching
with weight matrix approaches, and thus provides a higher accuracy
of recognition than each of the methods alone. The TFs were
considered as glioma-related genes and only those that appeared in
transmiR were focused upon. The 1,000-nt (5,000-nt) promoter region
sequences of the targets of the differentially-expressed genes were
downloaded from the University of California Santa Cruz database
(11). The study used the P-match
method, which combines pattern matching and weight matrix
approaches, to identify transcription factor binding sites (TFBSs)
in 1,000-nt promoter region sequences and the TFBSs were mapped
onto the promoter region of the targets. The matrix library of
P-match and the sets of known TFBSs collected in TRANSFAC also
provide the possibility of searching for a large variety of
different TFBSs. The vertebrate matrix and restricted high quality
criterion were used for the matrix. The complete data of
differentially-expressed genes and related genes was considered as
dataset F4.
Differentially-expressed miRNAs were collected from
mir2Disease (12), which is a
manually created database of differentially-expressed miRNAs from
various human diseases. The relevant literature regarding glioma
was also manually searched. The complete differentially-expressed
miRNAs and related miRNAs of glioma were considered as dataset
F5.
Three levels of network
construction
The regulatory associations between target genes,
TFs, host genes and miRNAs were extracted from F1,
F2 and F3. After combining their
associations, the global network was obtained. Separately, the
differentially-expressed elements and related elements were
extracted from F4, and F5, and these were
mapped onto the global network. After combining these associations,
the differentially-expressed network and the related network were
obtained.
Results and Discussion
Differentially-expressed network of
gliomas
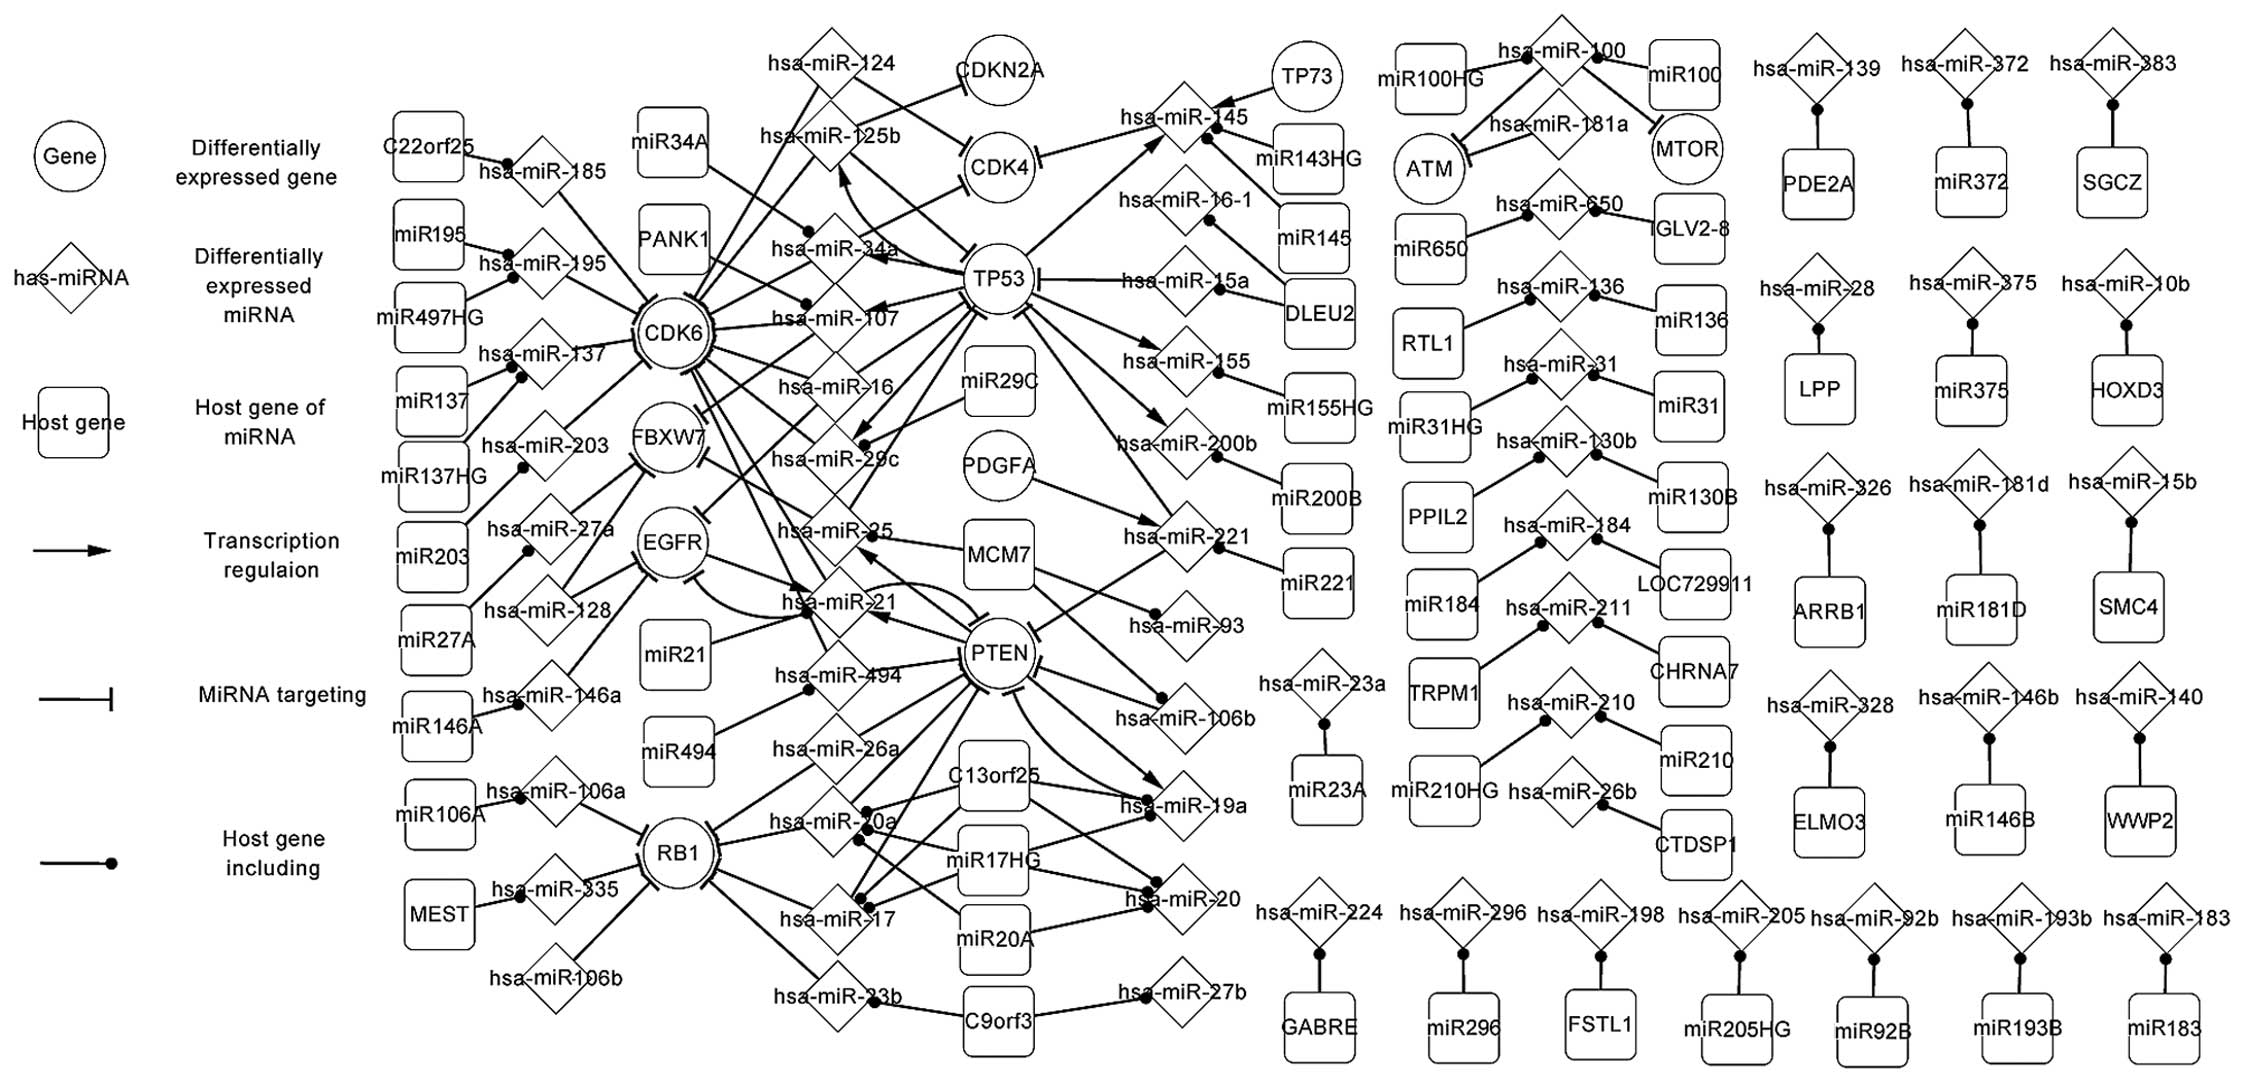
Fig. 1 shows the
significant regulatory pathways of glioma in the
differentially-expressed network, which is composed of 5 TFs (PTEN,
TP53, EGFR, PDGFA and TP73), target genes of miRNAs, miRNAs and
their host genes. The elements were all differentially expressed,
with the exception of the host genes.
In Fig. 1, a number of
the specific features of TFs and miRNAs are highlighted. It can be
observed that a TF can regulate one or more miRNAs, and that a
target gene can be targeted by one or more miRNAs. Therefore, the
host genes and target genes, the host genes and TFs, and the target
genes and TFs exhibit an indirect affect on each other via the
miRNAs. The association also exists between TFs and TFs, target
genes and target genes, host genes and host genes. For example,
PTEN regulates hsa-miR-21 and hsa-miR-25, which separately target
EGFR and FBXW7. This association indicates that PTEN indirectly
affects EGFR and FBXW7 by hsa-miR-21 and hsa-miR-25. In the same
way, TP53 regulates hsa-miR-29c, hsa-miR-107, hsa-miR-34a and
hsa-miR-125b, which all target CDK6, indicating that TP53
indirectly affects CDK6 by hsa-miR-29c, hsa-miR-107, hsa-miR-34a
and hsa-miR-125b. Also, certain self-adaption associations (an
miRNA is regulated by the TFs that it targets) between PTEN and
hsa-miR-21, PTEN and hsa-miR-19a, TP53 and hsa-miR-125b, and EGFR
and hsa-miR-21 were revealed.
Mutations were found in TP53 at 76.5% and in PTEN at
73.5%. This was considered to represent a high incidence of
alterations in the cellular pathways (13). The present study highlights the
significance of the development of therapeutic approaches that are
viable in tumors with a wide range of genetic alterations, and
provides an panel of glioma cell lines to enable this.
The features of the miRNAs and their host genes are
also highlighted in Fig. 1. For
example, C13orf25 includes hsa-miR-17 and hsa-miR-19a, which
separately target RB1 and PTEN. Also, an miRNA may be located in
one or several genes. For example, hsa-miR-195 is located in MIR195
and MIR497HG. The differentially-expressed network partly
demonstrated the regulatory mechanism of glioma.
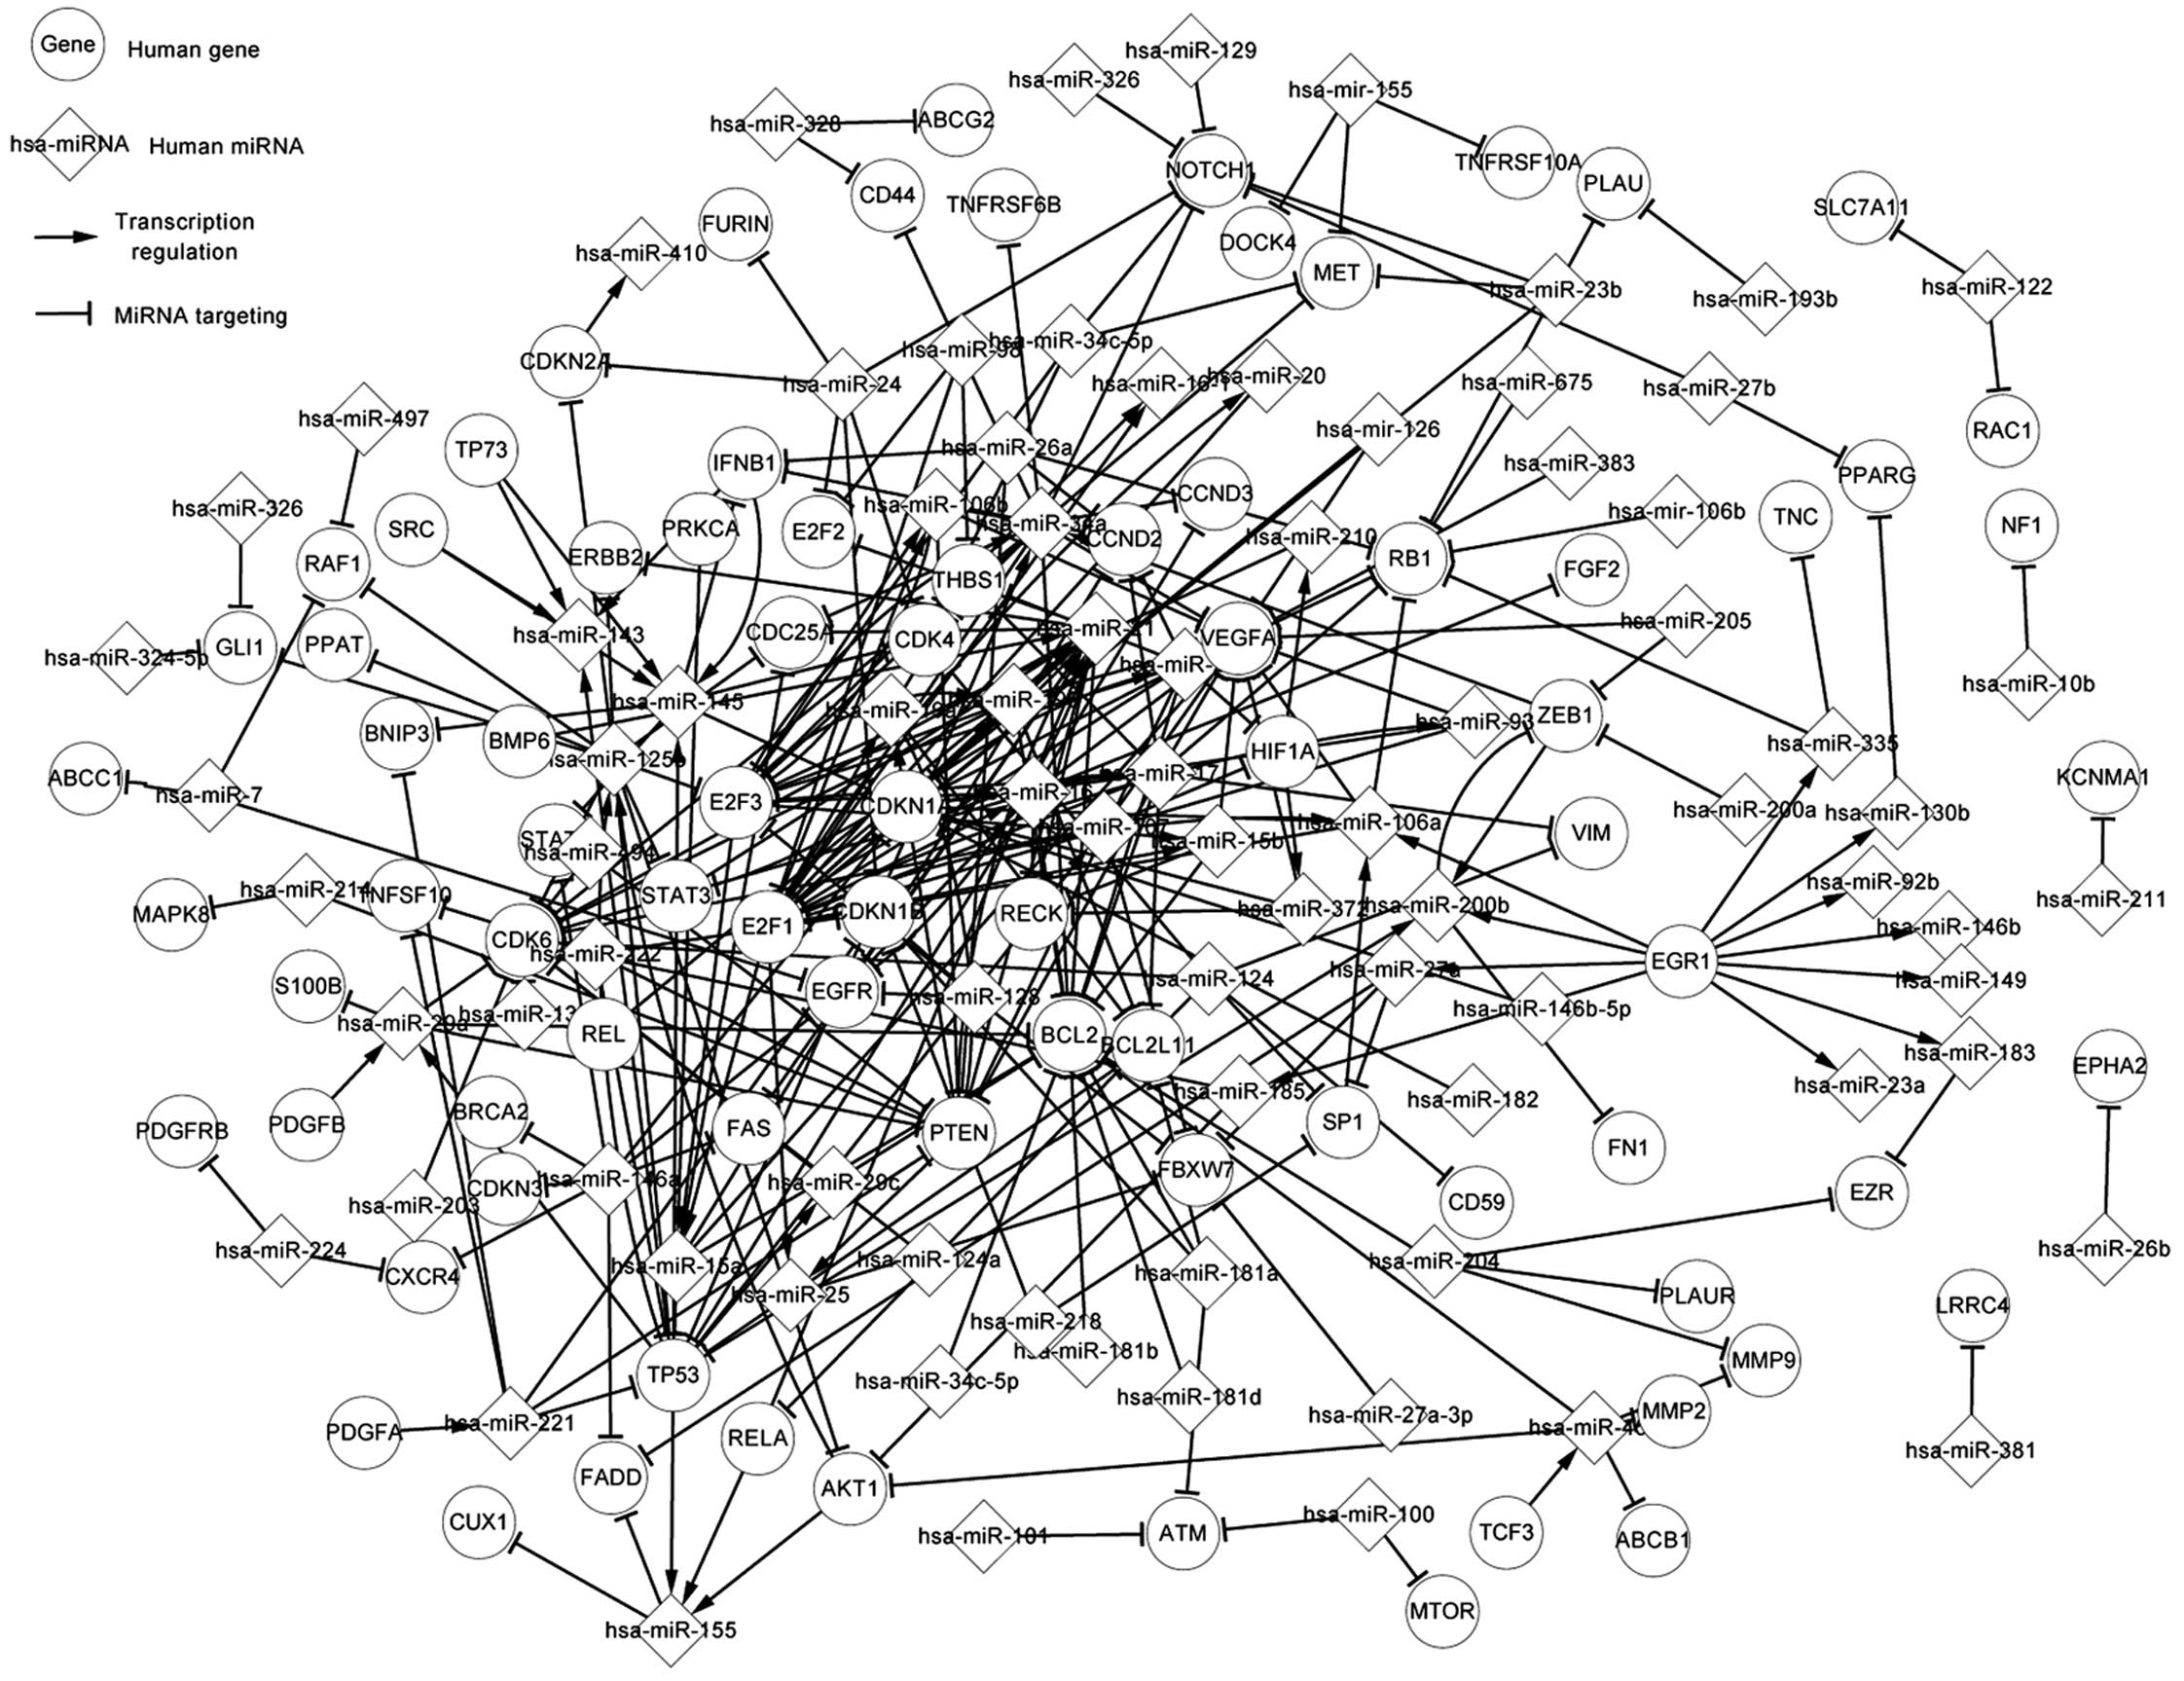
Related network of gliomas
The related network is composed of
differentially-expressed genes and miRNAs, related genes and
miRNAs, and targets of miRNAs and host genes of miRNAs. So, the
related network contains the differentially-expressed network.
Fig. 2 shows 22 TFs, consisting of 5
differentially-expressed TFs and 17 related TFs in glioma. Apart
from the differentially-expressed miRNAs, 20 related miRNAs are
shown. There are numerous additional pathways. For instance, AKT1,
RELA and TP53 regulate hsa-miR-155, which targets CUX1 and FADD.
PDGFA regulates hsa-miR-221, which targets TP53. E2F1 and E2F3
regulate hsa-miR-15a, which targets TP53, and E2F1 and PTEN
regulate hsa-miR-25, which targets TP53.
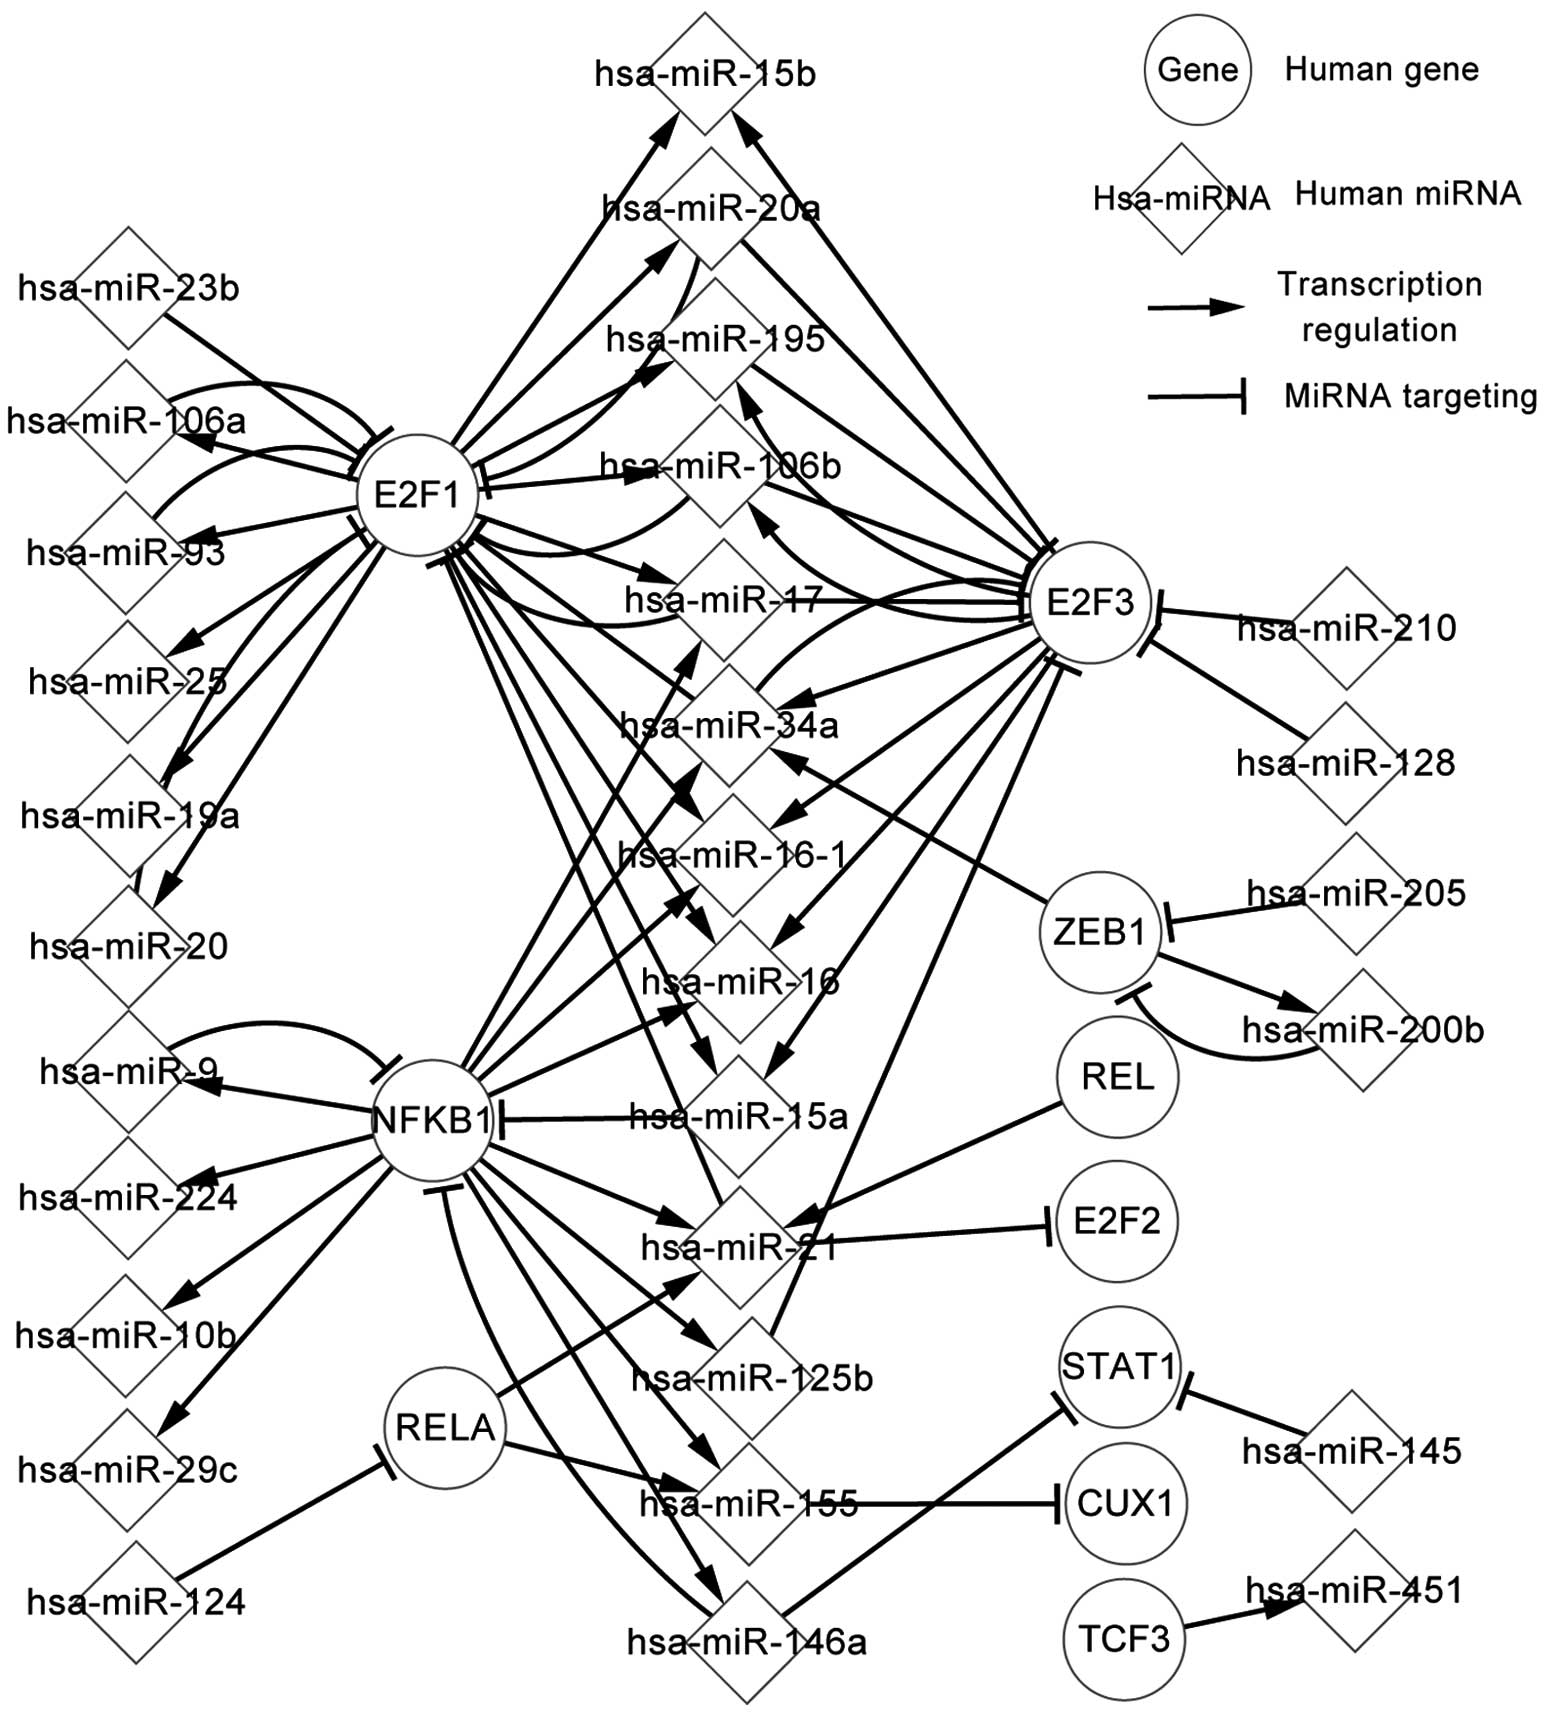
Transcriptional network of TFs and
differentially-expressed miRNAs
In total, 24 differentially-expressed miRNAs, which
were regulated by predicted TFs, were analyzed further. Fig. 3 presents the regulatory associations
of the predicted TFs and miRNAs in glioma. These elements have an
affect on their successors by targeting or regulating them.
Fig. 3 demonstrates that REL, RELA
and NFRB1 regulate hsa-miR-21, which targets E2F2 and E2F1. It is
also possible to conclude the following: One miRNA may target a
number of TFs; for example, hsa-miR-106b targets E2F1and E2F3. A TF
may regulate several miRNAs; for example, E2F1 regulates
hsa-miR-106a, hsa-miR-106b and hsa-miR-93. A TF indirectly affects
other TFs by a number of miRNAs, and a miRNA indirectly affects
other miRNAs by TFs; for example, RELA indirectly regulates CUX1 by
hsa-miR-155 and hsa-miR-205 indirectly affects hsa-miR-34a by ZEB1.
Certain self-adaption associations also exist between E2F1and
hsa-miR-20 (hsa-miR-93, hsa-miR-19a, hsa-miR-20a, hsa-miR-17 or
hsa-miR-106b). The transcription network of predicted TFs and
miRNAs can therefore contribute to the study of glioma
pathogenesis.
Global network of gliomas
The global network of gliomas is an experimentally
validated biological network in the human body. It consists of
additional TFs, targets, miRNAs and host genes of miRNA compared
with the related network. The global network shows more
comprehensive regulatory associations, such as those in
F1, F2 and F3, and includes the
differentially-expressed network and the related network.
Comparison and analysis of the
features of the differentially-expressed genes
All pathways of the differentially-expressed
elements (genes and miRNAs) were extracted, analyzed and compared.
For the differentially-expressed genes (apart from the
differentially-expressed genes that did not have adjacency nodes),
the interacting features of every gene were compared and analyzed
by the distribution of the adjacency nodes in the three levels of
network. For TFs, it was concluded that 4 types of TFs exist. For
genes that do not regulate miRNAs, 3 types of genes were found.
The study first focused on the TFs. The first class
of TFs, including TP53, PTEN and EGFR, has 6 types of adjacency
node (3 types of successor and 3 types of predecessor). The
following text focuses on PTEN and TP53.
Table I shows that 8
miRNAs target PTEN, and that PTEN regulates 3 miRNAs in the
differentially-expressed network. In total, 11 and 25 miRNAs target
PTEN, and PTEN regulates 3 and 10 miRNAs in the related and global
networks, respectively. It was indicated that 8 miRNAs indirectly
affect the expression of 3 miRNAs by PTEN in the
differentially-expressed network. It was found that hsa-miR-21
targeted PTEN, and that PTEN regulated hsa-miR-21 in 3 networks,
forming a self-adaption association.
 | Table I.Regulatory associations between miRNAs
and PTEN. |
Table I.
Regulatory associations between miRNAs
and PTEN.
| Gene association |
Differentially-expressed network | Related network | Global network |
|---|
| PTEN |
|
|
|
| miRNAs
targeting the gene | miR-106b, miR-17,
miR-19a, miR-20a, miR-21, miR-221, miR-26a, miR-494 | miR-106b, miR-17,
miR-19a, miR-20a, miR-21, miR-214, miR-221, miR-222, miR-26a,
miR-29a, miR-494, miR-216a | miR-106b, miR-141,
miR-17, miR-17–5p miR-18a miR-19a, miR-19b, miR-20a, miR-21,
miR-214, miR-21–5p, miR-217, miR-22, miR-221, miR-221–3p, miR-222,
miR-222–3p, miR-26a, miR-29a, miR-29b-3p, miR-494, miR-519a-3p,
miR-519d, miR-93–5p |
| miRNAs
regulated by the gene | miR-19a, miR-21,
miR-25 | miR-19a, miR-21,
miR-25 | miR-19a, miR-21,
miR-22, miR-25, miR-302, miR-302a, miR-302b, miR-302c, miR-302d,
miR-302f |
miR-21 has previously been shown to be associated
with the proliferation and invasion of glioma. miR-21 is expressed
at a higher level in glioma tissues compared with normal tissues,
indicating that it could be a potential independent marker for
gliomas (14), and thus a possible
therapeutic target for molecular glioma therapy.
TP53 is a notable tumor suppressor and has
significant features in all three levels of network. Table II shows that 5 miRNAs target TP53,
and that TP53 regulates 7 miRNAs in the differentially-expressed
network. A total of 6 and 12 miRNAs target TP53, and TP53 regulates
9 and 25 miRNAs in the related and global networks, respectively.
It was indicated that 5 miRNAs indirectly affect the expression of
7 miRNAs by TP53 in the differentially-expressed network. It was
found that hsa-miR-125b targets TP53, and that TP53 regulates
hsa-miR-125b in all three levels of network, forming a
self-adaption association.
| Table II.Regulatory associations between miRNAs
and TP53. |
Table II.
Regulatory associations between miRNAs
and TP53.
| Gene association |
Differentially-expressed network | Related network | Global network |
|---|
| TP53 |
|
|
|
| miRNAs
targeting the gene | miR-125b, miR-15a,
miR-16, miR-221, miR-25, miR-25 | miR-125b, miR-15a,
miR-16, miR-221, miR-222, miR-16, miR-221, miR-222, miR-25,
miR-30d, miR-380–5p, miR-612 | miR-125a-5p,
miR-125b, miR-125b-5p, miR-1285, miR-15a |
| miRNAs
regulated by the gene | miR-107, miR-125b,
miR-145, miR-155, miR-200b, miR-29c, miR-34a | miR-107, miR-125b,
miR-143, miR-145, miR-155, miR-200b, miR-29a, miR-29c, miR-34a | miR-107, miR-125b,
miR-125b-1, miR-125b-2, miR-143, miR-145, miR-155, miR-192,
miR-194, miR-194–1, miR-194–2, miR-200a, miR-200b, miR-200c,
miR-215, miR-29, miR-29a, miR-29b-1, miR-29b-2, miR-29c, miR-34,
miR-34a, miR-34b, miR-34c, miR-519d |
The second class of TFs, including CDKN2A, has 5
types of adjacency node (2 types of successor and 3 types of
predecessor). A total of 8 miRNAs target CDKN2A, which regulates
has-miR-410, in the related network.
The third class of TFs, including RB1, has 4 types
of adjacency node (3 types of successor and 1 type of predecessor,
or 1 type of successor and 3 types of predecessor). A total of 15
miRNAs target RB1, which does not regulate any miRNA in the
differentially-expressed network or the related network.
The fourth class of TFs, including CDKN1A and PDGFB,
has 4 types of adjacency node (1 type of successor and 2 types of
predecessor, or 1 type of predecessor and 2 types of successor). A
total of 3 miRNAs target CDKN1A, which regulates hsa-miR-106a in
the global network, but does not regulate anything in the related
network.
Next, the study focused on other genes that are not
TFs. The first class of gene, including ATM, CDK4, CDK6 and ATM,
has 3 types of adjacency node (3 types of predecessor). CDK4 and
CDK6 are only targeted by a few miRNAs in the three levels of
network, but they do not regulate any miRNAs.
The second class of gene, including CDC25A and NF1,
has 2 types of adjacency node in the three levels of network (2
types of predecessor). These genes are only targeted by a few
miRNAs in the related and global networks, but they do not regulate
any miRNAs.
The third class of gene, including BCL2L1, IDH1,
SMC1A and HIST1H3B, has 1 type of adjacency node in the three
levels of network (1 type of predecessor). It was indicated that
these genes have the least effect compared with other
differentially-expressed genes.
Comparison and analysis of the
features of the differentially-expressed miRNAs
The miRNA pathways were compared and analyzed using
the same method as for the regulatory pathways of the
differentially-expressed genes. For 89 differentially-expressed
miRNAs (12 differentially-expressed miRNAs did not have adjacency
nodes), 18 differentially-expressed miRNAs (hsa-miR-9, hsa-miR-7,
hsa-miR-27a, hsa-miR-21, hsa-miR-20, hsa-miR-19a, hsa-miR-195,
hsa-miR-17, hsa-miR-15, hsa-miR-155, hsa-miR-146a, hsa-miR-125b,
hsa-miR-200b, hsa-miR-145, hsa-miR-106b, hsa-miR-93, hsa-miR-20a
and hsa-miR-34a) and their corresponding genes form self-adaption
associations. That is to say that each miRNA targets TFs and is
regulated by these TFs. We concluded 6 classes of miRNA, which have
six, five, four, three, two or one adjacent node of miRNA,
respectively. These separately included 9, 12, 14, 17, 13 and 12
miRNAs, respectively.
The first class of miRNAs, including hsa-miR-19a,
hsa-miR-125b and hsa-miR-21, has 6 types of adjacency node (3 types
of predecessor and 3 types of successor). The following text
focuses on hsa-miR-21.
Table III shows
hsa-miR-21, predecessors of hsa-miR-21 and successors of
hsa-miR-21, as well as their regulatory associations. In Table III, PTEN and EGFR regulate
hsa-miR-21, and the miRNA targets 3 genes in the
differentially-expressed network. A total of 6 and 19 genes
regulate hsa-miR-21, and the miRNA targets 12 and 87 genes in the
related and global networks, respectively. It may be concluded that
PTEN and EGFR indirectly affect PTEN, EGFR and CDK6 expression by
regulating hsa-miR-21 in the differentially-expressed network.
Table III shows that PTEN and
hsa-miR-21, and EGFR and hsa-miR-21 separately form self-adaption
associations. hsa-miR-21 also indirectly affects other miRNAs
through certain TFs; for example, hsa-miR-21 targets PTEN, which
regulates hsa-miR-19a and hsa-miR-25.
| Table III.Regulatory associations between
hsa-miR-21 and genes. |
Table III.
Regulatory associations between
hsa-miR-21 and genes.
| Regulatory
association |
Differentially-expressed network | Related network | Global network |
|---|
| hsa-miR-21 |
|
|
|
| Genes
that regulate the miRNA | EGFR, PTEN | EGFR, PTEN, BMP6,
REL, RELA, STAT3 | EGFR, PTEN, TCF4,
STAT4, STAT3, REST, RELA, REL, RASGRF1, NFKB1, NFIB, JUN, FOXO3,
ETV5, ESR1, DDX5, BMPR1B, BMPR1A, BMP6 |
| Genes
targeted by the miRNA | EGFR, PTEN, CDK6 | EGFR, PTEN, STAT3
RECK, FAS, ERBB2, E2F2, E2F1, CDKN1A, CDK6, CDC25A, BCL2 ACTA2 | ANKRD46, APAF1,
BASP1, BCL2, BMPR2, BTG2, CCR1, CDC25A, CDK2AP1, CDK6, CDKN1A,
CFL2, DAXX, DERL1, E2F1, E2F2, EGFR, EIF2S1, EIF4A2, ERBB2, FAM3C,
FAS, FMOD, GLCCI1, HIPK3, HNRNPK, ICAM1, IL1B, IL6R, ISCU, JAG1,
JMY, LRRFIP1, MARCKS, MEF2C, MSH2, MSH6, MTAP, MYC, NCAPG, NCOA3,
NFIB, NT-3, PCBP1, PDCD4, PDHA2 PELI1, PLAT, PLOD3, PPARA, PPIF,
PRRG4, PTEN, PTX3, RASA1, RASGRP1, RECK, REST, RHOB, RP2, RPS7,
RTN4, SERPINB5 SESN1, SGK3, SLC16A1, SOCS5, SOX5, SPATS2L, SPRY2,
STAT3, TGFB1, TGFBI, TGFBR2, TGFBR3, TGIF1, TIAM1, TIMP3, TM9SF3,
TNFAIP3, TOPORS, TP53BP2, TP63, TPM1, WFS1, WIBG |
The second class of miRNAs, including hsa-miR-20a
and hsa-miR-200b, has 5 types of adjacency node (3 types of
successor and 2 types of predecessor, or 2 types of successor and 3
types of predecessor). No gene regulates hsa-miR-20a, but
hsa-miR-20a targets PTEN and RB1 in the differentially-expressed
network. E2F1 regulates hsa-miR-20a, and hsa-miR-20a targets CCND1,
E2F1, RB1, PTEN, HIF1A, BCL2, CDKN1A, E2F3, THBS1 and VEGFA in the
related network. TP53 regulates hsa-miR-200b, but hsa-miR-34a does
not target any gene in the differentially-expressed network, A
total of 3 genes regulate hsa-miR-200b, and hsa-miR-200b targets 2
genes in the related network. It was found that ZEB1 regulates
hsa-miR-200b, and that hsa-miR-200b targets ZBE1 in the related
network.
The third class of miRNAs, including hsa-miR-93 and
hsa-miR-130b has 4 types of adjacency node (3 types of successor
and 1 type of predecessor, 2 types of successor and 2 types of
predecessors, or 1 type of successor and 3 types of predecessor).
No TFs regulate hsa-miR-93, and hsa-miR-93 does not target any gene
in the differentially-expressed network. The E2F1 gene regulates
hsa-miR-93, and the miRNA targets 3 genes in the related network.
E2F1 regulates hsa-miR-93, and the miRNA targets E2F1 in the global
network.
The fourth class of miRNAs, including hsa-miR-10b,
hsa-miR-16-1 and hsa-miR-128, has 3 types of adjacency node (3
types of successor, 2 types of successor and 1 type of
predecessors, or 1 type of successor and 2 types of predecessor).
It was found that no gene regulates hsa-miR-128 in all three levels
of network. hsa-miR-128 targets EGFR and FBXW7 in the
differentially-expressed network, and targets 4 genes in the
related network. It was suggested that no gene indirectly affects
the expression of other genes by regulating hsa-miR-128 in the
three levels of network. If an miRNA does not have predecessors,
such as hsa-miR-128, it is hypothesized that no gene regulates the
miRNA in all three levels of network.
The fifth class of miRNAs, including hsa-miR-181b,
hsa-miR-140 and hsa-miR-146b, has 2 types of adjacency node (2
types of successors, 1 type of successor and 1 type of predecessor,
or 2 types of predecessor). No gene regulates hsa-miR-181b in all
three levels of network. hsa-miR-181b targets 2 genes in the
related network.
The sixth class of miRNAs, including hsa-miR-136,
has 1 type of adjacency node (1 type of successor or 1 type of
predecessor). No gene regulates hsa-miR-136 in the three levels of
network, but the miRNA targets RIL1 in the global network. SOX9
regulates hsa-miR-140 in the global network, and hsa-miR-140
targets no genes in the three levels of network.
Comparison and analysis of the
features of popular TFs
Using the same method as aforementioned, each
popular TF was compared and analyzed in the three levels of
network. A total of 3 TFs (E2F1, E2F3 and NFKB1) and the
corresponding miRNAs were observed to form self-adaption
associations.
The first class of TFs, including E2F3, E2F1, RELA,
NFKB1, RUNX1, STAT3, YY1 and ZEB1, has 6 types of adjacency node (3
types of successor and 3 types of predecessor). The following text
focuses on E2F1.
Table IV shows E2F1,
predecessors of E2F1 and successors of E2F1, as well as their
regulatory associations. In total, 8 differentially-expressed
miRNAs target E2F1, and E2F1 regulates 13 differentially-expressed
miRNAs. A total of 10 and 19 miRNAs target E2F1, and E2F1 regulates
13 and 31 miRNAs in the related and global networks, respectively.
It was found that 5 miRNAs (hsa-miR-106a, hsa-miR-17, hsa-miR-20,
hsa-miR-20a and hsa-miR-93) and E2F1 separately form self-adaption
associations. E2F1 is not differentially expressed in glioma, but
hsa-miR-17 and hsa-miR-93 are differentially expressed; from this
it can be inferred that the two indirectly lead to E2F1 causing the
abnormal expression of other miRNAs. The pathways for E2F1 and
differentially-expressed miRNAs indicated further important
differentially-expressed miRNAs in glioma. These miRNAs are not
only differentially expressed, but also are adjacent nodes of E2F1,
which is frequently involved in the transcription of cancer.
| Table IV.Regulatory associations between miRNAs
and E2F1. |
Table IV.
Regulatory associations between miRNAs
and E2F1.
| Gene association |
Differentially-expressed network | Related network | Global network |
|---|
| E2F1 |
|
|
|
| miRNAs
targeting the gene | miR-106a, miR-17,
miR-20, miR-20a, miR-21, miR-23b, miR-34a, miR-93 | miR-106a, mir-126,
miR-17, miR-20, miR-20a, miR-21, miR-23b, miR-34a, miR-93,
miR-98 | let-7a, miR-106a,
miR-106a-5p, miR-106b, miR-126, miR-149*, miR-17, miR-17–5p,
miR-20, miR-203a, miR-20a, miR-21, miR-223, miR-23b, miR-330–3p,
miR-331–3p, miR-34a, miR-93, miR-98 |
| miRNAs
regulated by the gene | miR-106a, miR-106b,
miR-15a, miR-15b, miR-16, miR-16–1, miR-17, miR-195, miR-19a,
miR-20, miR-20a, miR-25, miR-93 | miR-106a, miR-106b,
miR-15a, miR-15b, miR-16, miR-16–1, miR-17, miR-195, miR-19a,
miR-20, miR-20a miR-25, miR-93 | let-7a, let-7a-1,
let-7a-2, let-7a-3, let-7i, miR-106, miR-106a, miR-106b, miR-15a,
miR-15b, miR-16, miR-16–1, miR-16–2, miR-16–3, miR-17 miR-18a,
miR-18b, miR-195, miR-19a, miR-19b, miR-19b-1, miR-19b-2, miR-20,
miR-20a, miR-20b, miR-223, miR-25, miR-363, miR-449, miR-449a,
miR-449b, miR-449c, miR-91, miR-92–1, miR-92–2, miR-92a, miR-92a-1,
miR-92a-2, miR-93 |
The second class of TFs, including CUX1 and TCF3,
has 3 types of adjacency node (3 types of successor or 3 types of
predecessor). No miRNAs target TCF3, and TCF3 regulates hsa-miR-451
in all three levels of network.
The third class of TFs, including CREB1 and NFKB1,
has 2 types of adjacency node (1 type of successor and 1 type of
predecessor). A total of 4 miRNAs target CREB1, and CREB1 regulates
3 miRNAs in the global network.
The fourth class of TFs, including TFAP4 and NR2F2,
has 1 type of adjacency node (1 type of predecessor). hsa-miR-373
targets TFAP4 in the global network. If a TF does not havea
successor, such as TFAP4, it is hypothesized that this TF does not
regulate other miRNAs.
Overall, in the present study, three levels of
regulatory network (the differentially-expressed, related and
global networks) were collected and constructed, from which all
currently experimentally validated genes and miRNAs associated with
glioma were analyzed. The similarities and differences between all
the differentially-expressed elements were compared in the three
levels of network to distinguish the key nodes and pathways that
contribute to our understanding of the carcinogenicity mechanism
and therapy of glioma. Important pathways and a topological network
on the development of glioma were found. Certain pathways showed
unique features; for example, a TF can regulate one or more miRNAs,
and a target gene can be targeted by one or more miRNAs. Therefore,
the host genes and target genes, the host genes and TFs, and the
target genes and TFs exhibit an indirect affect on each other via
the miRNAs. The association also exists between TFs and TFs, target
genes and target genes, and host genes and host genes. For example,
PTEN regulates hsa-miR-21 and hsa-miR-25, which separately target
EGFR and FBXW7. This association indicates that PTEN indirectly
affects EGFR and FBXW7 by hsa-miR-21 and hsa-miR-25. In the same
way, TP53 regulates hsa-miR-29c, hsa-miR-107, hsa-miR-34a and
hsa-miR-125b, which all target CDK6, indicating that TP53
indirectly affects CDK6 by hsa-miR-29c, hsa-miR-107 and
hsa-miR-34a. Also, certain self-adaption associations exist in
networks between PTEN and hsa-miR-21; hsa-miR-21 targeted PTEN and
PTEN regulated hsa-miR-21 in three networks. This type of
association also exists between PTEN and hsa-miR-19a, TP53 and
hsa-miR-125b, EGFR and hsa-miR-21, E2F1 and hsa-miR-20, E2F1 and
hsa-miR-93, E2F1 and hsa-miR-19a, E2F1 and hsa-miR-20a, E2F1 and
hsa-miR-17 and E2F1 and hsa-miR-106b. The results and the
comprehensive data supplied in the present study will enable
biologists to conduct further studies. In the future, we will
consider the interaction between proteins and regulatory patterns,
including upregulation and downregulation, to construct a more
extensive network of glioma.
The present study highlights a number of important
pathways of differentially-expressed genes, differentially
expressed miRNAs and predicted TFs in glioma. The results revealed
certain important pathways which have not only been observed in
glioma, but also in other cancers, such as retinoblastoma. In the
present study, numerous pathways were identified: For example,
hsa-miR-149 targets at E2F3 and E2F3 regulates hsa-let-7i. These
pathways exhibit a key biological function in retinoblastoma.
Therefore, the function of the network and pathway of miRNAs,
transcription factors, target genes and host genes in
retinoblastoma are similar to those observed in gliomas.
Acknowledgements
This study was supported by the National Natural
Science Foundation of China (grant nos. 60973091 and 60905022), and
the Natural Science Foundation of Jilin Province (grant no.
20130101166JC).
Glossary
Abbreviations
Abbreviations:
|
miR/miRNA
|
microRNA
|
|
TFs
|
transcription factors
|
|
NCBI
|
National Center for Biotechnology
Information
|
|
TFBSs
|
TF binding sites
|
References
|
1
|
He J, Zhang W, Zhou Q, Zhao T, Song Y,
Chai L and Li Y: Low-expression of microRNA-107 inhibits cell
apoptosis in glioma by upregulation of SALL4. Int J Biochem Cell
Biol. 45:1962–1973. 2013. View Article : Google Scholar : PubMed/NCBI
|
|
2
|
Lefranc F, Rynknowski M, DeWitte O and
Kiss R: Present and potential future adjuvant issues in high-grade
astrocytic glioma treatment. Adv Tech Stand Neurosurg. 34:3–35.
2009.PubMed/NCBI
|
|
3
|
Yu J, Cai X, He J, Zhao W, Wang Q and Liu
B: Microarray-based analysis of gene regulation by transcription
factors and microRNAs in glioma. Neurol Sci. 34:1283–1289. 2013.
View Article : Google Scholar : PubMed/NCBI
|
|
4
|
Hobert O: Gene regulation by transcription
factors and microRNAs. Science. 319:1785–1786. 2008. View Article : Google Scholar : PubMed/NCBI
|
|
5
|
Dong CG, Wu WK, Feng SY, Wang XJ, Shao JF
and Qiao J: Co-inhibition of microRNA-10b and microRNA-21 exerts
synergistic inhibition on the proliferation and invasion of human
glioma cells. Int J Oncol. 41:1005–1012. 2012.PubMed/NCBI
|
|
6
|
Rodriguez A, Griffiths-Jones S, Ashurst JL
and Bradley A: Identification of mammalian microRNA host genes and
transcription units. Genome Res. 14:1902–1910. 2004. View Article : Google Scholar : PubMed/NCBI
|
|
7
|
Wang J, Lu M, Qiu C and Cui Q: TransmiR: A
transcription factor-microRNA regulation database. Nucleic Acids
Res. 38(Database issue): D119–D122. 2010. View Article : Google Scholar : PubMed/NCBI
|
|
8
|
Kozomara A and Griffiths-Jones S: miRBase
integrating microRNA annotation and deep-sequencing data. Nucleic
Acids Res. 39(Database issue): D152–D157. 2011. View Article : Google Scholar : PubMed/NCBI
|
|
9
|
Safran M, Dalah I, Alexander J, Rosen N,
Iny Stein T, Shmoish M, Nativ N, Bahir I, Doniger T, Krug H, et al:
GeneCards Version 3: The human gene integrator. Database (Oxford).
2010:baq0202010. View Article : Google Scholar : PubMed/NCBI
|
|
10
|
Chekmenev DS, Haid C and Kel AE: P-Match:
Transcription factor binding site search by combining patterns and
weight matrices. Nucleic Acids Res. 33(Web Server issue):
W432–W437. 2005. View Article : Google Scholar : PubMed/NCBI
|
|
11
|
Fujita PA, Rhead B, Zweig AS, Hinrichs AS,
Karolchik D, Cline MS, Goldman M, Barber GP, Clawson H, Coelho A,
et al: The UCSC Genome Browser database: Update 2011. Nucleic Acids
Res. 39(Database issue): D876–D882. 2011. View Article : Google Scholar : PubMed/NCBI
|
|
12
|
Bao J, Li D, Wang L, Wu J, Hu Y, Wang Z,
Chen Y, Cao X, Jiang C, Yan W and Xu C: MicroRNA-449 and
microRNA-34b/c function redundantly in murine testes by targeting
E2F transcription factor-retinoblastoma protein (E2F-pRb) pathway.
J Biol Chem. 287:21686–21698. 2012. View Article : Google Scholar : PubMed/NCBI
|
|
13
|
Ishii N, Maier D, Merlo A, Tada M,
Sawamura Y, Diserens AC and Van Meir EG: Frequent co-alterations of
TP53, p16/CDKN2A, p14 (ARF), PTEN tumor suppressor genes in human
glioma cell lines. Brain Pathol. 9:469–479. 1999. View Article : Google Scholar : PubMed/NCBI
|
|
14
|
Wu L, Li G, Feng D, Qin H, Gong L, Zhang J
and Zhang Z: MicroRNA-21 expression is associated with overall
survival in patients with glioma. Diagn Pathol. 8:2002013.
View Article : Google Scholar : PubMed/NCBI
|