Introduction
Colon cancer is one of the most prevalent malignant
tumors and a leading cause of cancer-associated mortality
worldwide, with significant morbidity (1,2). However,
the molecular pathogenesis of colon cancer remains poorly
understood. Previous studies have suggested that various mechanisms
contribute to the progression of colon cancer, including mutations
in components of cell cycle or apoptotic pathways, and the
processes of signal transduction, angiogenesis, invasion and
metastasis (3–6). Recently, growing evidence indicates that
immune mechanisms, including infiltrating immune cell activation,
immunosurveillance and immunosuppressive pathways, are crucial in
colon cancer progression (7).
Recently, research has focused on the study of
immune infiltrates, tumor-infiltrating lymphocytes (TILs), which
include cluster of differentiation (CD) 3+,
CD4+ and CD8+ T cells, natural killer cells
and myeloid cells; these are widely accepted to be the most
promising T cell subsets with regard to their effective antitumor
response (8,9). In a study on 959 specimens of resected
colorectal cancer, Pagès et al (10) suggested that T cell activation in
colorectal cancer is associated with the absence of pathological
evidence of early metastatic invasion and with prolonged survival.
Another study indicated that CD8+ T cells expressed in
colorectal cancer have an important role in antitumor immune
responses (11). Furthermore,
CD45RO+ T cell densities have been demonstrated to
correlate with tumor invasion, disease stage, lymph node metastasis
and long-term disease-free survival (12).
The transcription factor forkhead box P3 (FOXP3) is
a specific nuclear marker for regulatory T cells (Tregs), which are
able to suppress immune responses to tumor antigens, thus
maintaining immunological tolerance and contributing to tumor
metastasis (13). Accumulating
evidence suggests that high levels of tumor-infiltrating Tregs were
associated with a poor prognosis in certain types of solid tumor,
including oesophageal, pancreatic, breast, hepatocellular and
ovarian cancers (14–18). Given the central contribution of FOXP3
to tumor cells, it may represent a novel mechanism by which cancer
are able to suppress the immune system to escape destruction.
Carcinoembryonic antigen-related cell adhesion
molecule (CEACAM) 6, also known as CD66c or NCA-50/90, is a member
of the carcinoembryonic antigen family and an adhesion molecule of
the immunoglobulin superfamily (19).
It is able to inhibit anoikis (20),
increase the ability of tumor invasion, and contribute to promoting
tumor occurrence, development, invasion and metastasis (21,22). A
growing number of studies have demonstrated that it is widely
expressed in numerous types of malignant human tumors, including
breast carcinoma, ovarian cancer, gastric carcinoma, colorectal
cancer, lung adenocarcinoma and pancreatic cancer (23–28).
In the present study, the variations in T cell
infiltration and FOXP3 and CEACAM6 expression levels between normal
colonic mucosa, colonic adenoma, and stage I–II and stage III–IV
colon cancer were analyzed. The aims were to investigate the immune
reaction in different stages of colon cancer development and to
explore the roles that FOXP3, CEACAM6 and various T-cell subsets
serve in the occurrence and progression of colon cancer.
Materials and methods
Patient specimens
Tissue specimens from 78 cases of colon cancer
(including 40 cases of stage I–II and 38 cases of stage III–IV) and
30 cases of colonic adenoma were collected from the patients who
had been treated in the First Affiliated Hospital of Soochow
University (Suzhou, China) between January 2010 and December 2011.
In addition, 12 healthy colon tissue specimens from patients who
underwent colonoscopy as part of colon cancer screening were
collected as a normal control group. None of the patients had
undergone radiotherapy, chemotherapy or immunotherapy previously.
The specimens of colon cancer and adenoma were obtained during
surgery and fixed in 10% neutral formalin. Postoperative pathology
confirmed colonic carcinoma or colonic adenoma, and
tumor-node-metastasis classification and differentiation grading
for colon cancer were determined according to the criteria
described by the Union for International Cancer Control (29). Tubular, mixed and villous adenoma were
all classified into the adenoma group. The study was approved by
the research ethics committee of the First Affiliated Hospital of
Soochow University, and agreed by each patient with written
consent.
Immunohistochemical staining for CD3,
CD4, CD8, CD45RO, CEACAM6 and FOXP3
According to routine procedures, specimens were
formalin-fixed and paraffin-embedded (FFPE); 4-µm sections were
subsequently cut, dried, de-waxed and rehydrated. The antigens were
retrieved by incubation in sodium citrate buffer solution (Dako,
Glostrup, Denmark) at pH 6.0 and heating in a high-pressure cooker,
before being naturally cooled to room temperature. The tissue
slides were blocked for 10 min at room temperature (25°C), washed
with phosphate-buffered saline (PBS), then incubated with the
following anti-human antibodies at room temperature (25°C) for 2 h
in moist dark chambers: Monoclonal mouse IgG1 against CD3
(#sc-20047), polyclonal rabbit IgG against CD4 (#sc-7219) and CD8
(#sc-7188; all from Santa Cruz Biotechnology, Inc., Dallas, TX,
USA; dilution, 1:100); monoclonal mouse IgG2a against CD45RO
(#ab86080; dilution, 1:10), monoclonal rabbit IgG against CEACAM6
(#ab134074; dilution, 1:400) and monoclonal mouse IgG3 against
FOXP3 (#ab450; 1:50 dilution; all from Abcam, Cambridge, MA, USA).
The sections were subsequently washed with PBS and incubated for 1
h in moist dark chambers at room temperature (25°C) with polyclonal
goat anti-mouse/rabbit IgG biotinylated secondary antibodies
(#K5007; dilution, 1:2,000; Dako). Finally, the sections were
developed with 3,3′-diaminobenzidine tetrahydrochloride hydrate
(Dako) and counterstained with hematoxylin (AppliChem GmbH,
Darmstadt, Germany). Human tonsillar tissue was used as a positive
control, and the negative control was created by omitting primary
antibodies.
Scoring system for
immunohistochemistry
The expression levels of CD3, CD4, CD8, CD45RO,
CEACAM6 and FOXP3 were scored using a semi-quantitative system
(30). For each section, the staining
intensity was scored as 0 (achromatic), 1 (light yellow), 2
(brownish yellow), or 3 (brown). In addition, the percentage of
positive cells was scored as 0 (<5%), 1 (5–25%), 2 (26–50%), 3
(51–75%), or 4 (>75%). The two scores were added together and
the specimens were assigned to one of four levels as follows: (−),
score 0–1; (+), score 2; (++), score 3–4; or (+++), score ≥5. (−)
and (+) were defined as negative expression. In each specimen, 5
randomly selected high-power fields (magnification, ×400) were
assessed using the Olympus BX53 microscope (Olympus, Tokyo, Japan),
avoiding necrotic areas. The specimens were scored by two
pathologists independently and the scoring results were strongly
consistent.
Reverse transcription-quantitative
polymerase chain reaction (RT-qPCR)
Purification of total RNA from FFPE tissue sections
was performed using an RNeasy FFPE Kit (#73504; Qiagen, Inc.,
Valencia, CA, USA). Initially, all paraffin was removed from
freshly cut FFPE tissue sections by treating with deparaffinization
solution (Qiagen, Inc.). Next, samples were incubated in an
optimized lysis buffer, containing proteinase K, to release RNA
from the sections. A short incubation at 80°C partially reversed
formalin cross-linking of the released nucleic acids. This was
followed by deoxyribonuclease treatment that was optimized to
eliminate all genomic DNA. Next, the lysate was mixed with Buffer
RBC (provided with the RNeasy kit). Ethanol was added to provide
appropriate binding conditions for RNA, and then the samples were
applied to the provided RNeasy MinElute spin columns, in which the
total RNA bound to the membrane and contaminants were washed away.
RNA was then eluted in a minimum of 14 µl of RNase-free water. cDNA
was subsequently synthesized from the total RNA using RevertAid™
First Strand cDNA Synthesis kit (#K1622; Thermo Fisher Scientific,
Pittsburgh, PA, USA), according to the manufacturer's instructions.
mRNA levels were quantified by RT-qPCR using a FastStart Universal
SYBR Green Master (Rox) kit (#4913914001; Roche Diagnostics, Basel,
Switzerland). The PCR cycling conditions were as follows: 1 cycle
of starter template degeneration at 95°C for 1 min; and 45 cycles
of template degeneration at 95°C for 20 sec, annealing at 58°C for
30 sec and extension at 68°C for 45 sec. β-actin was used as an
internal reference. Three independent experiments were to analyze
relative target gene expressions. The expression of RNA was
quantified by quantification cycle (Cq) values and normalized by
the 2−ΔΔCq method relative to β-actin (31). All primers were supplied by Shanghai
Sangon Biotechnology Co., Ltd. (Shanghai, China) and are shown in
Table I.
 | Table I.Sequence of the primer pairs used for
reverse transcription-quantitative polymerase chain reaction. |
Table I.
Sequence of the primer pairs used for
reverse transcription-quantitative polymerase chain reaction.
| Gene name | GenBank accession
number | Sequence | Product size
(bp) |
|---|
| CD3 | NM_000732.4 | F,
5′-GGGAGTCTTCTGCTTTGCTG-3′ | 153 |
|
|
| R,
5′-TTGTTCCGAGCCCAGTTTC-3′ |
|
| CD4 | NM_000616.4 | F,
5′-GTGAACCTGGTGGTGATG-3′ | 122 |
|
|
| R,
5′-GAGACCTTTGCCTCCTTG-3′ |
|
| CD8 | NM_001768.6 | F,
5′-CTGGTGTGAATTGAAGGCTGT-3′ | 101 |
|
|
| R,
5′-GCTGCTGACCTCATTCTTCC-3′ |
|
| CD45RO | NM_002838 | F,
5′-TCTGCTGGAACTGACACG-3′ | 168 |
|
|
| R,
5′-CTCATTAACATTTAGCTTTG-3′ |
|
| CEACAM6 | BC005008.1 | F,
5′-TCCAGCAATCCACACAAGAG-3′ | 144 |
|
|
| R, 5′-R
5-GGACAGGAGCACTTCCAGAG-3′ |
|
| FOXP3 | NM_014009.3 | F,
5′-TCCCAGAGTTCCTCCACAAC-3′ | 122 |
|
|
| R,
5′-ATTGAGTGTCCGCTGCTTCT-3′ |
|
| β-actin | NM_001101.3 | F,
5′-CACTGTGCCCATCTACGAGG-3′ | 154 |
|
|
| R,
5′-AATGTCACGCACGATTTCC-3′ |
|
Statistical analysis
Continuous data is presented as the mean ± standard
deviation, and multiple sets of mean values were compared using
analysis of variance. The differences in the scores between the
groups were analyzed by the non-parametric Wilcoxon Rank Sum test.
All statistical analyses were performed using SPSS software,
version 18.0 (SPSS, Inc., Chicago, IL, USA). P<0.05 was
considered to indicate statistically significant differences, and
all P-values were two-tailed.
Results
Patient characteristics
A total of 120 patients were included in the study,
comprising 40 patients with stage I–II cancer, 38 patients with
stage III–IV cancer, 30 patients with colonic adenoma and 12 normal
controls. The stage I–II group contained 20 males and 20 females,
with a mean age of 62.5 years; the stage III–IV group comprised 18
males and 20 females with a mean age of 60.9 years. The mean ages
of the colonic adenoma patients and normal controls were 58.5 years
(7 males, 5 females) and 62.4 years (16 males, 14 females),
respectively (Table II). There were
no differences in age, gender or tumor localization between the
four groups (Table II).
| Table II.Patients characteristics (n=120). |
Table II.
Patients characteristics (n=120).
|
|
| Age, years | Gender, n | Localization,
n |
|---|
|
|
|
|
|
|
|---|
| Group | n | Mean ± SD | Range | Male | Female | Left colon | Right colon |
|---|
| Normal
controls | 12 | 62.4±14.9 | 34–83 | 7 | 5 | 6 | 6 |
| Colonic
adenoma | 30 | 58.5±12.9 | 38–84 | 16 | 14 | 13 | 17 |
| Stage I–II | 40 | 62.5±12.6 | 33–83 | 20 | 20 | 18 | 22 |
| Stage III–IV | 38 | 60.9±13.7 | 24–85 | 18 | 20 | 13 | 25 |
Infiltrations of T lymphocyte subsets
in normal colonic mucosa, adenoma and stage I–II and III–IV cancer
tissues
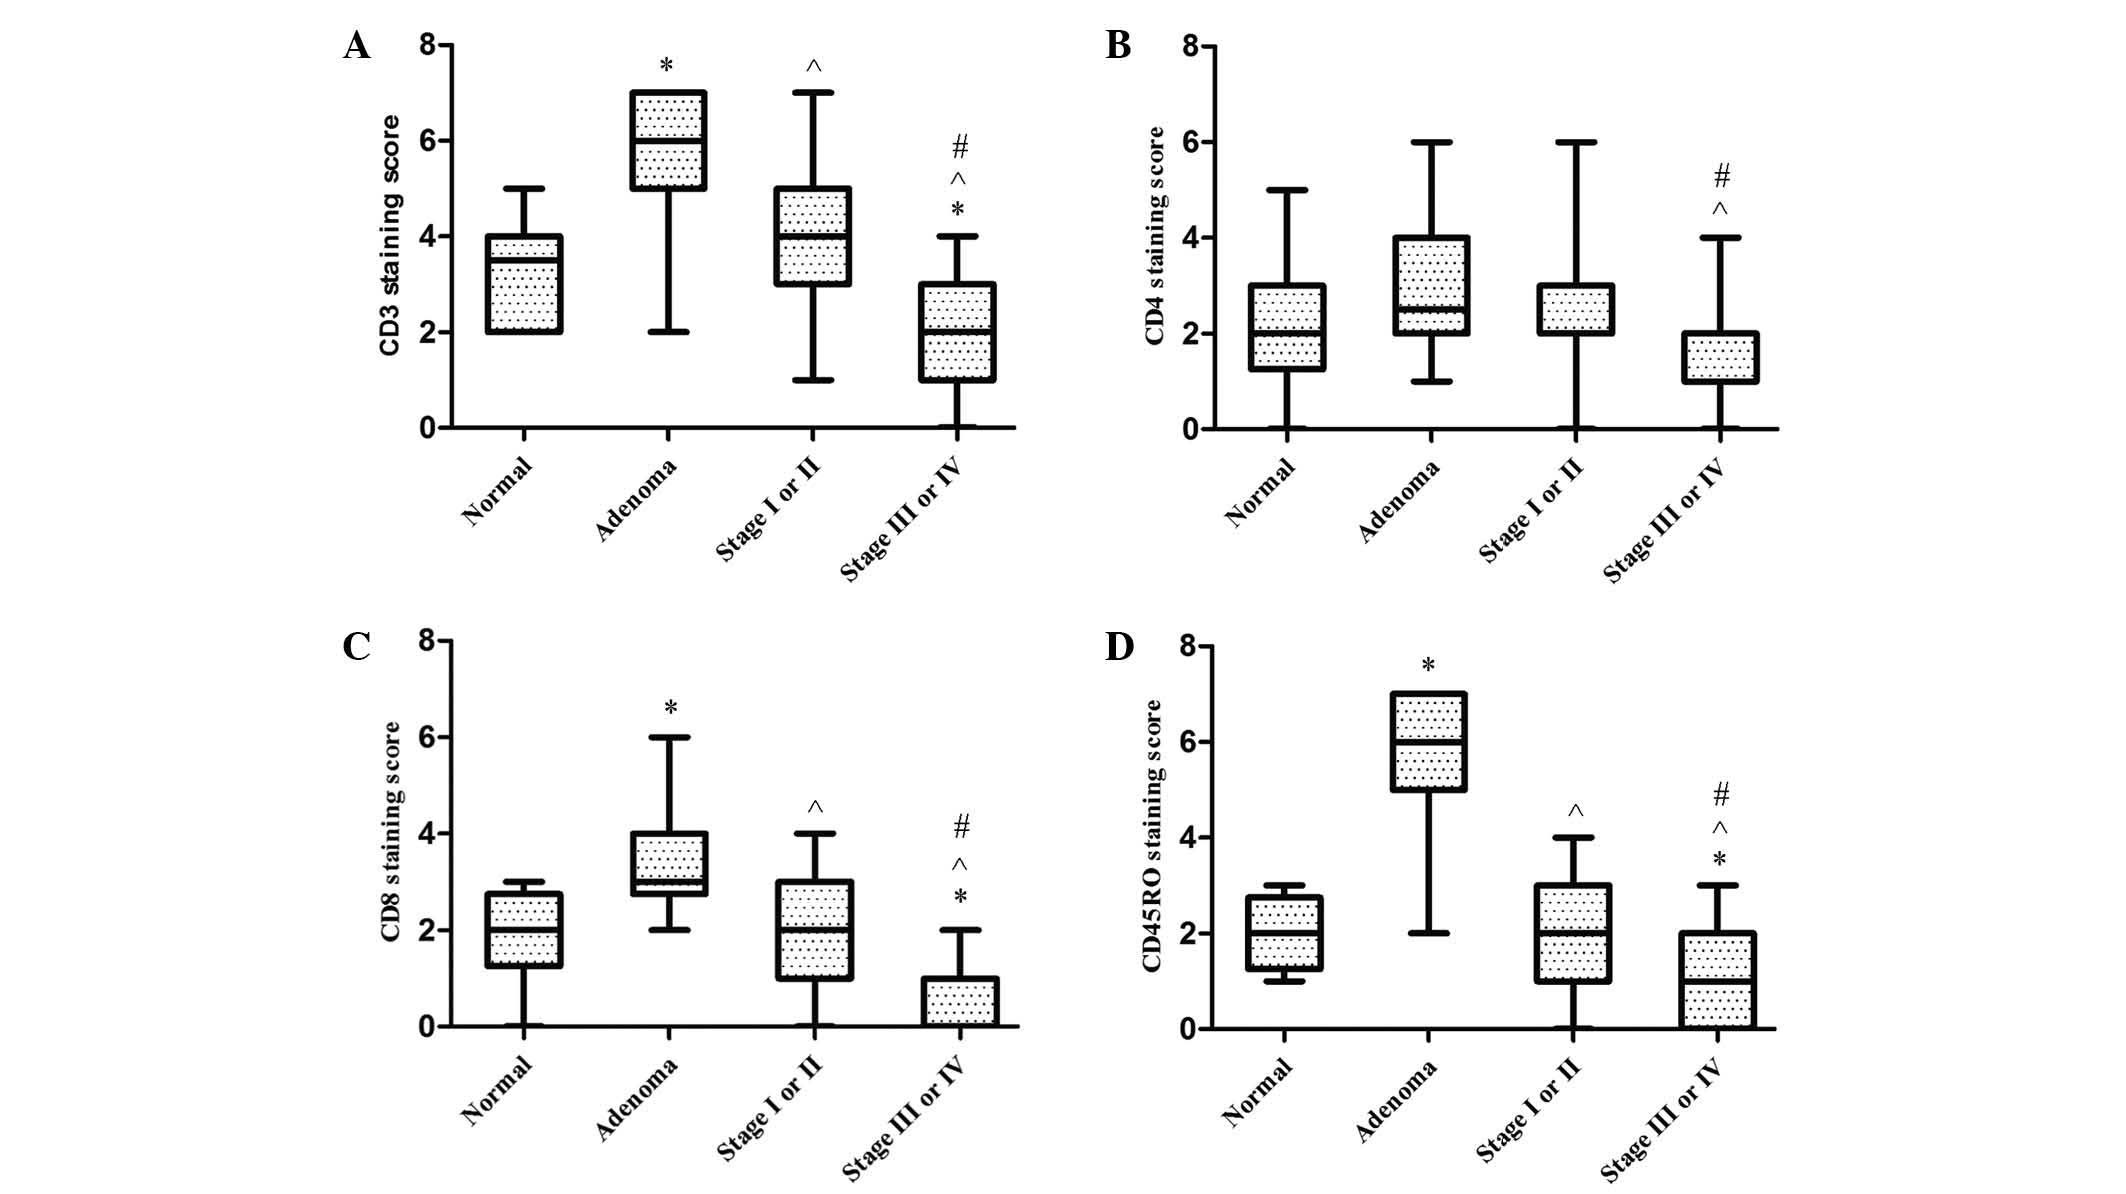
A semi-quantitative immunohistochemical scoring
system was used to assess T cells infiltration in the tissue
samples. CD3, CD4, CD8, CD45RO were all localized to the membrane,
as shown in Fig. 1. When compared to
the normal group, infiltrations of CD3+, CD8+
and CD45RO+ lymphocytes in colonic adenoma were all
significantly greater (P<0.001, P=0.001 and P<0.001);
however, CD4+ T cell infiltration did not differ
significantly between these two groups (P=0.052). CD3+ T
cell infiltrations in colonic adenoma were significantly higher
than in stage I–II cancer tissues (P=0.001), and similar results
were also found for CD8+ (P<0.001) and
CD45RO+ (P<0.001) T cell infiltration.
CD3+, CD4+, CD8+ and
CD45RO+ T cells in cancer tissues of stage III–IV were
all considerably lower than those of stage I–II (P<0.001,
P=0.045, P<0.001 and P<0.001, respectively). CD3+,
CD8+ and CD45RO+ T cell infiltrations in the
group of patients with stage III–IV cancer was lower than in normal
controls (P=0.015, P=0.002 and P=0.041, respectively). Furthermore,
CD3+, CD4+, CD8+ and
CD45RO+ T cell infiltrations in stage III–IV cancer
tissues were particularly markedly lower than in colonic adenoma
tissues (P=0.001, P<0.001, P<0.001 and P<0.001,
respectively). However, no significant differences were observed
between the normal control and stage I–II groups with regard to
CD3+ (P=0.166), CD4+ (P=0.500),
CD8+ (P=0.685) or CD45RO+ T cell infiltration
(P=0.562) (Fig. 2).
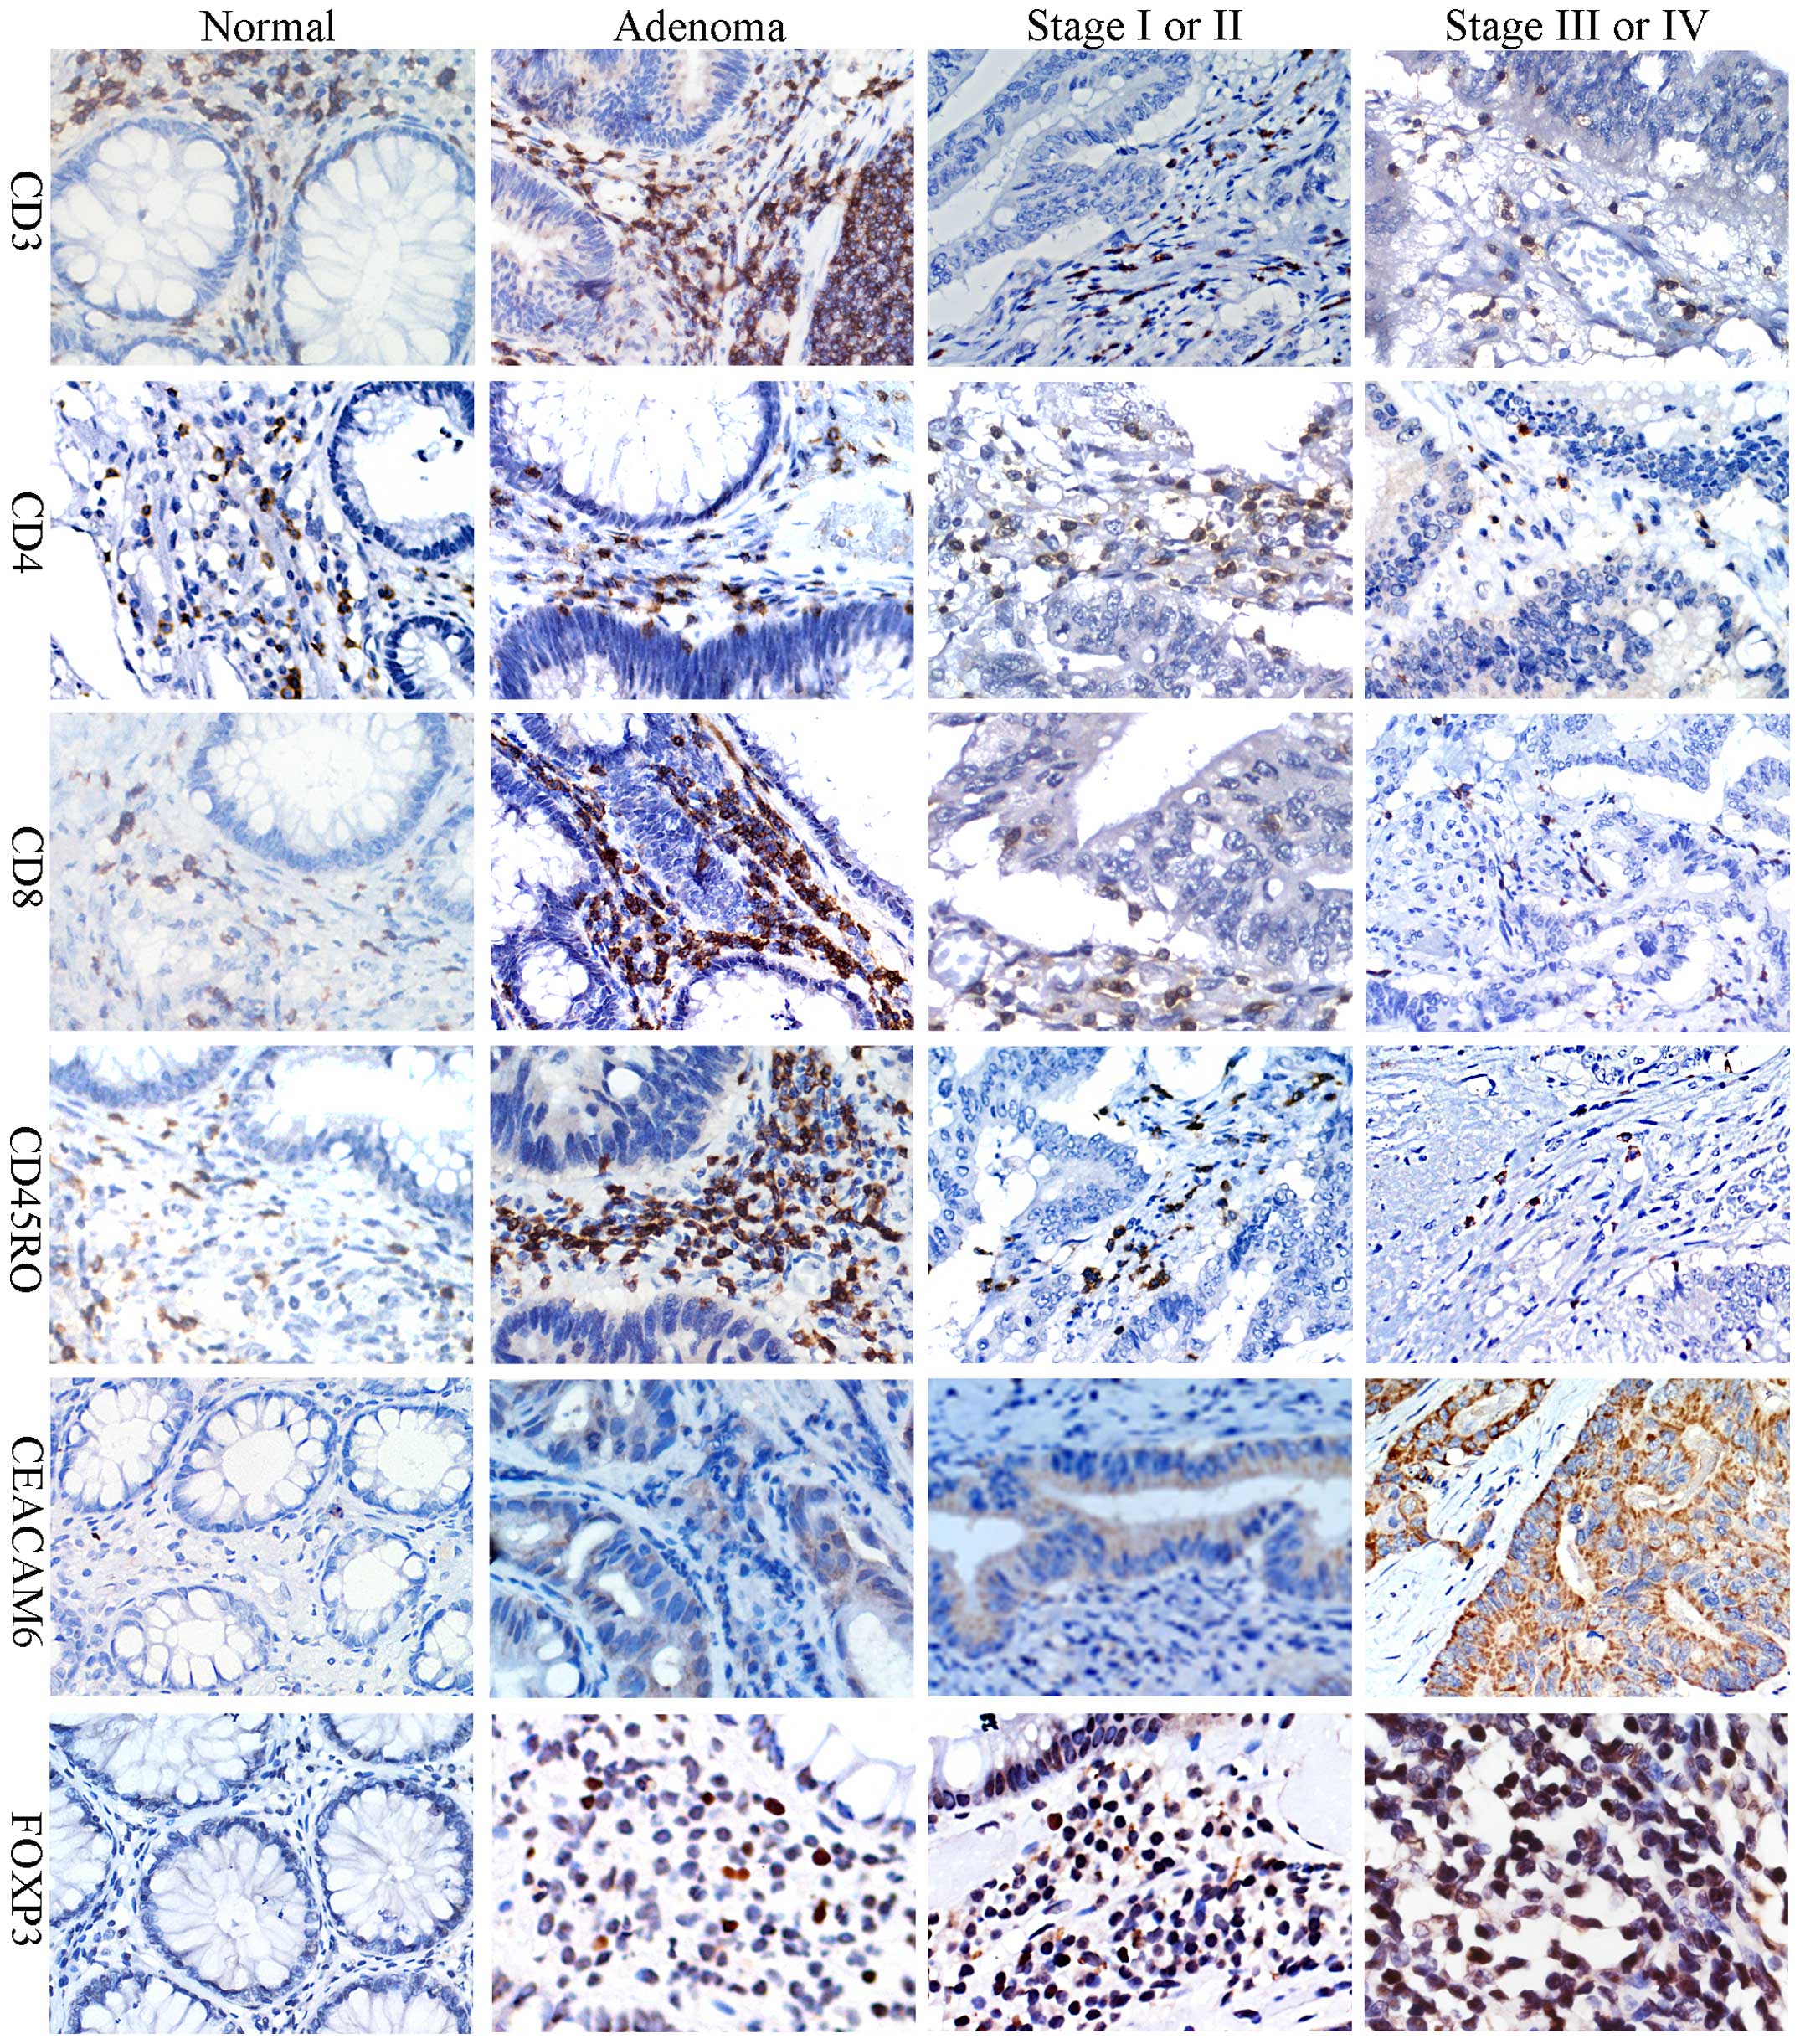 | Figure 1.Representative images of CD3, CD4,
CD8, CD45RO, CEACAM6 and FOXP3 staining by immunohistochemistry in
normal colonic tissue, colonic adenoma and colon cancer. Images
show 3,3′-diaminobenzidine tetrahydrochloride hydrate staining of
positive cells. CD3, CD4, CD8 and CD45RO were immunolocalized to
the membrane, CEACAM6 in the cytoplasmic and FOXP3 in the nucleus.
All images were taken at ×400 scanning magnification. CD, cluster
of differentiation; CEACAM6, carcinoembryonic antigen-related cell
adhesion molecule 6; FOXP3, forkhead box P3. |
Expression of CEACAM6 and FOXP3 in
normal colonic mucosa, adenoma and stage I–II and stage III–IV
cancer tissues
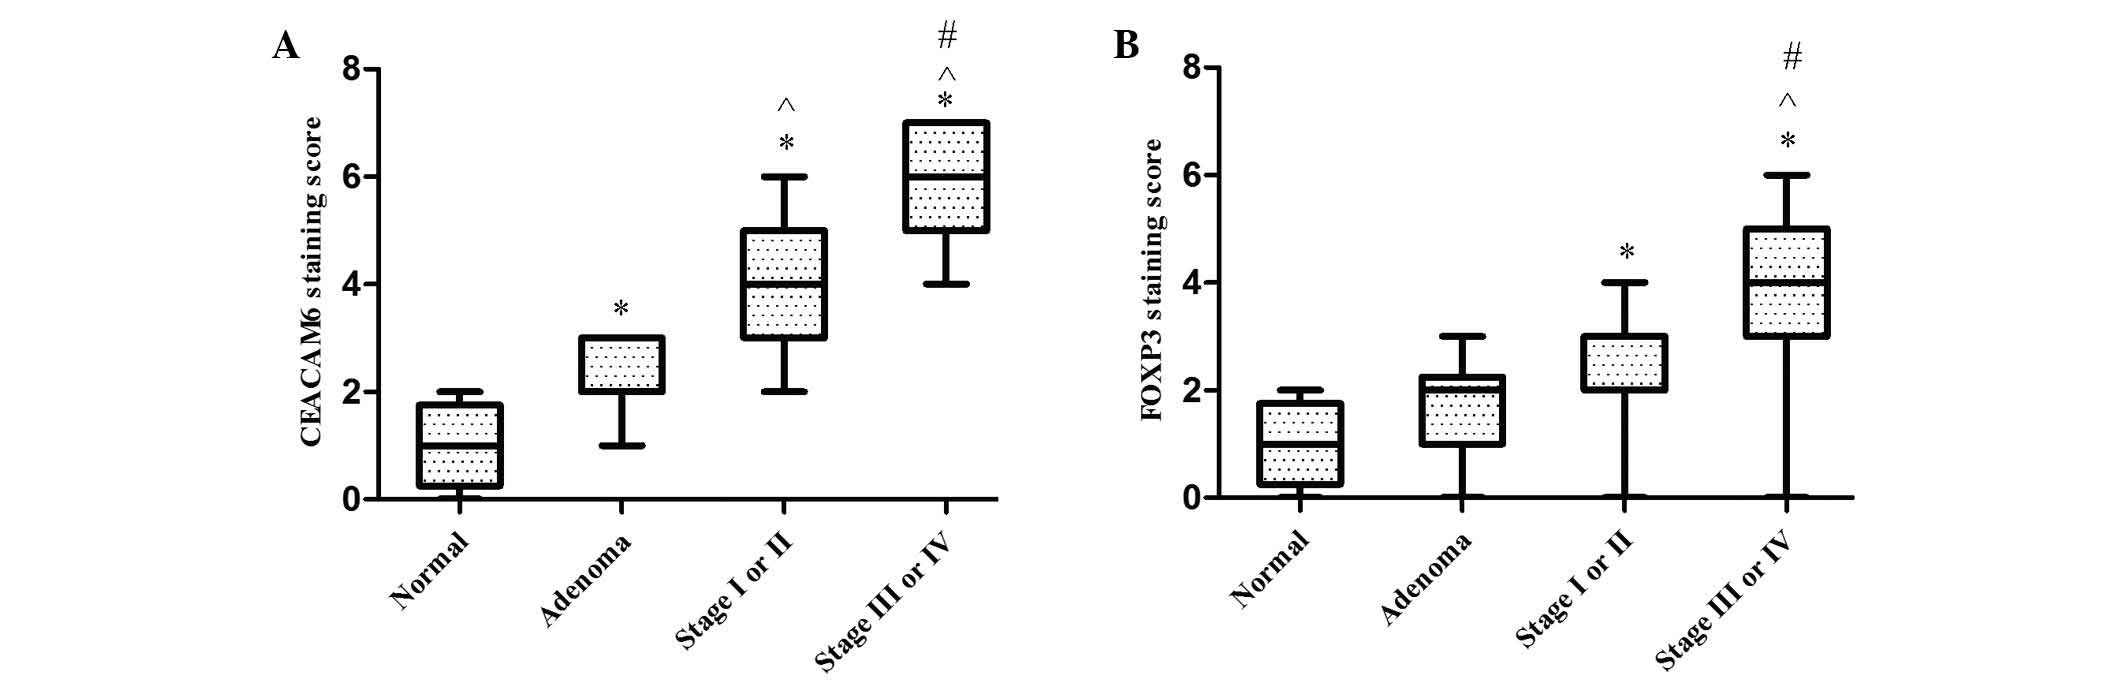
CEACAM6 proteins were localized to the cytoplasm
(Fig. 1). CEACAM6 expression was
markedly higher in stage I–II cancer tissues than in the colonic
adenoma or normal control groups (both P<0.001). Additionally,
the expression of CEACAM6 was higher in adenoma compared with
normal tissues (P<0.001), and higher in stage III–IV in
comparison with stage I–II cancer tissues (Fig. 3).
FOXP3+ lymphocytes were observed to have
infiltrated the interstitial tissues in the colon tissue specimens,
and FOXP3 expression was localized to the cell nuclei (Fig. 1). FOXP3 expression was significantly
stronger in stage I–II (P=0.014) and stage III–IV (P<0.001)
cancer tissues than in normal controls. The expression of FOXP3 was
marginally stronger in stage I–II than in colonic adenoma; however,
this difference was not significant (P=0.169). There was also no
significant difference between normal and adenoma tissues
(P=0.156). However, the expression of FOXP3 in patients with stage
III–IV was significantly greater than in adenoma (P<0.001), and
marked differences between stage III–IV and stage I–II cancer
tissues were also observed (P<0.001) (Fig. 3).
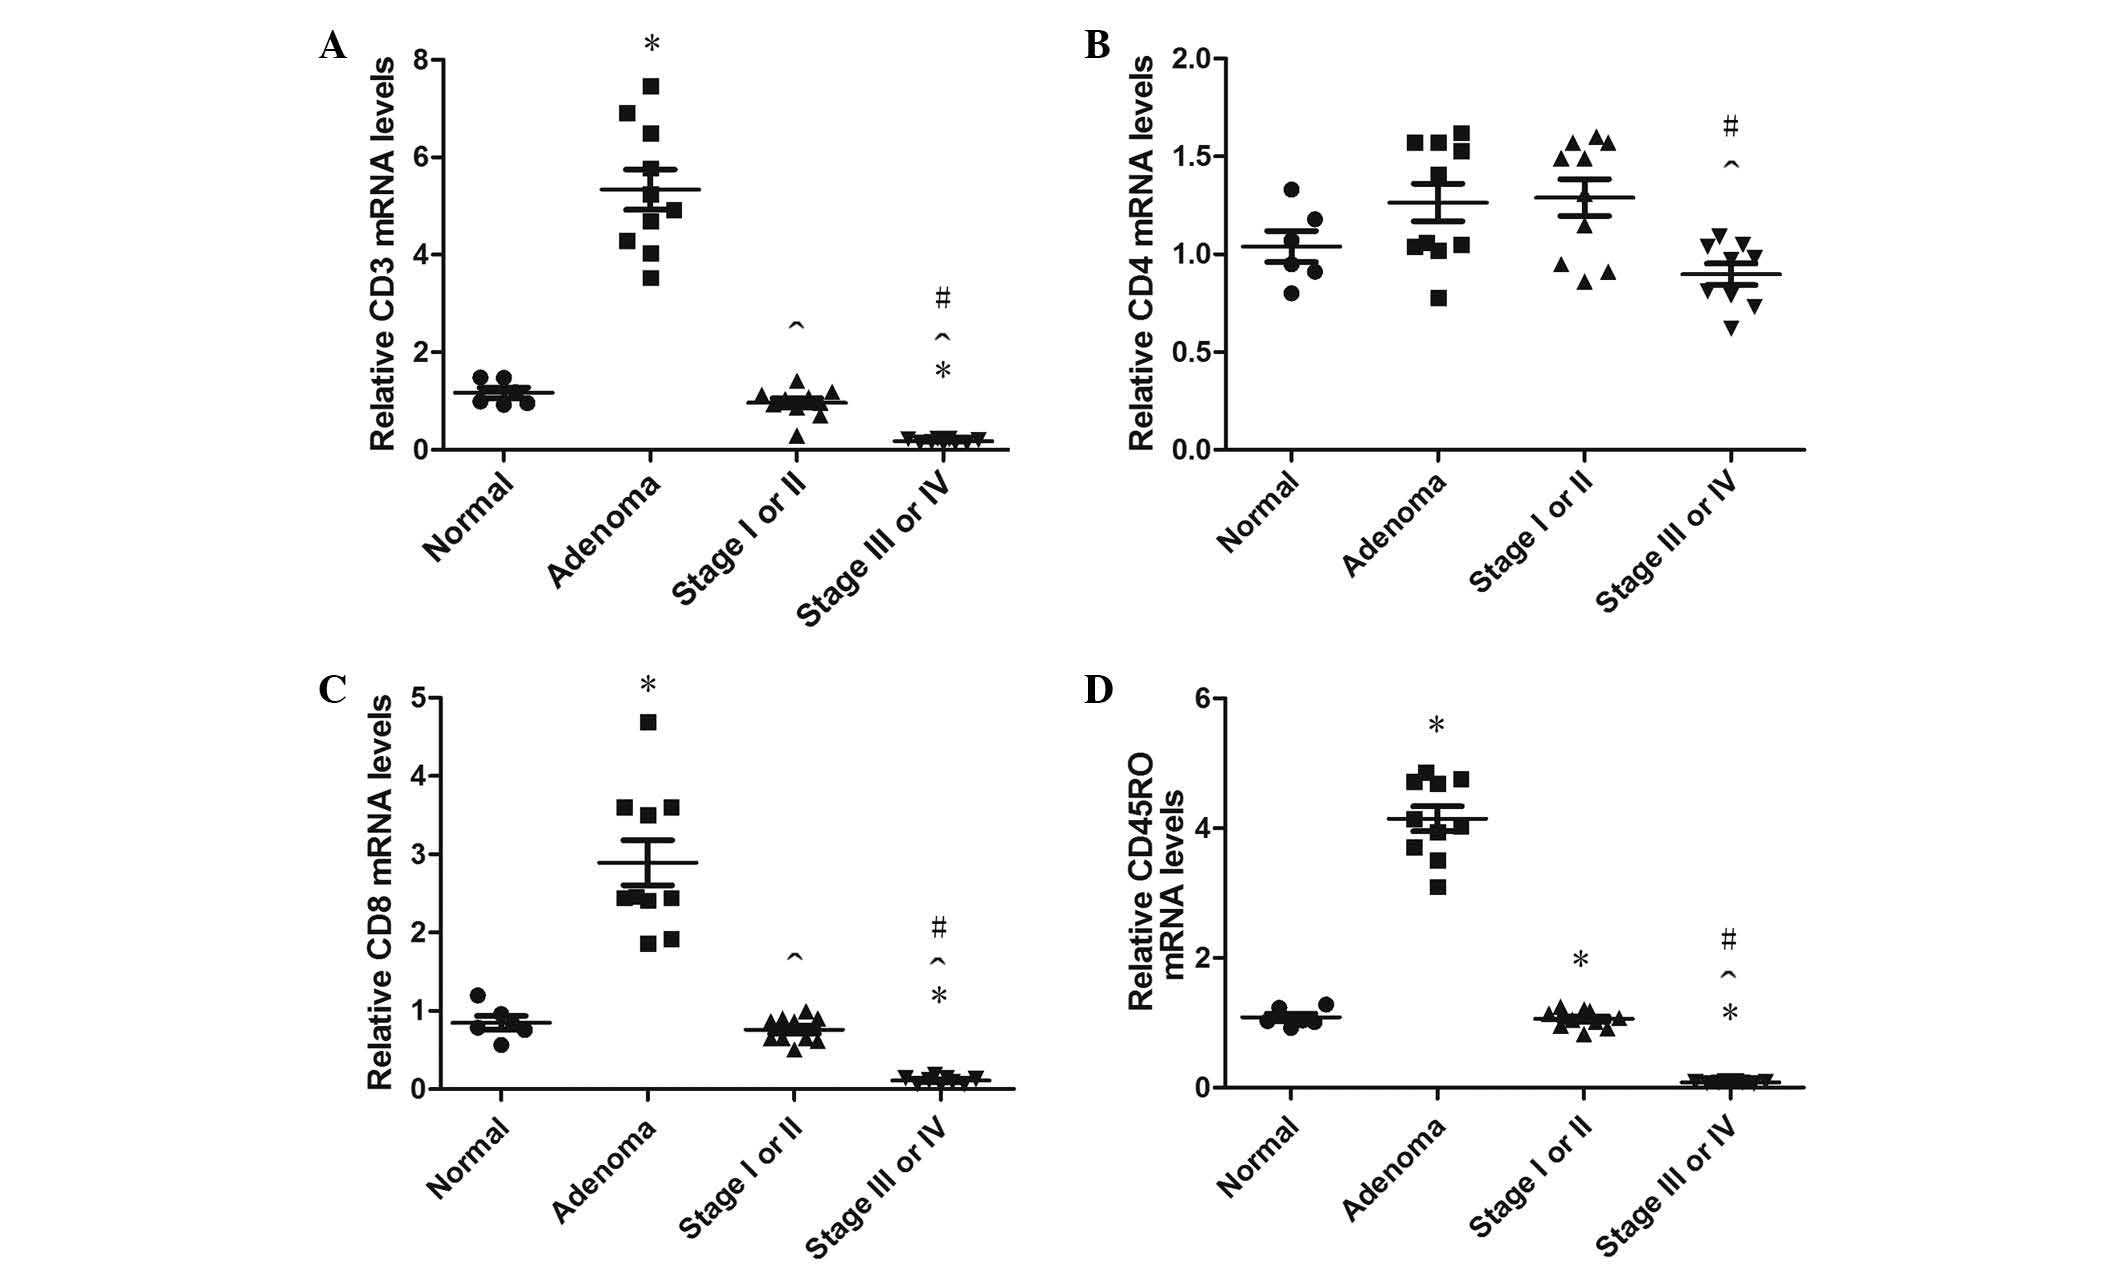
Expression of CD3, CD4, CD8, CD45RO,
CEACAM6 and FOXP3 mRNA
A total of 50 randomly selected paraffin-embedded
colon tissues were obtained from 120 specimens, which including 9
normal colon tissues, 13 adenoma tissues, 14 stage I–II colon
cancer tissues and 14 stage III–IV colon cancer tissues. The
overall mRNA extraction yield from the formalin-fixed,
paraffin-embedded colon tissues was 70% (35/50), and the extraction
yields of mRNA from the normal colon, adenoma, stage I–II colon
cancer and stage III–IV colon cancer tissue specimens were 66.7%
(6/9), 76.9% (10/13), 71.4% (10/14) and 64.3% (9/14), respectively.
Compared with the normal colon tissues, CD3+,
CD8+ and CD45RO+ T cell infiltrations
increased significantly in colonic adenoma (all P<0.001);
however, there were no significant differences in CD4+ T
cell infiltration density between these two groups (P=0.098).
CD3+, CD8+ and CD45RO+ T cell
infiltrations in colonic adenoma were higher than in stage I–II
cancer tissue (all P<0.001), and CD3+,
CD8+ and CD45RO+ T cell infiltrations in
stage III–IV were lower than in the normal group (P=0.015, P=0.015
and P<0.001, respectively). In agreement with the previous
findings, the infiltration densities of CD3+,
CD4+, CD8+ and CD45RO+ T cells
were also significantly lower in stage III–IV than in stage I–II
cancer tissues (P<0.001, P=0.045, P<0.001 and P<0.001,
respectively). CD3+, CD4+, CD8+
and CD45RO+ T cell infiltration in the adenoma specimens
was higher than in stage III–IV specimens (P=0.026, P=0.026,
P=0.009 and P<0.001, respectively); however, there were no
statistically significant differences between normal and stage I–II
specimens (P=0.583, P=0.583, P=0.735, P=0.895, respectively;
Fig. 4).
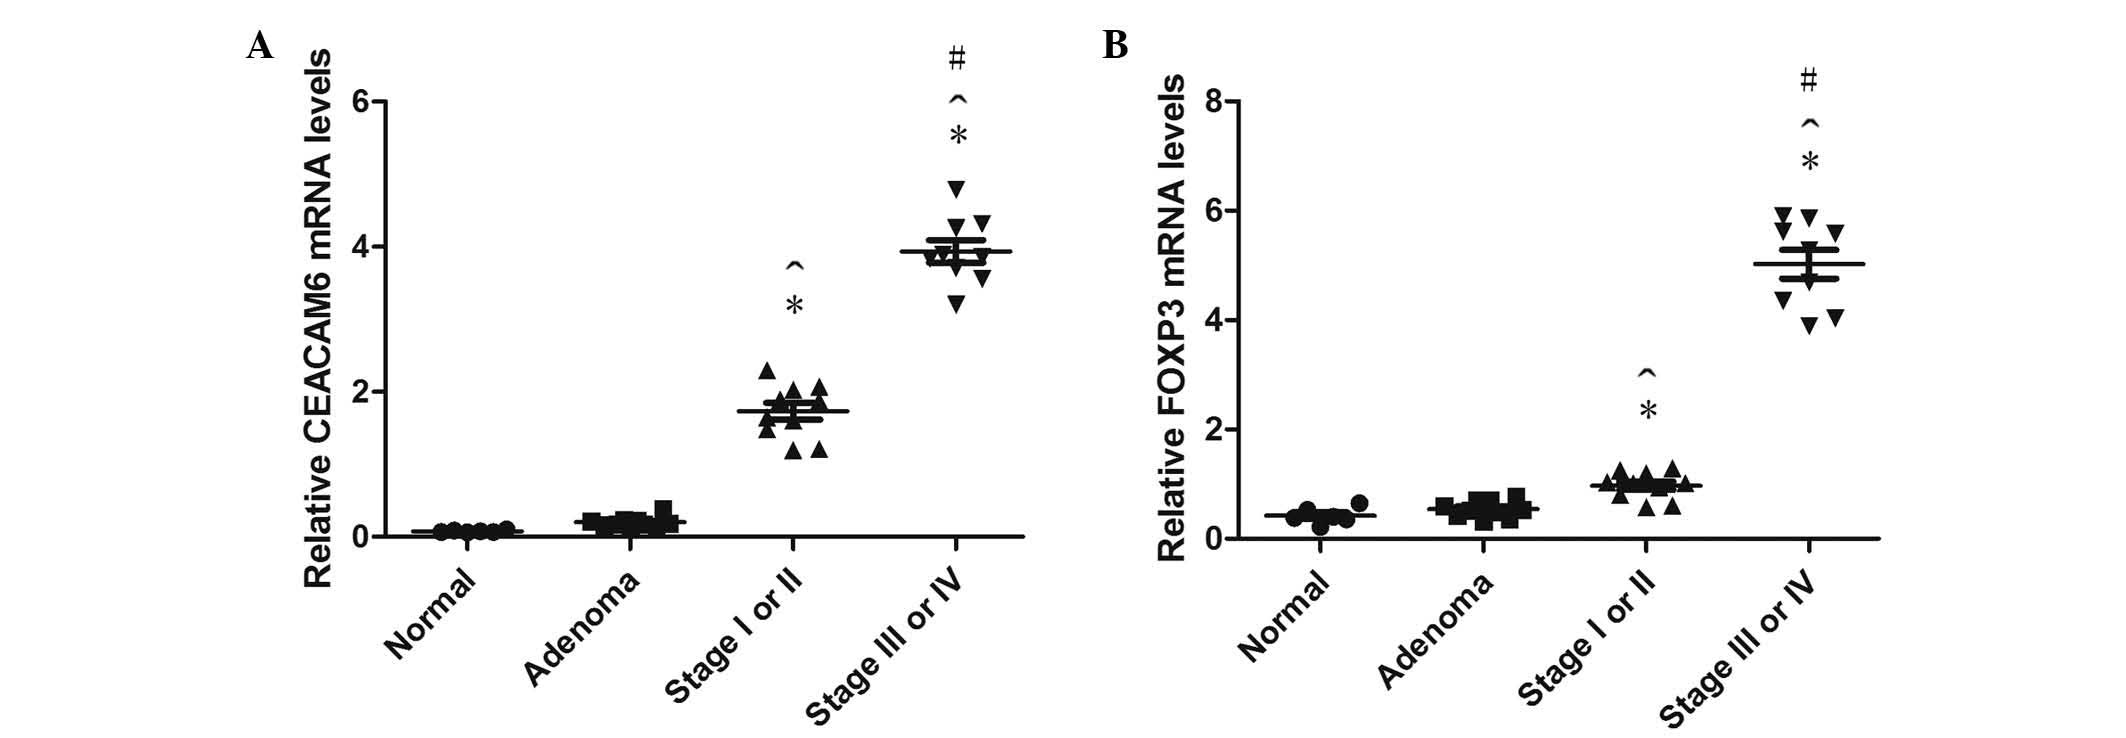
CEACAM6 mRNA expression was higher in stage III–IV
than stage I–II cancer and adenoma tissues (both P<0.001), and
higher in stage I–II compared with adenoma and normal (both
P<0.001), while no obvious differences were identified between
normal and adenoma tissues (P=0.443; Fig.
5).
The relative FOXP3 mRNA expression in stage I–II and
III–IV cancer tissues was significantly higher than in the normal
group (P=0.021 and P<0.001, respectively). In addition, FOXP3
mRNA in stage I–II was higher than the adenoma group (P=0.036);
however, there was no statistically significant difference between
adenoma and normal tissues (P=0.599; Fig.
5).
Discussion
Colorectal cancer is a multistep process, and
growing evidence suggests that cancer progression is not solely
determined by the characteristics of the tumor, but also by the
host response (32). Tumors of the
colon are generally immunogenic and often infiltrated by immune
cells, particularly those of the lymphoid lineage, including
effector/cytotoxic (CD3+ and CD8+) and memory
(CD45RO+) T cells; these cells have been extensively
studied and are associated with the destruction of tumor cells,
reduction of tumor burden and improved clinical prognosis (33,34). A
study on 215 colorectal cancer patients confirmed that TILs are
indeed important clinical and prognostic indicators in colorectal
cancer, irrespective of microsatellite instability status (9).
CD3+, CD8+ and
CD45RO+ T cells that are present in colon cancers have
been suggested to correlate with disease stage and contribute to a
protective role by preventing tumor metastasis and recurrence
(12); concurrently, the current
study demonstrated that T cell infiltrations were markedly higher
in normal tissues compared with advanced colon cancer tissues. Most
importantly, the current findings indicated that CD3+,
CD8+ and CD45RO+ T cell infiltrations were
all notably higher in the colonic adenoma group. CD3+,
CD8+ and CD45RO+ T cell subsets are widely
thought to be indicators of host immune response to tumor cells; in
other words, as the immune response in adenoma was strongest of the
four tissue groups, the microenvironment of adenoma tissue may
induce an appropriate antitumor response to prevent the progression
of the tumor (9). The magnitude of
the immune response was gradually increased from the normal mucosa
to adenoma; but, once the colonic adenoma progressed to colon
cancer, the infiltrations of T cell subsets fell into decline, and
T cell infiltration was lower in stage III–IV cancer than in normal
colonic mucosa. We hypothesize that the constant changes in the
immune reaction from normal to adenoma to colon cancer tissues may
be due to the varying tumor microenvironment, which contributes to
the genomic and epigenomic aberrations of malignant cells,
enhancing carcinoma cell survival, invasion and metastasis.
Recently, there has been an increase research
focusing on FOXP3 and
CD4+CD25+FOXP3+ Tregs. Xu et
al (35) suggest that the
appearance of CD4+CD25+FOXP3+ Treg
infiltration in a cancer nest is a potential independent risk
factor for overall survival, and that FOXP3-positive cancer cells
may be a risk factor for overall survival in colon cancer. Another
study demonstrated that a significantly higher demethylation rate
of the Treg-specific demethylated region of the FOXP3 gene, and
increased expression levels of FOXP3 mRNA and protein, may be
detected in tumor sites compared with adjacent normal tissues
(36). In the present study, FOXP3
expression was upregulated distinctly in colon cancer compared with
normal colonic mucosa; however, there were no significant
differences in normal vs. adenoma or adenoma vs. cancer tissues.
The association between FOXP3 expression and T-cell infiltration
was further analyzed, revealing that high FOXP3 expression was
associated with lower CD3+, CD8+ and
CD45RO+ T cell infiltrations. This suggests that FOXP3
may be involved in escaping immunological surveillance, and
promoting the generation and progression of colon cancer.
FOXP3+ Tregs have the ability to inhibit the T
cell-mediated immune response against tumors in colorectal cancer
(37). A previous study reported that
FOXP3+ T cells in colorectal cancer act as suppressors
of cytotoxic T lymphocytes (CD8+ T cells; CTLs)
(38). Functional studies have also
determined the existence of a tight interplay between the degree of
antitumor immune responses mediated by CTLs and the genetic
instability of tumor cells. CTLs have the ability to kill target
cells upon being exposed to a tumor cell antigen/human leukocyte
antigen complex for which the T cell receptor is specific (39).
In the current study, CEACAM6 expression was
observed to be gradually increased from normal colon to colonic
adenoma to colon cancer tissues. Stefan et al (40) reported that CEACAM6 exhibited a broad
expression zone in proliferating cells in colorectal hyperplastic
polyps and adenomas compared with normal mucosa, which was also
observed in the current study. In addition, the previous study
suggested that upregulation of CEACAM6 and downregulation of
CEACAM7 in polyps and adenomas may represent some of the earliest
observable molecular events leading to colon cancer (40). Furthermore, Blumenthal et al
(22) suggested that CEACAM6 is
directly involved in the adhesion and invasion of colon cancer
cells, and monoclonal antibodies against CEACAM6 may prevent tumor
metastasis. It follows from this that CEACAM6 is a crucial
biological marker associated with disease stage and progression. In
a previous study, Witzens-Harig et al (41) found that CEACAM6 expression in
multiple myeloma patients is important in the inhibition of
CD8+ T cell responses. Combining all of these results,
it is apparent that overexpression of CEACAM6 as a specific antigen
cannot induce an antitumor immune response, and instead may
decrease immune responses.
In summary, T cell infiltrations were observed to be
greater in colonic adenoma compared with normal tissue, and began
to decrease in colon cancer, indicating that the immune response
varies between different stages of colon cancer development and
progression. FOXP3 and CEACAM6 expression gradually increased from
normal colonic mucosa to colonic adenoma to colon cancer; both
molecules function in promoting tumor growth and metastasis. The
results obtained in the present study indicate that FOXP3, CEACAM6
and T cell infiltration are closely associated with the occurrence
and development of colon cancer. Thus, they may be potential
surrogate biomarkers of colon cancer. Targeted drugs against
CEACAM6 and FOXP3, as well as other related biological treatments,
may prove to be promising in future research.
Acknowledgements
This study was supported by the National Natural
Science Foundation of China (grant no. K112219911), the Natural
Science Foundation of Jiangsu Province of China (grant no.
BK2008171) and the Natural Science Foundation of the Jiangsu Higher
Education Institutions of China (grant no. SZ12204211).
References
|
1
|
Siegel R, Ma J, Zou Z and Jemal A: Cancer
statistics, 2014. CA Cancer J Clin. 64:9–29. 2014. View Article : Google Scholar : PubMed/NCBI
|
|
2
|
Jemal A, Bray F, Center MM, Ferlay J, Ward
E and Forman D: Global cancer statistics. CA Cancer J Clin.
61:69–90. 2011. View Article : Google Scholar : PubMed/NCBI
|
|
3
|
Tominaga O, Nita ME, Nagawa H, Fujii S,
Tsuruo T and Muto T: Expressions of cell cycle regulators in human
colorectal cancer cell lines. Jpn J Cancer Res. 88:855–860. 1997.
View Article : Google Scholar : PubMed/NCBI
|
|
4
|
Rupnarain C, Dlamini Z, Naicker S and
Bhoola K: Colon cancer: Genomics and apoptotic events. Biol Chem.
385:449–464. 2004. View Article : Google Scholar : PubMed/NCBI
|
|
5
|
Karin M: NF-kappaB and cancer: Mechanisms
and targets. Mol Carcinog. 45:355–361. 2006. View Article : Google Scholar : PubMed/NCBI
|
|
6
|
Whisenant J and Bergsland E:
Anti-angiogenic strategies in gastrointestinal malignancies. Curr
Treat Options Oncol. 6:411–421. 2005. View Article : Google Scholar : PubMed/NCBI
|
|
7
|
Pancione M, Giordano G, Remo A, Febbraro
A, Sabatino L, Manfrin E, Ceccarelli M and Colantuoni V: Immune
escape mechanisms in colorectal cancer pathogenesis and liver
metastasis. J Immunol Res. 2014:6868792014. View Article : Google Scholar : PubMed/NCBI
|
|
8
|
Yamauchi M, Lochhead P, Morikawa T,
Huttenhower C, Chan AT, Giovannucci E, Fuchs C and Ogino S:
Colorectal cancer: A tale of two sides or a continuum? Gut.
61:794–797. 2012. View Article : Google Scholar : PubMed/NCBI
|
|
9
|
Deschoolmeester V, Baay M, Van Marck E,
Weyler J, Vermeulen P, Lardon F and Vermorken JB: Tumor
infiltrating lymphocytes: An intriguing player in the survival of
colorectal cancer patients. BMC Immunol. 11:192010. View Article : Google Scholar : PubMed/NCBI
|
|
10
|
Pagès F, Berger A, Camus M, Sanchez-Cabo
F, Costes A, Molidor R, Mlecnik B, Kirilovsky A, Nilsson M, Damotte
D, et al: Effector memory T cells, early metastasis and survival in
colorectal cancer. N Engl J Med. 353:2654–2666. 2005. View Article : Google Scholar : PubMed/NCBI
|
|
11
|
Titu LV, Monson JR and Greenman J: The
role of CD8(+) T cells in immune responses to colorectal cancer.
Cancer Immunol Immunother. 51:235–247. 2002. View Article : Google Scholar : PubMed/NCBI
|
|
12
|
Chew A, Salama P, Robbshaw A, Klopcic B,
Zeps N, Platell C and Lawrance IC: SPARC, FOXP3, CD8 and CD45
correlation with disease recurrence and long-term disease-free
survival in colorectal cancer. PLoS One. 6:e220472011. View Article : Google Scholar : PubMed/NCBI
|
|
13
|
Shevach EM: Mechanisms of foxp3+ T
regulatory cell-mediated suppression. Immunity. 30:636–645. 2009.
View Article : Google Scholar : PubMed/NCBI
|
|
14
|
Xia M, Zhao MQ, Wu K, Lin XY, Liu Y and
Qin YJ: Investigations on the clinical significance of FOXP3
protein expression in cervical oesophageal cancer and the number of
FOXP3+ tumour-infiltrating lymphocytes. J Int Med Res.
41:1002–1008. 2013. View Article : Google Scholar : PubMed/NCBI
|
|
15
|
Kobayashi N, Kubota K, Kato S, Watanabe S,
Shimamura T, Kirikoshi H, Saito S, Ueda M, Endo I, Inayama Y, et
al: FOXP3+ regulatory T cells and tumoral indoleamine
2,3-dioxygenase expression predicts the carcinogenesis of
intraductal papillary mucinous neoplasms of the pancreas.
Pancreatology. 10:631–640. 2010. View Article : Google Scholar : PubMed/NCBI
|
|
16
|
Matsuura K, Yamaguchi Y, Osaki A, Ohara M,
Okita R, Emi A, Murakami S and Arihiro K: FOXP3 expression of
micrometastasis-positive sentinel nodes in breast cancer patients.
Oncol Rep. 22:1181–1187. 2009. View Article : Google Scholar : PubMed/NCBI
|
|
17
|
Kobayashi N, Hiraoka N, Yamagami W, Ojima
H, Kanai Y, Kosuge T, Nakajima A and Hirohashi S: FOXP3+ regulatory
T cells affect the development and progression of
hepatocarcinogenesis. Clin Cancer Res. 13:902–911. 2007. View Article : Google Scholar : PubMed/NCBI
|
|
18
|
Curiel TJ, Coukos G, Zou L, Alvarez X,
Cheng P, Mottram P, Evdemon-Hogan M, Conejo-Garcia JR, Zhang L,
Burow M, et al: Specific recruitment of regulatory T cells in
ovarian carcinoma fosters immune privilege and predicts reduced
survival. Nat Med. 10:942–949. 2004. View
Article : Google Scholar : PubMed/NCBI
|
|
19
|
Gemei M, Mirabelli P, Di Noto R, Corbo C,
Iaccarino A, Zamboli A, Troncone G, Galizia G, Lieto E, Del Vecchio
L and Salvatore F: CD66c is a novel marker for colorectal cancer
stem cell isolation and its silencing halts tumor growth in
vivo. Cancer. 119:729–738. 2013. View Article : Google Scholar : PubMed/NCBI
|
|
20
|
Duxbury MS, Ito H, Zinner MJ, Ashley SW
and Whang EE: CEACAM6 gene silencing impairs anoikis resistance and
in vivo metastatic ability of pancreatic adenocarcinoma
cells. Oncogene. 23:465–473. 2004. View Article : Google Scholar : PubMed/NCBI
|
|
21
|
Kim KS, Kim JT, Lee SJ, Kang MA, Choe IS,
Kang YH, Kim SY, Yeom YI, Lee YH, Kim JH, et al: Overexpression and
clinical significance of carcinoembryonic antigen-related cell
adhesion molecule 6 in colorectal cancer. Clin Chim Acta.
415:12–19. 2013. View Article : Google Scholar : PubMed/NCBI
|
|
22
|
Blumenthal RD, Hansen HJ and Goldenberg
DM: Inhibition of adhesion, invasion and metastasis by antibodies
targeting CEACAM6 (NCA-90) and CEACAM5 (carcinoembryonic antigen).
Cancer Res. 65:8809–8817. 2005. View Article : Google Scholar : PubMed/NCBI
|
|
23
|
Duxbury MS, Ito H, Benoit E, Waseem T,
Ashley SW and Whang EE: A novel role for carcinoembryonic
antigen-related cell adhesion molecule 6 as a determinant of
gemcitabine chemoresistance in pancreatic adenocarcinoma cells.
Cancer Res. 64:3987–3993. 2004. View Article : Google Scholar : PubMed/NCBI
|
|
24
|
Kobayashi M, Miki Y, Ebina M, Abe K, Mori
K, Narumi S, Suzuki T, Sato I, Maemondo M, Endo C, et al:
Carcinoembryonic antigen-related cell adhesion molecules as
surrogate markers for EGFR inhibitor sensitivity in human lung
adenocarcinoma. Br J Cancer. 107:1745–1753. 2012. View Article : Google Scholar : PubMed/NCBI
|
|
25
|
Litkouhi B, Litkouhi B, Fleming E, Welch
WR, Berkowitz RS, Birrer MJ and Mok SC: Overexpression of CEACAM6
in borderline and invasive mucinous ovarian neoplasms. Gynecol
Oncol. 109:234–239. 2008. View Article : Google Scholar : PubMed/NCBI
|
|
26
|
Oue N, Hamai Y, Mitani Y, Matsumura S,
Oshimo Y, Aung PP, Kuraoka K, Nakayama H and Yasui W: Gene
expression profile of gastric carcinoma: Identification of genes
and tags potentially involved in invasion, metastasis and
carcinogenesis by serial analysis of gene expression. Cancer Res.
64:2397–2405. 2004. View Article : Google Scholar : PubMed/NCBI
|
|
27
|
Jantscheff P, Terracciano L, Lowy A,
Glatz-Krieger K, Grunert F, Micheel B, Brümmer J, Laffer U, Metzger
U, Herrmann R and Rochlitz C: Expression of CEACAM6 in resectable
colorectal cancer: A factor of independent prognostic significance.
J Clin Oncol. 21:3638–3646. 2003. View Article : Google Scholar : PubMed/NCBI
|
|
28
|
Maraqa L, Cummings M, Peter MB, Shaaban
AM, Horgan K, Hanby AM and Speirs V: Carcinoembryonic antigen cell
adhesion molecule 6 predicts breast cancer recurrence following
adjuvant tamoxifen. Clin Cancer Res. 14:405–411. 2008. View Article : Google Scholar : PubMed/NCBI
|
|
29
|
Edge SB, Byrd DR, Compton CC, Fritz AG,
Greene FL and Trotti A: AJCC Cancer Staging Manual (7th). Springer.
New York, NY: 2010.
|
|
30
|
Ma Y, Ma L, Guo Q and Zhang S: Expression
of bone morphogenetic protein-2 and its receptors in epithelial
ovarian cancer and their influence on the prognosis of ovarian
cancer patients. J Exp Clin Cancer Res. 29:852010. View Article : Google Scholar : PubMed/NCBI
|
|
31
|
Livak KJ and Schmittgen TD: Analysis of
relative gene expression data using real-time quantitative PCR and
the 2(−Delta Delta C(T)) method. Methods. 25:402–408. 2001.
View Article : Google Scholar : PubMed/NCBI
|
|
32
|
Canna K, McArdle PA, McMillan DC, McNicol
AM, Smith GW, McKee RF and McArdle CS: The relationship between
tumour T-lymphocyte infiltration, the systemic inflammatory
response and survival in patients undergoing curative resection for
colorectal cancer. Br J Cancer. 92:651–654. 2005. View Article : Google Scholar : PubMed/NCBI
|
|
33
|
Nosho K, Baba Y, Tanaka N, Shima K,
Hayashi M, Meyerhardt JA, Giovannucci E, Dranoff G, Fuchs CS and
Ogino S: Tumour-infiltrating T-cell subsets, molecular changes in
colorectal cancer and prognosis: Cohort study and literature
review. J Pathol. 222:350–366. 2010. View Article : Google Scholar : PubMed/NCBI
|
|
34
|
Pagès F, Kirilovsky A, Mlecnik B, et al:
In situ cytotoxic and memory T cells predict outcome in patients
with early-stage colorectal cancer. J Clin Oncol. 27:5944–5951.
2009. View Article : Google Scholar : PubMed/NCBI
|
|
35
|
Xu W, Liu H, Song J, Fu HX, Qiu L, Zhang
BF, Li HZ, Bai J and Zheng JN: The appearance of Tregs in cancer
nest is a promising independent risk factor in colon cancer. J
Cancer Res Clin Oncol. 139:1845–1852. 2013. View Article : Google Scholar : PubMed/NCBI
|
|
36
|
Zhuo C, Li Z, Xu Y, et al: Higher
FOXP3-TSDR demethylation rates in adjacent normal tissues in
patients with colon cancer were associated with worse survival. Mol
Cancer. 13:1532014. View Article : Google Scholar : PubMed/NCBI
|
|
37
|
Svensson H, Olofsson V, Lundin S, Yakkala
C, Björck S, Börjesson L, Gustavsson B and Quiding-Järbrink M:
Accumulation of CCR4+CTLA-4 FOXP3+CD25(hi)
regulatory T cells in colon adenocarcinomas correlate to reduced
activation of conventional T cells. PLoS One. 7:e306952012.
View Article : Google Scholar : PubMed/NCBI
|
|
38
|
Deschoolmeester V, Baay M, Lardon F,
Pauwels P and Peeters M: Immune cells in colorectal cancer:
Prognostic relevance and role of MSI. Cancer Microenviron.
4:377–392. 2011. View Article : Google Scholar : PubMed/NCBI
|
|
39
|
Viguier M, Lemaître F, Verola O, Cho MS,
Gorochov G, Dubertret L, Bachelez H, Kourilsky P and Ferradini L:
Foxp3 expressing CD4+CD25(high) regulatory T cells are
overrepresented in human metastatic melanoma lymph nodes and
inhibit the function of infiltrating T cells. J Immunol.
173:1444–1453. 2004. View Article : Google Scholar : PubMed/NCBI
|
|
40
|
Stefan Schölzel, Wolfgang Zimmermann,
Georg Schwarzkopf, Fritz Grunert, Brigitta Rogaczewski and John
Thompson: Carcinoembryonic antigen family members CEACAM6 and
CEACAM7 are differentially expressed in normal tissues and
oppositely deregulated in hyperplastic colorectal polyps and early
adenomas. Am J Pathol. 156:595–605. 2000. View Article : Google Scholar : PubMed/NCBI
|
|
41
|
Witzens-Harig M, Hose D, Jünger S,
Pfirschke C, Khandelwal N, Umansky L, Seckinger A, Conrad H,
Brackertz B, Rème T, et al: Tumor cells in multiple myeloma
patients inhibit myeloma-reactive T cells through carcinoembryonic
antigen-related cell adhesion molecule-6. Blood. 121:4493–4503.
2013. View Article : Google Scholar : PubMed/NCBI
|