Introduction
Accumulating data have indicated the significance of
anti-tumor immune responses in the prognosis of patients with
various types of cancer (1,2). Tumor infiltrating lymphocytes (TILs)
were shown to be associated with the prognoses of patients with
colorectal cancer (CRC), and are also considered to be important as
a predictor for the therapeutic response to chemotherapy and
radiotherapy (3–7). Although immunotherapy using peptide
vaccines is expected to be a promising method to treat cancer, it
is not established as a treatment modality due to its lack of
efficacy. Several mechanisms to protect cancer cells from host
immune attacks in tumor tissues have been proposed (8–10). For
example, the limitation of anti-tumor effects by cytotoxic T
lymphocytes was partly explained by: i) Downregulation or loss of
expression of human leukocyte antigen (HLA) or targeted antigen
proteins; ii) upregulation of programmed death-ligand 1 by tumor
cells; iii) suppression of immune responses by production of the
tryptophan catabolic enzyme indoleamine 2,3-dioxygenase by
dendritic cells and macrophages; iv) accumulation of regulatory T
cells; v) loss of the costimulatory molecules cluster of
differentiation CD80 and CD86, which are ligands of CD28 and
essential in inducing immune responses; and vi) production of
strong immunosuppressive cytokines, including interleukin (IL)-6,
IL-10 and transforming growth factor-β. TILs are one of the key
factors that define the tumor microenvironment and may act as a
predictive biomarker for the response to immunotherapy. However,
the majority of previous studies focus on the quantification of the
number of TILs or CD8+ cells in tumors, without an
examination of the functional or clonal characteristics that confer
to anti-tumor immune effects (3–7).
Characterizing the T cell repertoire in detail is essential to
improve the understanding of the tumor microenvironment that is
associated with the clinical responses to various cancer therapies.
In addition, monitoring the immune responses in cancer patients
during the treatment is also important.
In humans, the majority (~95%) of T lymphocytes
carry T cell receptors (TCRs), which consists of a heterodimer of
an α-chain and a β-chain (11). The
high degree of the diversity in TCRs is generated by a somatic
recombination process of variable (V), diversity (D) (only for
β-chain) and joining (J) exons, termed the V(D)J recombination
(11). Random trimming and the
addition of non-template nucleotides at the junction site
significantly increase the TCR diversity. The rearrangement of the
V, (D) and J segments defines the highly variable complementarity
determining region 3 (CDR3), which is critical to characterize the
antigen recognition specificity of individual T cell clones
(12). A repertoire of
1015–18 various TCRs may be generated in humans
(13,14). Therefore, the characterization of the
TCR in TILs may reveal important information regarding the
biologically important anti-tumor T cell responses (15). In the present study, the T cell
repertoire was analyzed in blood samples and cancer tissues in
advanced CRC patients that had received cancer vaccine treatment,
with the aim of exploring predictive biomarkers for the efficacy
prior to treatment, and for selecting of patients that are likely
to exhibit better clinical outcomes.
Materials and methods
Patients
Due to the availability of surgical specimens, 9 out
of 96 patients with advanced CRC that were enrolled in a previous
phase II study (FXV study)were selected for the present study
(16). All patients in the present
study were enrolled at Yamaguchi University Hospital (Ube, Japan)
between February 2009 and November 2012. A total of 17 tumor
tissues from the surgical resection of primary or metastatic CRCs
and 39 blood samples were collected, as summarized in Table I. Pre- and post-treatment tumor
tissues were collected from 6 patients. Blood samples were
collected at various time points, and peripheral blood mononuclear
cells (PBMCs) were isolated from whole blood using Ficoll-Paque
PLUS (GE Healthcare Bio-Sciences, Pittsburgh, PA, USA). The present
study was approved by the Institutional Review Boards of the
University of Chicago (Chicago, IL, USA; approval no., 13-0797) and
Yamaguchi University (Ube, Japan; approval no., H23-135).
 | Table I.Characteristics of patients with CRC
and time points of sample collection. |
Table I.
Characteristics of patients with CRC
and time points of sample collection.
| Patient | Age, years | Gender | Response | Progression-free
survival, months | Outcome | Time of tumor
collection, type (weeksa) | Time of blood
collection, weeksa |
|---|
| CRC1 | 55 | Male | PR | 9.6 | Succumbed | Colon (−6), liver
(83) | 0, 4, 8, 35, 59 |
| CRC2 | 47 | Female | SD | 8.4 | Succumbed | Colon (−79), pancreas
(17) | 0, 4, 35 |
| CRC3 | 66 | Male | SD | 23.8 | Alive | Colon (−142), lung
(97) | 0, 4, 12, 35, 87 |
| CRC4 | 61 | Male | PR | 13.7 | Alive | Colon (−5), liver
(63) | 0, 4, 19, 35, 59 |
| CRC5 | 36 | Male | PR | 17.8 | Alive | Colon (61) | 0, 4, 19, 35 |
| CRC6 | 47 | Female | PR | 9.4 | Alive | Colon (−4), liver
(39) | 0, 5, 19, 35, 77 |
| CRC7 | 65 | Female | PR | 5.2 | Succumbed | Colon (17) | 0, 4, 8, 19 |
| CRC8 | 42 | Male | PR | 11.8 | Alive | Colon (27), lung
(27), pelvis (55) | 0, 4, 8, 23,
44 |
| CRC9 | 69 | Female | PR |
9.5 | Alive | Colon (−3), small
intestine (33) | 0, 4, 19 |
Library preparation
The libraries for TCR sequencing were prepared
according to a previously established method (17). Total RNA was extracted from tumor
tissues and PBMCs using an RNeasy Mini kit (Qiagen, Inc., Valencia,
CA, USA) with DNase treatment. Complementary DNA (cDNA) with the
5′-RACE adapter was synthesized using the SMART cDNA Library
Construction kit and Advantage 2 Polymerase (Clontech Laboratories,
Inc., Mountainview, CA, USA) following the manufacturer's protocol.
Second-round polymerase chain reaction (PCR) was performed using
the Platinum PCR SuperMix High Fidelity (Thermo Fisher Scientific,
Waltham, MA, USA) with a forward fusion-primer, consisting of an
Ion Torrent trP1 adaptor sequence and 5′ universal primer sequence,
and a reverse fusion-primer consisting of an Ion Torrent A adaptor
and specific sequence to the C region of the TCR-α or TCR-β
(17). The amplification thermocycle
consisted of: 3 min at 94°C; and 40 cycles of 30 sec at 94°C, 30
sec at 65°C and 1 min at 68°C; followed by purification using
AMPure XP (Beckman Coulter, Inc., Brea, CA, USA) to obtain a final
library. The sequencing templates were prepared on the OneTouch2
system and subjected to DNA sequencing on the Ion PGM sequencer
using the Ion PGM Sequencing 400 kit and Ion 318 Chip kit v2
(Thermo Fisher Scientific).
Sequencing analysis
Raw fastq files were analyzed using Tcrip software
(17). Briefly, each of the reads was
separately mapped to the International ImMunoGeneTics reference
sequences of the V, J and constant (C) gene segments of TCR-α or
TCR-β using the Bowtie 2 aligner, version 2.1.0 (18,19). Among
the reads that were properly mapped to the V, J and C segments, a
junction sequence between the V and J segments in the read was
analyzed for TCR-α and TCR-β. For TCR-α, the junction sequence was
recognized as an N segment. For TCR-β, a D segment in the junction
sequence was searched by scoring similarities of sub-sequences of
the junction sequences with the reference sequences of D segments
using a sliding window method (20),
and then N1 and N2 segments were determined. Following the
decomposition of reads into the V, D, J and C segments, the amino
acid sequences of the CDR3 regions were determined, starting with
the second conserved cysteine in the V segment and ending with the
conserved phenylalanine in the J segment.
Statistical analysis
Correlation coefficient and TCR diversity was
compared using the Student's t-test. P<0.05 was considered to
indicate a statistically significant difference. Pearson's
correlation was used for correlation analysis All statistical
analyses were performed using the R statistical environment version
2.15.2 (available from, www.r-project.org).
Results
TCR sequencing of tumor and blood
samples from advanced CRC patients
The sequences of TCR-α and TCR-β cDNAs were prepared
from a total of 56 samples (17 tumor tissue samples and 39 blood
samples) at different time points, which were obtained from 9
patients with advanced CRC that were treated with cancer vaccines,
were analyzed (Table I). Through cDNA
sequencing of TCR, on average 550,116±422,311 and 215,160±243,900
reads mapped to V(D)J and C segments were obtained for TCR-α and
TCR-β, respectively. From the analysis of these reads,
32,608±28,216 unique clonotypes for TCR-α and 28,693±29,361 unique
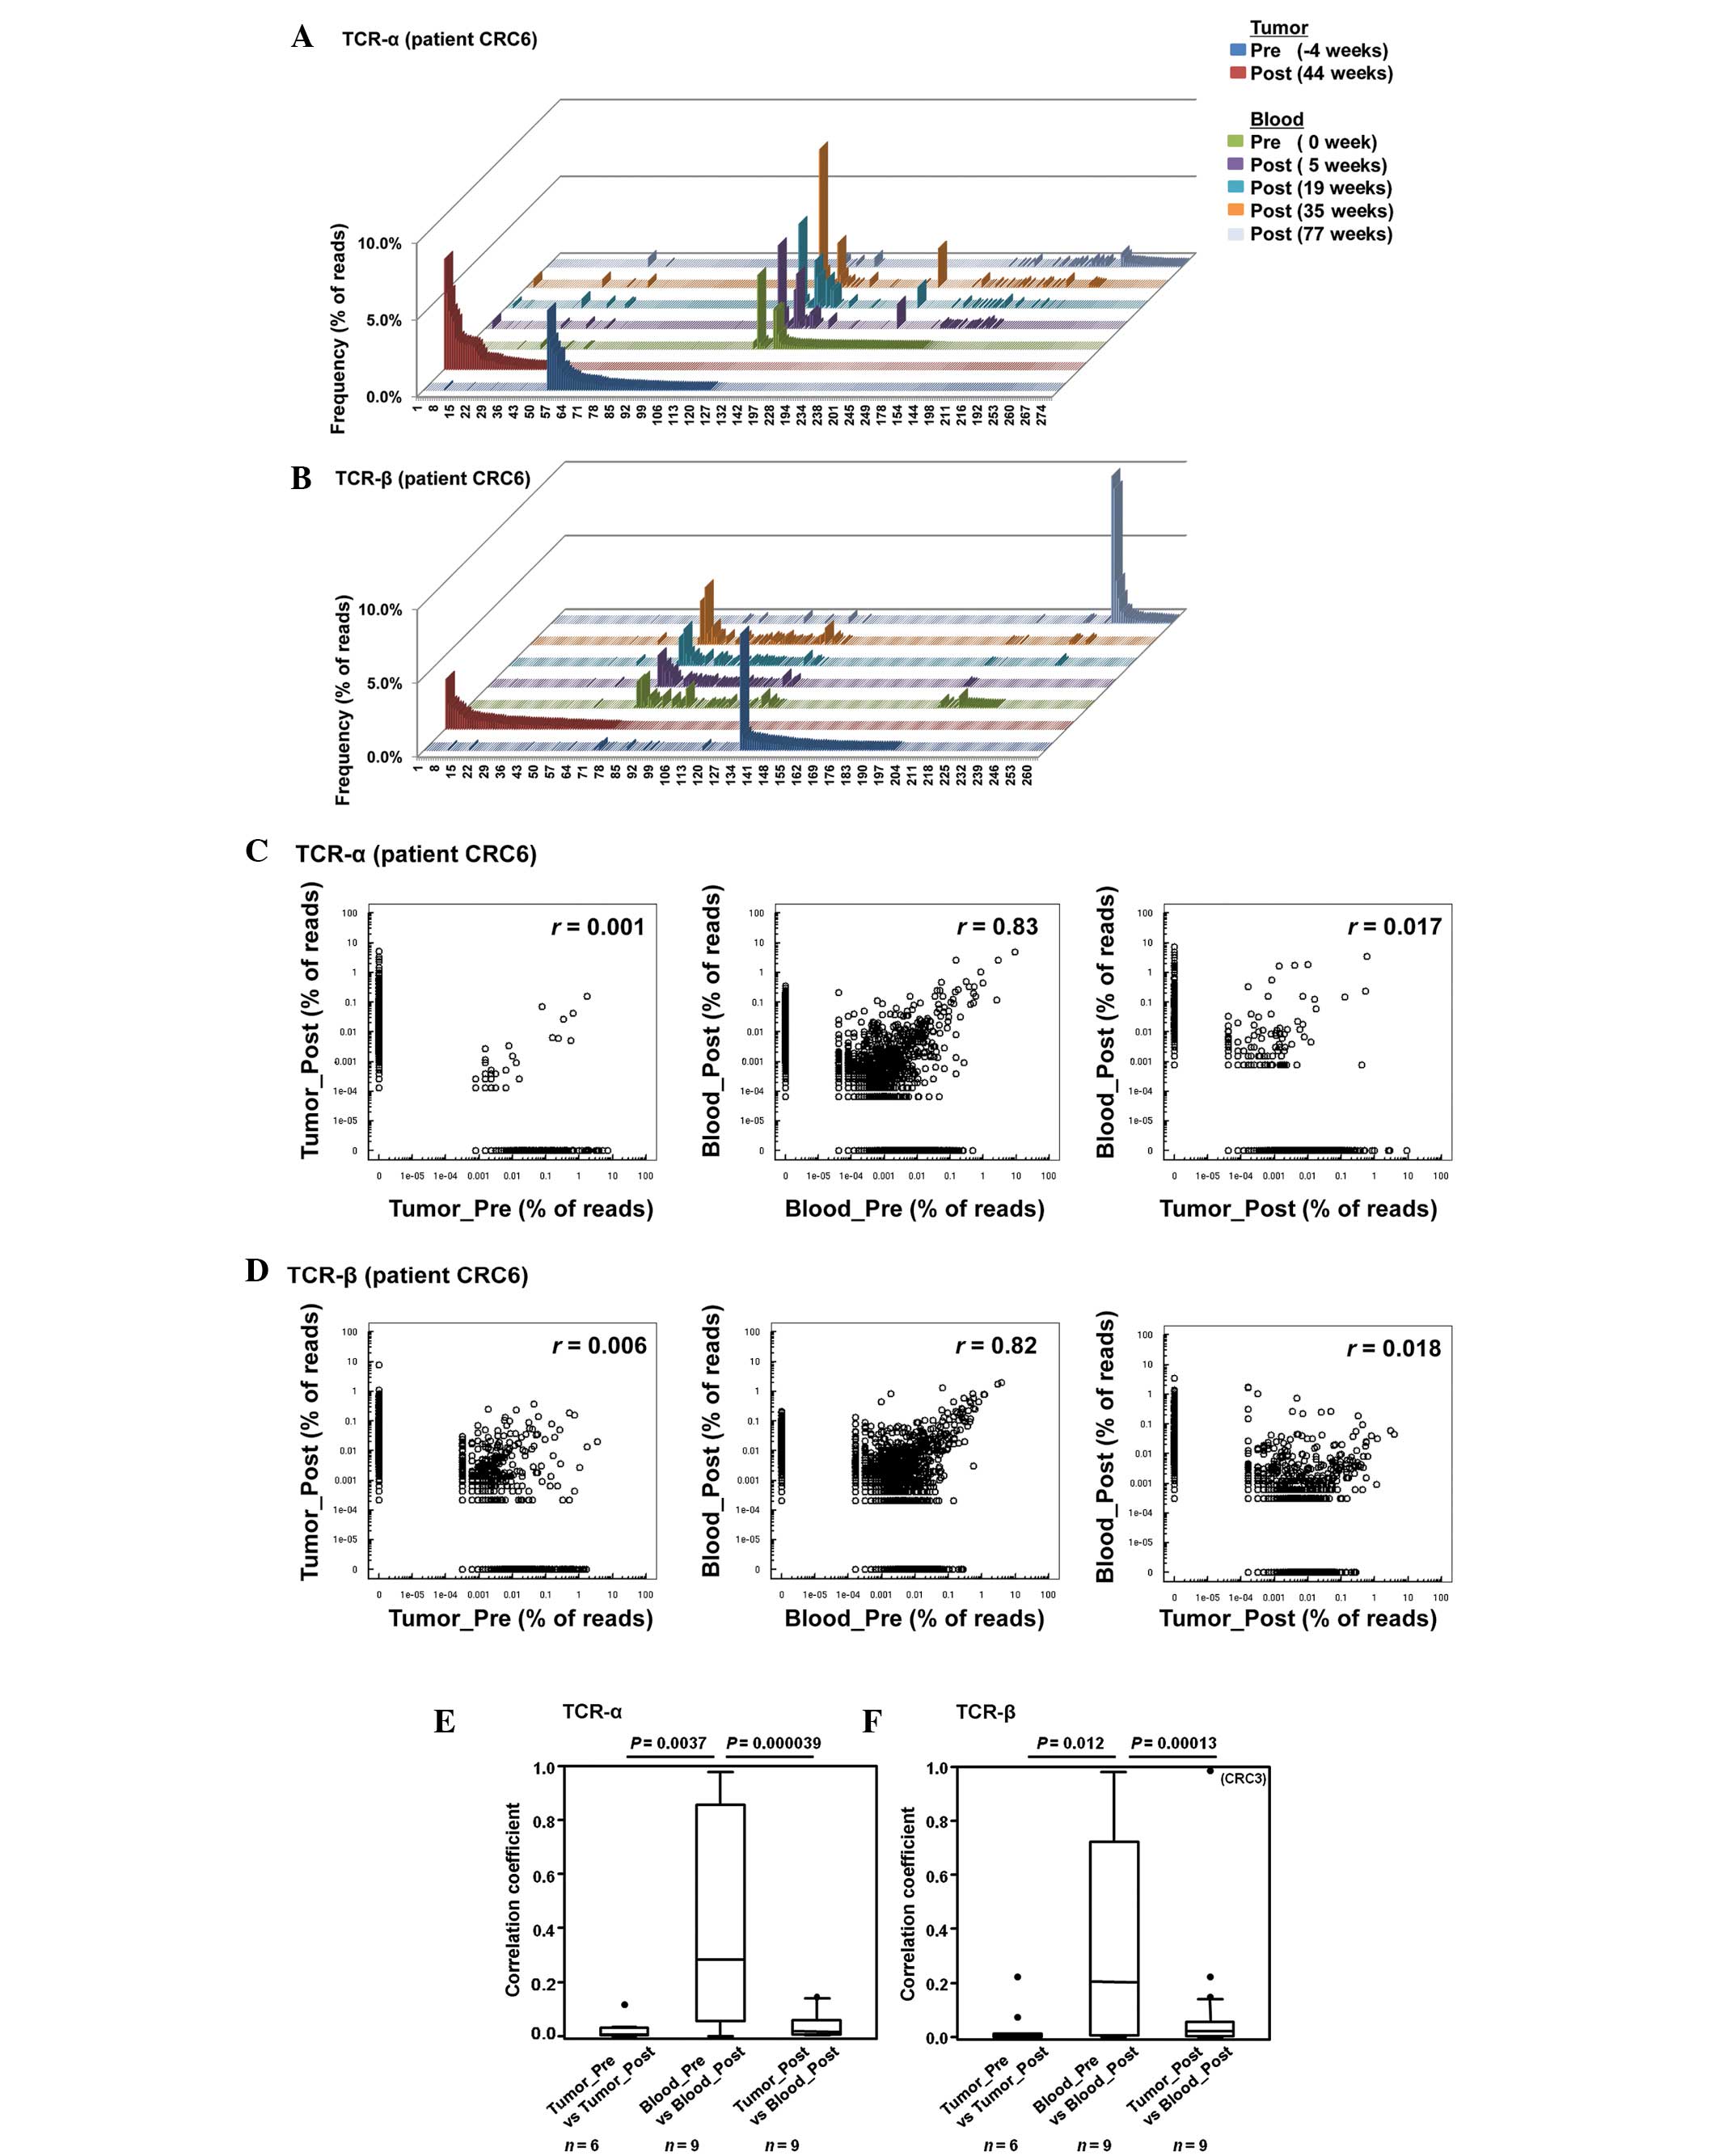
clonotypes for TCR-β were identified. Fig. 1A–D shows the representative results of
patient CRC6. Enrichment of certain TCR sequences was observed in
the tumor tissues and blood. However, the majority of enriched
sequences with a frequency of >0.5% in pre- or post-treatment
tumor samples were not commonly detected in these samples, and were
not identified in TCR sequence reads in the blood samples of the
same patients (Fig. 1A and B).
By applying the correlation analysis, a strong
correlation was indicated in the TCR clonotypes among pre- and
post-treatment blood samples (correlation coefficients,
r=0.83 and 0.82 for TCR-α and TCR-β, respectively), but no
correlation between pre- and post-treatment tumor tissues
(r=0.001 and 0.006, respectively), or between tumor tissues
and blood samples (r=0.017 and 0.018, respectively) were
indicated (Fig. 1C and D). Similarly,
the median correlation coefficients for comparing between the pre-
and post-treatment tissue samples (n=6), were 0.006 and
0.002 for TCR-α and TCR-β, respectively, and 0.016 and 0.021 for
TCR-α and TCR-β, respectively, in the tumor tissue and blood
comparison (n=9), which were much smaller compared with the
coefficients in the pre- and post-treatment blood comparison
(n=9; 0.28 and 0.20 for TCR-α and TCR-β, respectively)
(Fig. 1E and F).
The heat map in Fig.
1G indicates that TCR sequences enriched in pre-treatment tumor
tissues were undetectable in blood samples; but, notably, TCR
sequences enriched in the post-treatment tumor tissues were
detectable in the blood samples, although their frequencies were as
low as 0.1–0.5%. Particularly, patient CRC3 showed a higher
correlation coefficient between T cells in a post-treatment tumor
tissue and blood sample, which shared an abundant TCR-β clonotype
with TRBV7-2, TRBJ2-7 and CDR3 (sequence,
CASSLDPGWTYEQYF). These results indicate that, although TCR
clonotypes in tumor tissues are almost entirely different from
those in blood samples, several TCR clonotypes enriched in tumor
tissues were commonly observed in circulating lymphocytes during
the treatment.
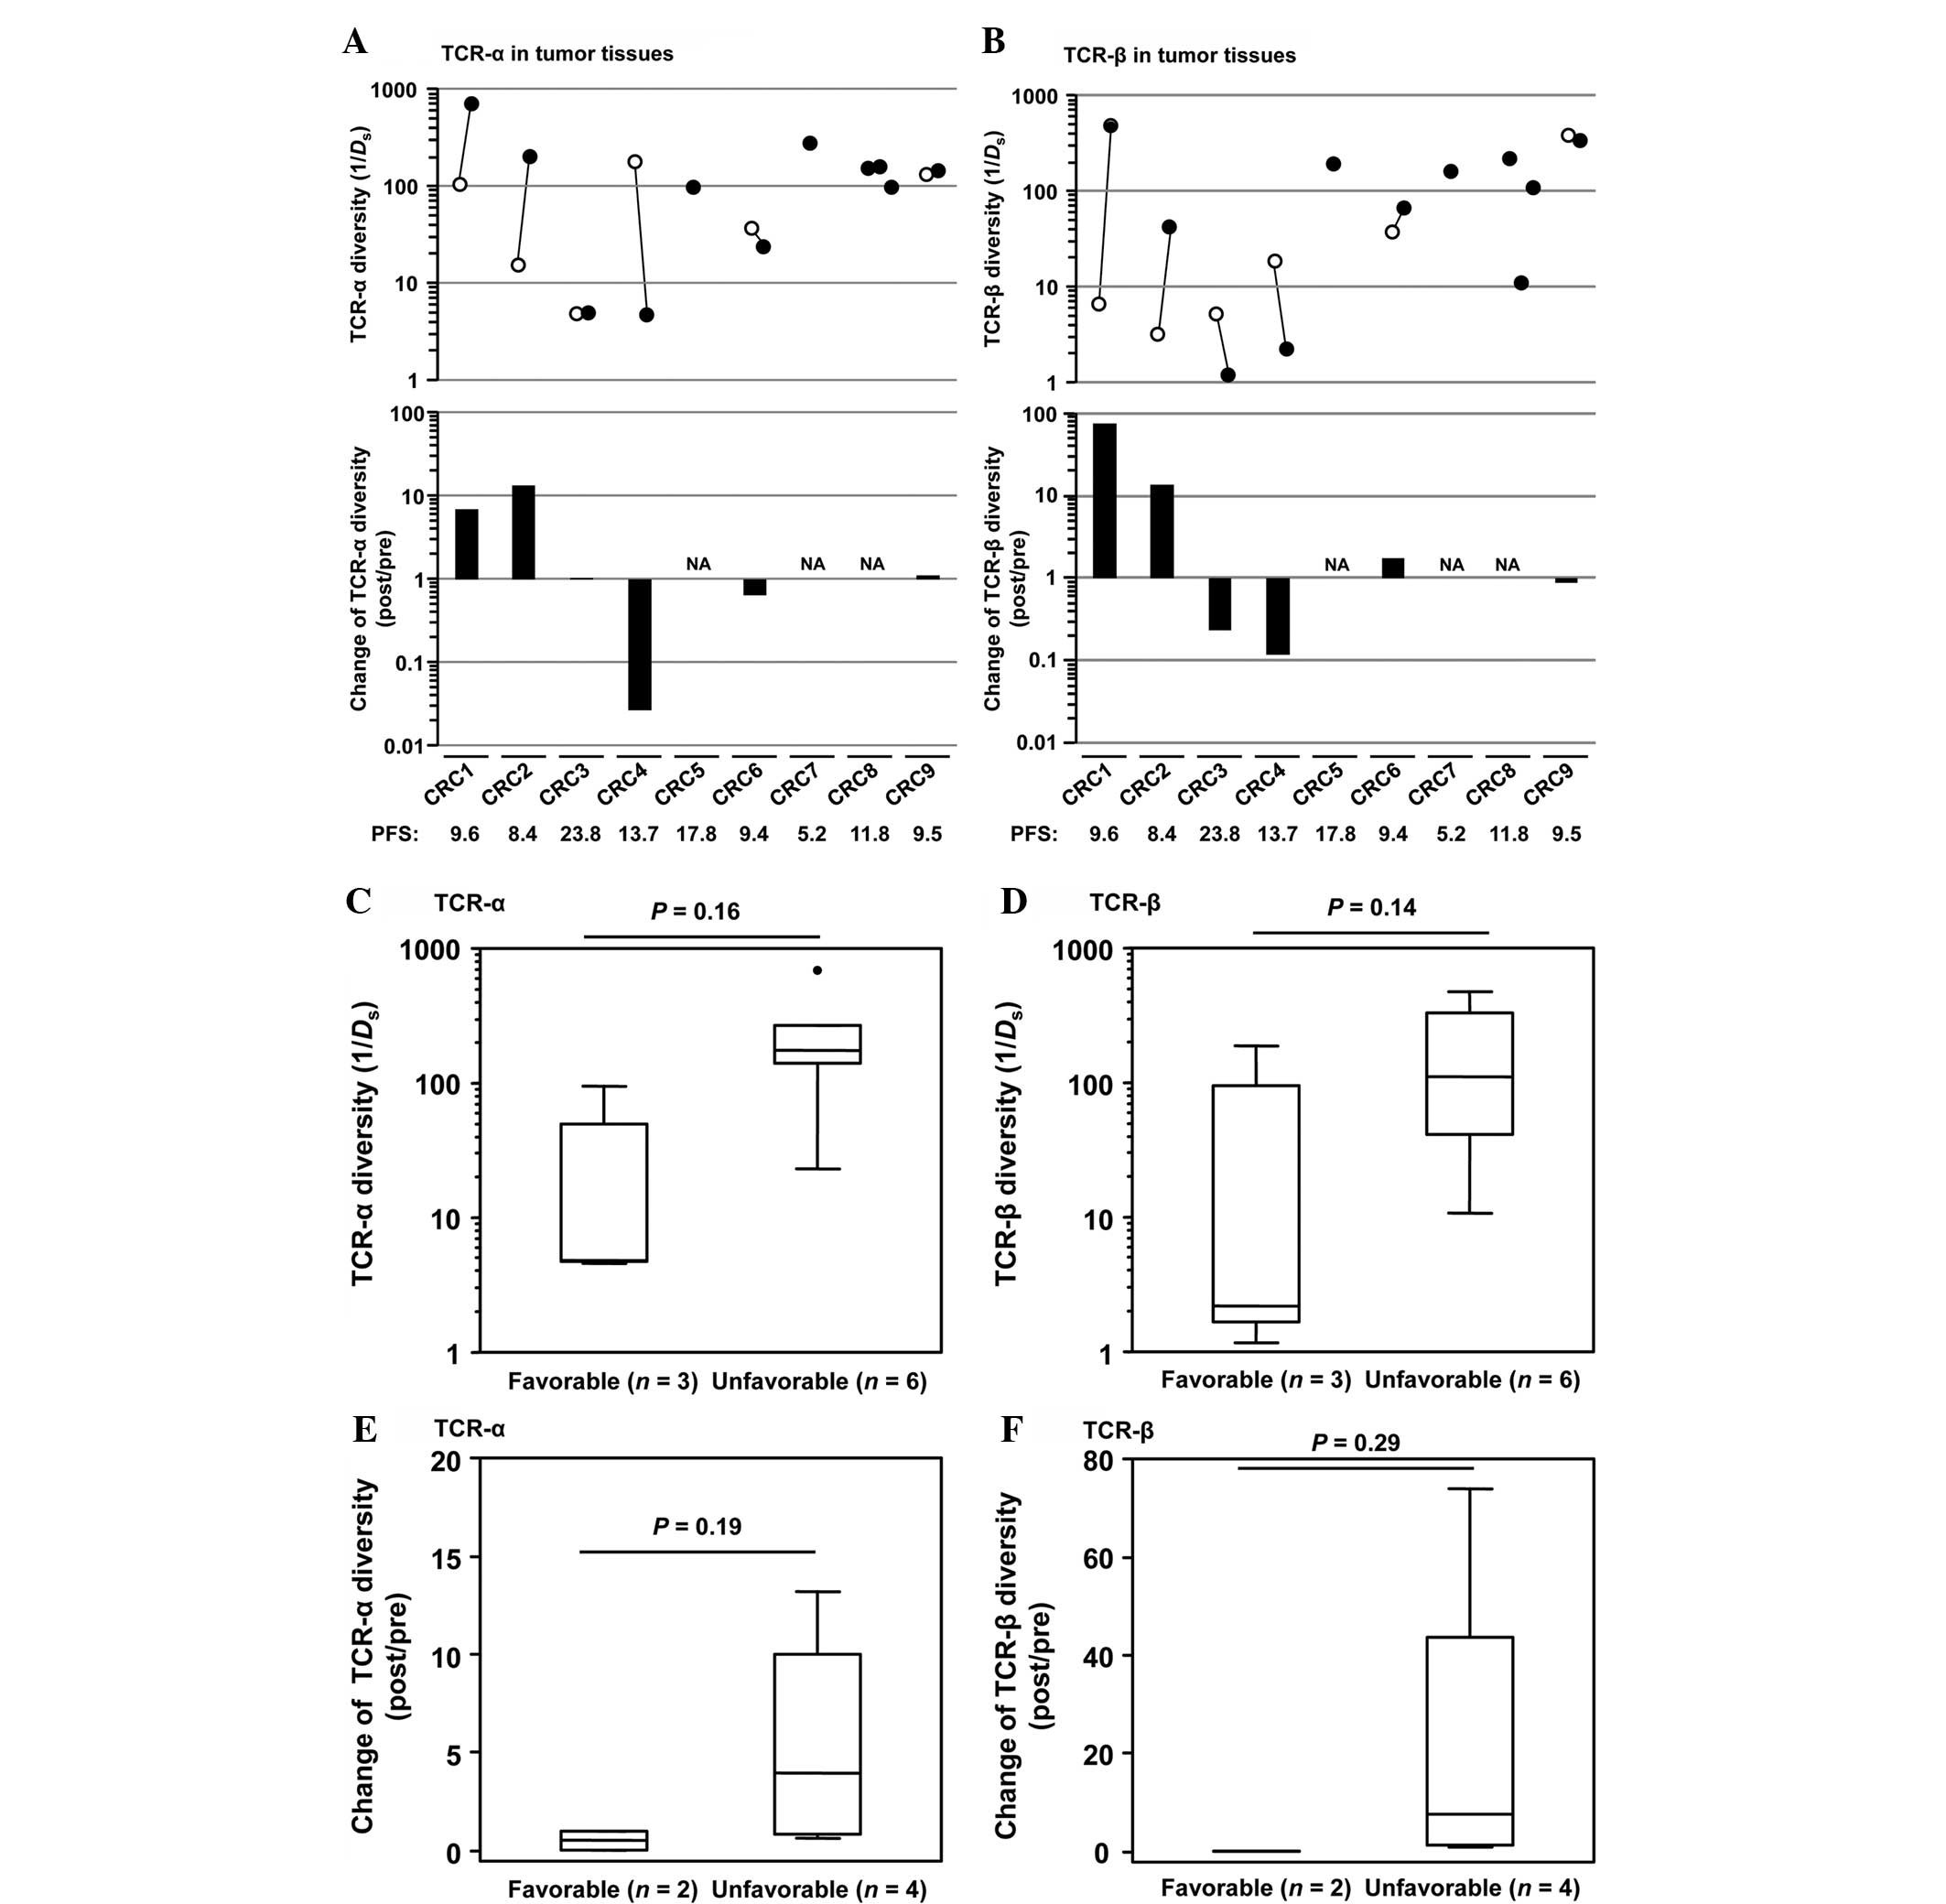
Association between TCR diversity and
clinical outcome
The TCR diversity was calculated using the inverse
Simpson's diversity index (1/Ds) (21), and the association between the TCR
diversity and patients' clinical outcome was investigated. The 9
CRC patients were divided into two groups based on progression-free
survival (PFS), consisting of the favorable (PFS ≥12 months) and
unfavorable (PFS <12 months) groups, and then the TCR diversity
between these two groups was compared (Fig. 2A and B). A tendency for lower
diversity scores of TCR-α and TCR-β was indicated in post-treatment
tumor tissues (TCR-α, P=0.16; TCR-β, P=0.14; Fig. 2C and D). A decrease in TCR diversity
during treatment was also observed in the favorable group compared
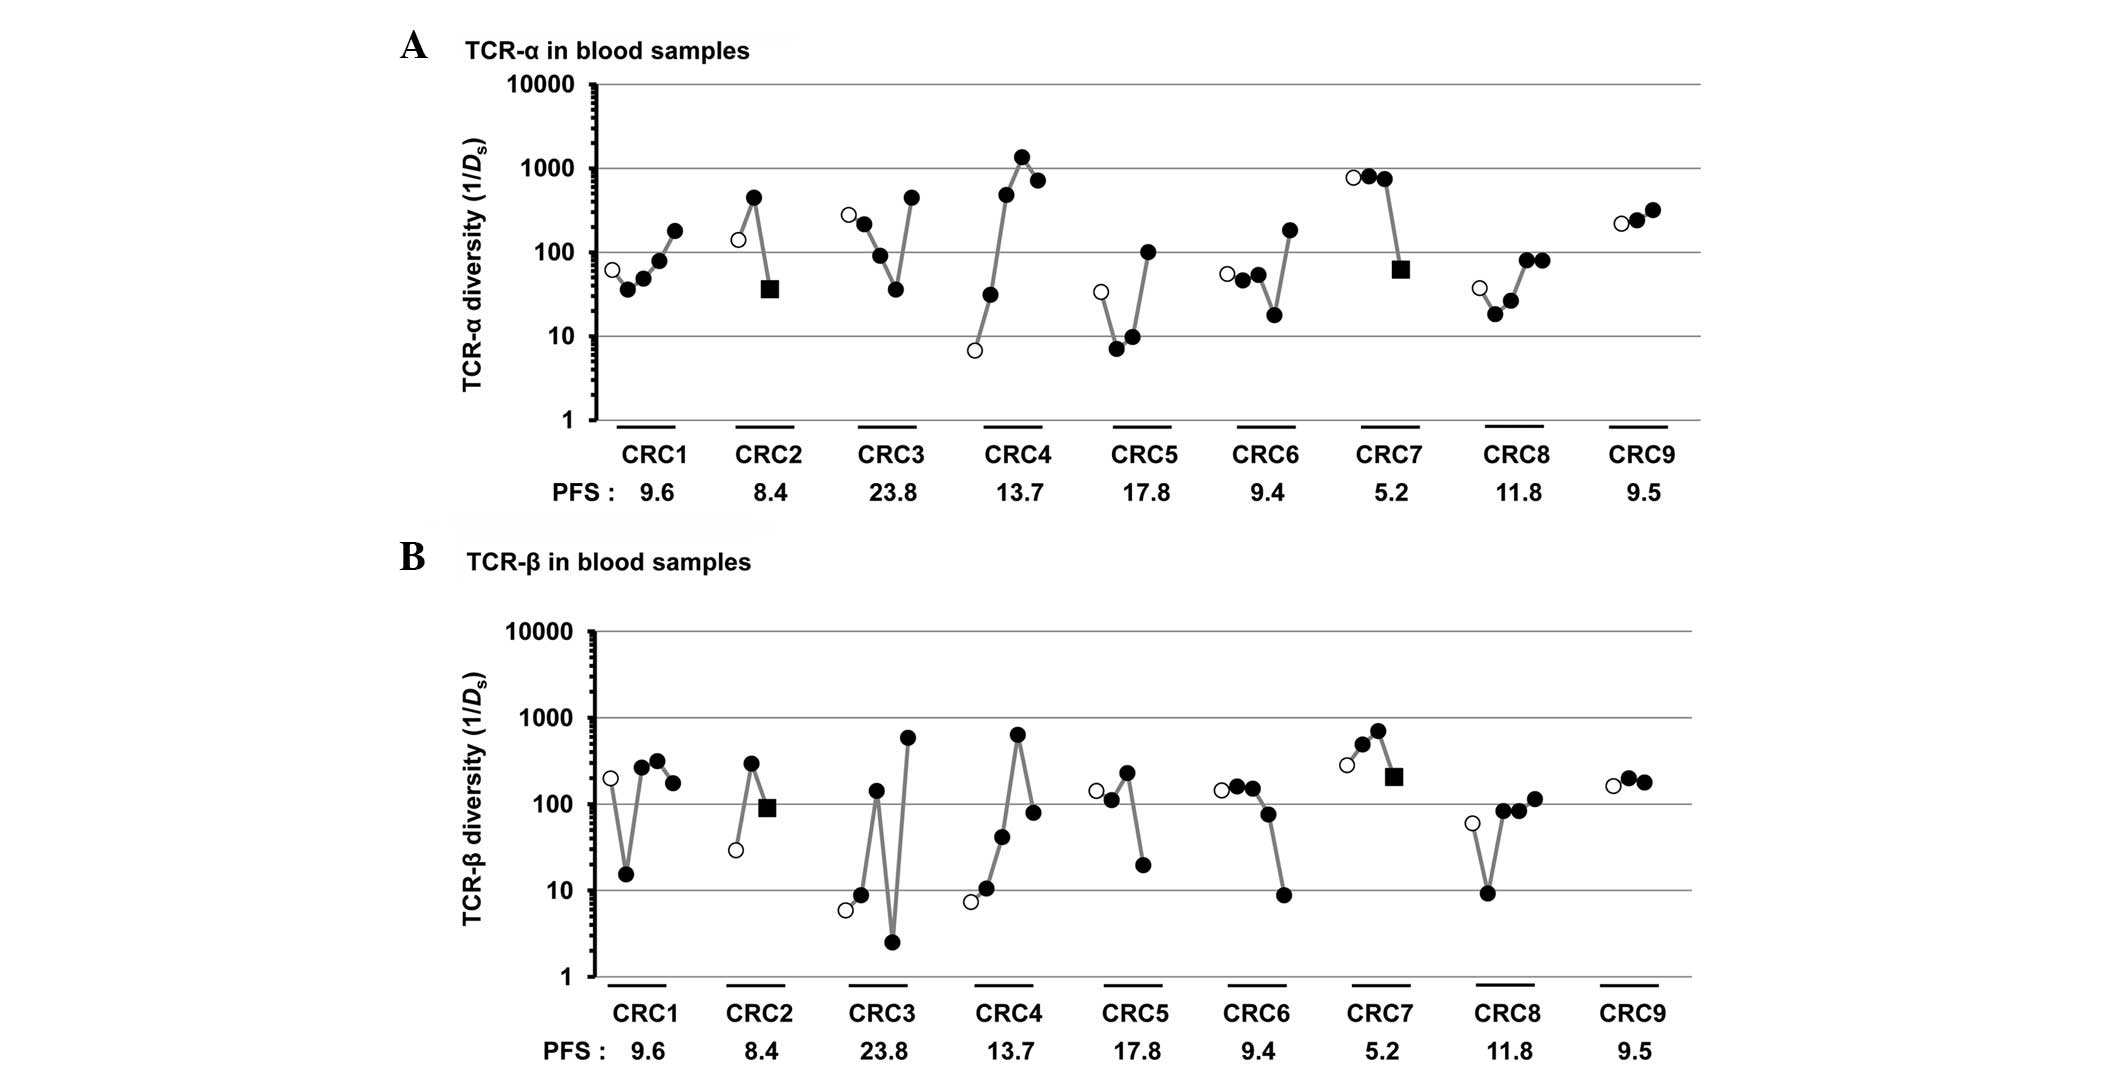
with the unfavorable group (TCR-α, P=0.19; TCR-β, P=0.29; Fig. 2E and F). In blood samples, the higher
ratio of TCR-β diversity at the early time point (8–19 weeks
subsequent to the initiation of treatment) relative to
pre-treatment tended to associate with a longer PFS; in particular,
the greatest ratio was observed in patient CRC3, who exhibited the
longest PFS (Fig. 3A and B). Notably,
the diversity of TCR-α and TCR-β in blood samples was markedly
decreased following the surgical resection of tumors in two
patients (CRC2 and CRC7).
Discussion
Previous studies have demonstrated that TILs are
associated with the prognosis of patients with CRC, and are also
considered to be an important predictor of therapeutic responses
(3–7).
However, to the best of our knowledge, no previous studies have
investigated the clonality or functionality of the T cells. In the
present study, next-generation sequencers were used to
comprehensively analyze the TCR repertoire in the tissue and blood
samples obtained from advanced CRC patients that had been treated
with cancer peptide vaccines in combination with oxaliplatin-based
chemotherapy, and it was confirmed that the T cell repertoires in
tissues varied from the T cell repertoires in blood samples, as
previously described (22–27). Although previous studies only analyzed
TCR clonotypes.
The majority of the enriched TCR sequences observed
in pre-treatment tumor tissues were undetectable in the blood
samples, but several clones enriched in post-treatment tumor
tissues were detectable in the blood at a low frequency of
0.1–0.5%. These common T cell populations in the post-treatment
tissues and blood samples may possibly be activated in the lymph
nodes near the vaccine injection sites and then circulate in
theblood. Certain T cell clones had accumulated and activated in
the tumor lesions.
In addition, T cell repertoires were extremely
different in the pre- and post-treatment tumor tissues, and in the
primary and metastatic tumor tissues, indicating that the immune
environment of cancer tissues changes markedly. In particular, the
lack of a common clonotype between primary and lung metastatic
tumors in patient CRC8, which were surgically resected at the same
time, indicated the huge variation in the immune microenvironment,
possibly due to the tumor heterogeneity or ‘seed-soil’ association,
or a combination of the two.
For the evaluation of the vaccine-specific immune
responses of patients, several currently-available approaches
exist, including an enzyme-linked immunosorbent spot assay and an
HLA-multimer assay (28). However,
since an ex vivo expansion step of peripheral blood
lymphocytes with antigen stimulation under certain cytokines is
required, these methods are not suitable to quantitatively monitor
patients' immune responses over time. Therefore, TCR sequencing
with next generation sequencing was applied in order to monitor the
immune responses. Increased TCR diversity in blood samples at an
early time point, 8–19 weeks from the beginning of the treatment,
was indicated to potentially reflect an improved immune response,
in association with a better PFS (Fig.
3). A similar increase of TCR diversity was observed in another
T cell repertoire analysis in non-small cell lung cancer patients
that were treated with cancer peptide vaccines (17). The increases of TCR diversity in blood
samples may possibly be explained by the following mechanism:
Cancer cells that are damaged by the treatment are likely to be
phagocytosed by antigen-presenting cells, which present various
cancer-specific antigens on their cell surface and eventually
induce the activation of various T cell populations, including
killer and helper T cells. TCR diversity in the blood samples may
reflect the extent of the damage of cancer cells. Notably, the
surgical resection of the tumors in two patients resulted in a
significant decrease of TCR diversity in blood samples (Fig. 3) and the enhancement of clonal
expansion of certain T cell populations in blood samples. These
results may reflect the strong inflammatory reactions that occur
following surgical treatment, or may reflect the immune reactions
in the blood due to the transient increase of circulating tumor
cells during the surgical procedure. TCR diversity scores in blood
samples may be a predictive biomarker for the therapeutic response
in advanced CRC patients. However, accumulating a large amount of
information is clinically important, as TCR diversity is extremely
complex and is affected by various environmental stimuli.
In summary, to the best of our knowledge, the
present study is the first to deeply analyze the TCR-α and TCR-β
repertoires of tumor tissues and blood samples prior to and
subsequent to immunotherapy in combination with chemotherapy in
patients with advanced CRC. Although the significance of the
present results is limited due to the small sample size, T cell
populations in tumor tissues prior to the treatment were indicated
to be almost entirely different from those in blood, but
demonstrate commonality subsequent to vaccine treatment. The
decrease of TCR diversity in the tumor tissues during the treatment
may also be associated with a longer PFS. These results suggest
that TCR diversity scores in the tissues may be a useful predictive
biomarker for the therapeutic effect of immunochemotherapy for
advanced CRC patients.
Acknowledgements
The present study was performed as part of the
Project for Development of Innovative Research on Cancer
Therapeutics and the Japan Agency for Medical Research and
Development. The super-computing resource was provided by the Human
Genome Center, Institute of Medical Science, University of Tokyo
(http://sc.hgc.jp/shirokane.html).
References
|
1
|
Zitvogel L, Kepp O and Kroemer G: Immune
parameters affecting the efficacy of chemotherapeutic regimens. Nat
Rev Clin Oncol. 8:151–160. 2011. View Article : Google Scholar : PubMed/NCBI
|
|
2
|
Zitvogel L, Galluzzi L, Smyth MJ and
Kroemer G: Mechanism of action of conventional and targeted
anticancer therapies: Reinstating immunosurveillance. Immunity.
39:74–88. 2013. View Article : Google Scholar : PubMed/NCBI
|
|
3
|
Pagès F, Berger A, Camus M, Sanchez-Cabo
F, Costes A, Molidor R, Mlecnik B, Kirilovsky A, Nilsson M, Damotte
D, et al: Effector memory T cells, early metastasis and survival in
colorectal cancer. N Engl J Med. 353:2654–2666. 2005. View Article : Google Scholar : PubMed/NCBI
|
|
4
|
Galon J, Costes A, Sanchez-Cabo F, et al:
Type, density and location of immune cells within human colorectal
tumors predict clinical outcome. Science. 313:1960–1964. 2006.
View Article : Google Scholar : PubMed/NCBI
|
|
5
|
Laghi L, Bianchi P, Miranda E, et al: CD3+
cells at the invasive margin of deeply invading (pT3-T4) colorectal
cancer and risk of post-surgical metastasis: A longitudinal study.
Lancet Oncol. 10:877–884. 2009. View Article : Google Scholar : PubMed/NCBI
|
|
6
|
Fridman WH, Pagès F, Sautes-Fridman C and
Galon J: The immune contexture in human tumours: Impact on clinical
outcome. Nat Rev Cancer. 12:298–306. 2012. View Article : Google Scholar : PubMed/NCBI
|
|
7
|
Yasuda K, Nirei T, Sunami E, Nagawa H and
Kitayama J: Density of CD4(+) and CD8(+) T lymphocytes in biopsy
samples can be a predictor of pathological response to
chemoradiotherapy (CRT) for rectal cancer. Radiat Oncol. 6:492011.
View Article : Google Scholar : PubMed/NCBI
|
|
8
|
Rosenberg SA, Yang JC and Restifo NP:
Cancer immunotherapy: Moving beyond current vaccines. Nat Med.
10:909–915. 2004. View
Article : Google Scholar : PubMed/NCBI
|
|
9
|
Gajewski TF, Schreiber H and Fu YX: Innate
and adaptive immune cells in the tumor microenvironment. Nat
Immunol. 14:1014–1022. 2013. View
Article : Google Scholar : PubMed/NCBI
|
|
10
|
Poggi A, Musso A, Dapino I and Zocchi MR:
Mechanisms of tumor escape from immune system: Role of mesenchymal
stromal cells. Immunol Lett. 159:55–72. 2014. View Article : Google Scholar : PubMed/NCBI
|
|
11
|
Janeway CA Jr, Travers P, Walport M and
Shlomchik MJ: Immunobiology: The Immune System in Health and
Disease (5th). Garland Science. New York: 2001.
|
|
12
|
Morris GP and Allen PM: How the TCR
balances sensitivity and specificity for the recognition of self
and pathogens. Nat Immunol. 13:121–128. 2012. View Article : Google Scholar : PubMed/NCBI
|
|
13
|
Arstila TP, Casrouge A, Baron V, Even J,
Kanellopoulos J and Kourilsky P: A direct estimate of the human
alphabeta T cell receptor diversity. Science. 286:958–961. 1999.
View Article : Google Scholar : PubMed/NCBI
|
|
14
|
Arstila TP, Casrouge A, Baron V, Even J,
Kanellopoulos J and Kourilsky P: Diversity of human alpha beta T
cell receptors. Science. 288:11352000. View Article : Google Scholar : PubMed/NCBI
|
|
15
|
Thor Straten P, Schrama D, Andersen MH and
Becker JC: T-cell clonotypes in cancer. J Transl Med. 2:112004.
View Article : Google Scholar : PubMed/NCBI
|
|
16
|
Hazama S, Nakamura Y, Tanaka H, Hirakawa
K, Tahara K, Shimizu R, Ozasa H, Etoh R, Sugiura F, Okuno K, et al:
A phase II study of five peptides combination with
oxaliplatin-based chemotherapy as a first-line therapy for advanced
colorectal cancer (FXV study). J Transl Med. 12:1082014. View Article : Google Scholar : PubMed/NCBI
|
|
17
|
Fang H, Yamaguchi R, Liu X, Daigo Y, Yew
PY, Tanikawa C, Matsuda K, Imoto S, Miyano S and Nakamura Y:
Quantitative T cell repertoire analysis by deep cDNA sequencing of
T cell receptor α and β chains using next-generation sequencing
(NGS). Oncoimmunology. 3:e9684672015. View Article : Google Scholar : PubMed/NCBI
|
|
18
|
Giudicelli V, Chaume D and Lefranc MP:
IMGT/GENE-DB: A comprehensive database for human and mouse
immunoglobulin and T cell receptor genes. Nucleic Acids Res.
33:D256–D261. 2005. View Article : Google Scholar : PubMed/NCBI
|
|
19
|
Langmead B and Salzberg SL: Fast
gapped-read alignment with Bowtie 2. Nat Methods. 9:357–359. 2012.
View Article : Google Scholar : PubMed/NCBI
|
|
20
|
Yousfi Monod M, Giudicelli V, Chaume D and
Lefranc MP: IMGT/JunctionAnalysis: The first tool for the analysis
of the immunoglobulin and T cell receptor complex V-J and V-D-J
JUNCTIONs. Bioinformatics. 20(Suppl 1): S379–S385. 2004. View Article : Google Scholar
|
|
21
|
Venturi V, Kedzierska K, Turner SJ,
Doherty PC and Davenport MP: Methods for comparing the diversity of
samples of the T cell receptor repertoire. J Immunol Methods.
321:182–195. 2007. View Article : Google Scholar : PubMed/NCBI
|
|
22
|
Ochsenreither S, Fusi A, Wojtke S, Busse
A, Nüssler NC, Thiel E, Keilholz U and Nagorsen D: Comparison of
T-cell receptor repertoire restriction in blood and tumor tissue of
colorectal cancer patients. J Transl Med. 8:352010. View Article : Google Scholar : PubMed/NCBI
|
|
23
|
Sherwood AM, Emerson RO, Scherer D,
Habermann N, Buck K, Staffa J, Desmarais C, Halama N, Jaeger D,
Schirmacher P, et al: Tumor-infiltrating lymphocytes in colorectal
tumors display a diversity of T cell receptor sequences that differ
from the T cells in adjacent mucosal tissue. Cancer Immunol
Immunother. 62:1453–1461. 2013. View Article : Google Scholar : PubMed/NCBI
|
|
24
|
Luo W, Liao WJ, Huang YT, Shi M, Zhang Y,
Wen Q, Zhou MQ and Ma L: Normalization of T cell receptor
repertoire diversity in patients with advanced colorectal cancer
who responded to chemotherapy. Cancer Sci. 102:706–712. 2011.
View Article : Google Scholar : PubMed/NCBI
|
|
25
|
Zhou J, Ma R, Luo R, Sun Y, He X, Sun W,
Tang W and Yao X: Primary exploration of CDR3 spectratyping and
molecular features of TCR β chain in the peripheral blood and
tissue of patients with colorectal carcinoma. Cancer Epidemiol.
34:733–740. 2010. View Article : Google Scholar : PubMed/NCBI
|
|
26
|
Mlecnik B, Tosolini M, Kirilovsky A,
Berger A, Bindea G, Meatchi T, Bruneval P, Trajanoski Z, Fridman
WH, Pagès F and Galon J: Histopathologic-based prognostic factors
of colorectal cancers are associated with the state of the local
immune reaction. J Clin Oncol. 29:610–618. 2011. View Article : Google Scholar : PubMed/NCBI
|
|
27
|
Nagorsen D, Keilholz U, Rivoltini L,
Schmittel A, Letsch A, Asemissen AM, Berger G, Buhr HJ, Thiel E and
Scheibenbogen C: Natural T-cell response against MHC class I
epitopes of epithelial cell adhesion molecule, her-2/neu and
carcinoembryonic antigen in patients with colorectal cancer. Cancer
Res. 60:4850–4854. 2000.PubMed/NCBI
|
|
28
|
Czerkinsky C, Andersson G, Ekre HP, et al:
Reverse ELISPOT assay for clonal analysis of cytokine production.
I. Enumeration of gamma-interferon-secreting cells. J Immunol
Methods. 110:29–36. 1988. View Article : Google Scholar : PubMed/NCBI
|