Introduction
Malignant glioma is one of the most common types of
malignant primary brain tumor, and has high morbidity and
mortality. Even with optimal treatment, which consists of surgery,
chemotherapy and radiotherapy, the median survival time of patients
with malignant glioma is extremely short; only 12–15 months for
patients with glioblastomas and 2–5 years for patients with
anaplastic gliomas (1). It is
important to understand the genetic and epigenetic factors that
cause the activation of oncogenes and inactivation of tumor
suppressor genes in cancer cells. An increasing number of studies
indicate that accelerated glycolysis is one of the most important
and vital biochemical characteristics of cancer cells (2,3). Glucose
is the major energy substrate of most eukaryotic cells, and tumors,
particularly solid cancer cells, often possess a growth advantage
compared with non-tumorous cells due to increased anaerobic
glycolysis (4,5).
Glucose transporter (GLUT) proteins allow the energy
independent transport of glucose across the hydrophobic cell
membrane and against a concentration gradient, and this is the first
rate-limiting step for sugar metabolism in cells (6). GLUTs are regarded as important
regulators of glucose metabolism in transformed cells. Among the 14
members of GLUTs, GLUT member 3 (GLUT3), which has a high affinity
for glucose, is reported to be upregulated in samples obtained from
patients with brain tumors (7,8).
Furthermore, the level of GLUT3 expression in gliomas has a
significant association with pathological grading of tumors
(7,9).
It has been reported previously that GLUT3 is highly expressed in
glioblastoma, and promotes the growth of brain tumor initiating
cells (3). Therefore, it is probable
that GLUT3 may become a therapeutic target in cancer treatment.
However, the mechanism by which GLUT3 is upregulated remains
unknown.
Transcription factor Sp1 (Sp1) was the first
transcription factor to be isolated, and it regulates the
expression of numerous genes involved in cell proliferation,
apoptosis and differentiation (10).
Previous studies have demonstrated that an increase in Sp1
transcriptional activity is associated with tumorigenesis (11–13). In
addition, Sp1, has been suggested as a therapeutic target for
cancer (14), and the Sp1 inhibitor
mithramycin A and analogues have been used as a novel strategy for
the treatment of various types of cancer (15–17). In
muscle cells, insulin-like growth factor-1 controls GLUT3
expression via Sp1 (17). In human
glioma, it has been reported that Sp1 is upregulated, which
promotes matrix metalloproteinase (MMP)-2-mediated cell invasion
and predicts poor clinical outcomes of patients (18). However, the clinical significance and
biological role of the association between Sp1 and GLUT3 expression
in glioma requires further investigation. The aim of the current
study was to identify whether the expression of GLUT3 is regulated
by Sp1, and to investigate the role of Sp1 in regulating glucose
transport and the biological function of glioma cells.
Materials and methods
Cell culture and materials
Human embryonic kidney (HEK)-293T and human glioma
U251 cells were obtained from the American Type Culture Collection
(Manassas, VA, USA). HEK-293T and U251 cells were maintained in
Dulbecco's Modified Eagle Medium (Thermo Fisher Scientific, Inc.,
Waltham, MA, USA) supplemented with 10% fetal bovine serum and 100
U/ml penicillin (Gibco®; Thermo Fisher Scientific,
Inc.). The cells were free from mycoplasma contamination. All cell
lines were incubated in a humidified atmosphere of 5%
CO2 at 37°C. Mithramycin A, a selective inhibitor of
Sp1-mediated transcriptional activation, was assayed according to
previous report (15). The cells were
treated with mithramycin A (300 nM; Sigma-Aldrich, St. Louis, MO,
USA) and were then harvested and lysed for either RNA or protein
extraction.
Plasmids constructs and luciferase
assay
To determine the possible effect of the Sp1 binding
site on the solute carrier family 2 (facilitated glucose
transporter), member 3 (SLC2A3) gene, which encodes GLUT3 and GLUT3
5′-untranslated region (5′-UTR) containing putative binding sites
for Sp1 (−306 to-297 nt and −312 to-303 nt) was amplified from
normal human genomic DNA using the PCR and the following primers:
Forward, 5′-TACGGTACCAAACCCAGGGTGGAGAGAG-3′ and reverse,
5′-TAGCTCGAGAGCCTGAAAGGGCGAC-3′. The binding sites were cloned into
the KpnI and XhoI sites of the firefly luciferase
reporter gene vector pGL3-Basic (Promega Corporation, Madison, WI,
USA), which was named as pGL3-GLUT3-WT. GLUT3 mutant 5′-UTR was
generated using site-directed mutagenesis (Forward, 5′-GGGGCGGGG-3′
and reverse, 5′-GGTTTTTGG) and was recombined into pGL3-Basic,
which was named as pGL3-GLUT3-MUT. Silencing of Sp1 expression was
achieved using small interfering (si) RNA duplex sequences
according to a previous study by Garcia-Huerta et al
(19): Short hairpin (sh) Sp1.1,
5′-CCTTGCTACCTGTCAACAGCGTTTCTGCA-3′; and shSp1.2,
5′-AGGACAGACTCAGTATGTGACCAATGTAC-3′. The siRNA sequence was
synthesized by Genetimes Technology, Inc. (Shanghai, China) and
named as siRNA-S1. All constructs were confirmed by DNA
sequencing.
All GLUT3-associated promoter-luciferase constructs
were co-transfected into U251 cells using Lipofectamine®
2000 Transfection Reagent (Thermo Fisher Scientific, Inc.). For the
reporter assay, 100 ng pGL3-GLUT3-WT or pGL3-GLUT3-MUT were
co-transfected together with 50 ng p-renilla luciferase reporter
vector-TK with or without siRNA-S1. The U251 cells were cultured in
24-well plates under serum-free conditions. The cells were
harvested 48 h following transfection, and luciferase activity was
measured using the Dual-Luciferase® Reporter Assay
System (Promega Corporation) according to the manufacturer's
protocol. Firefly luciferase activity was normalized to renilla
luciferase activity.
Chromatin immunoprecipitation (ChIP)
assay
To detect any in vivo binding of Sp1 to the
SLC2A3 gene, a ChIP assay was performed using a ChIP Assay kit (EMD
Millipore, Billerica, MA, USA). Briefly, U251 cells
(1×10⁶ cells) were cross-linked with 1% formaldehyde
(Sigma-Aldrich) at 37°C for 10 min. The cross-linked chromatin was
subsequently extracted, diluted with lysis buffer and sheared by
sonication. Following centrifugation (Eppendorf 5415R; 7,500 × g,
10 min), supernatants were diluted 10-fold with ChIP dilution
buffer and an aliquot of the diluted supernatant (1%) was saved as
a positive control for polymerase chain reaction (PCR). Subsequent
to pre-clearing the lysate with protein A and protein G-agarose
beads (1:2 ratio; EMD Millipore), the chromatin was divided into
equal samples for immunoprecipitation with either anti-Sp1 (mouse
monoclonal IgG2a; #sc-17824) or anti-immunoglobulin
(Ig)G (negative control; mouse monoclonal IgG2a;
#sc-53740) antibodies (purchased from Santa Cruz Biotechnology,
Inc., Dallas, TX, USA). Immunoprecipitated DNA was recovered using
the QIAquick PCR Purification kit (Qiagen, Inc., Valencia, CA, USA)
and 1:100 of the precipitated DNA was used for PCR. Prior to adding
the antibody, 1:100 of the solution was used as an internal control
for the quantitative accuracy of the DNA. Purified DNA was
subjected to PCR with primers specific for a region in the SLC2A3
promoter (−381 to −200 nt), which spanned two putative Sp1-binding
sites. The primer sequences used for the PCR reactions were as
follows: Forward, 5′-AAACCCAGGGTGGAGAGAG-3′ and reverse,
5′-AGCCTGAAAGGGCGAC-3′. Quantitative (q) PCR was performed using
SYBR green. The following cycling conditions were used: 95°C for 1
min; and amplification for 40 cycles of 95°C for 30 sec and 58°C
for 45 sec. The comparative threshold cycle method was used to
calculate the relative alterations in the SLC2A3 gene. The data
were normalized using the negative control, an untranscribed region
upstream of glyceraldehyde 3-phosphate dehydrogenase (GAPDH), and
was represented as fold-change of the negative control.
Virus production and infection
The role of GLUT3 in glioma cell proliferation was
examined using RNA interference-mediated gene silencing. The siRNA
sequence that targeted the GLUT3 gene plasmid (pLV-SLC2A3-shRNA)
were synthesized by Genetimes Technology, Inc. as follows:
5′-CGGTGCAGATAGATCTGGAAACTCGAGTTTCCAGATCTATCTGCACCGTTTTT-3′.
HEK-293T cells were transfected using the calcium-phosphate
precipitation method, co-transfecting the lentiviral plasmid of
interest in conjunction with proteolipid protein (pLP)-1, vesicular
stomatitis virus (VSV-G) and pLP2. Viral supernatants were
harvested 48 h post-transfection, filtered and used directly for
infection of U251 cells. Puromycin selection was performed to
select cells with stable pLV genomic integration (with control or
GLUT3 shRNA). Fluorescence-activated cell sorting was used to
select cells with stable constructs, based on green fluorescent
protein expression.
[3H]-2-deoxyglucose
([3H]-2-DG) uptake experiment
The glucose uptake experiment was measured by
modifying the method described previously (20). Briefly, U251 cells were plated in
24-well plates at a density of 2×10⁵ cells/well 48 h
prior to the uptake experiment. The cells were washed with
phosphate-buffered saline (PBS) and uptake was initiated by the
addition of 0.5 ml incubation buffer containing
[3H]-2-DG (DuPont USA, Wilmington, DE, USA) at a final
concentration of 600 nM (0.1 µCi/500 µl media in well) for 20 min
at 37°C. Uptake was halted by washing the cells with ice-cold 0.1 M
PBS. The cells were dissolved in 200 µl of lysis buffer [10 mM
Tris-HCl (pH 8.0) and 0.2% sodium dodecyl sulfate (SDS)] and the
incorporated radioactivity was measured by liquid scintillation
spectrometry. Non-specific uptake was determined in the presence of
cytochalasin B (10 µmol/l; control), which was subtracted from all
values.
RNA purification and qPCR
amplification
Total RNA was extracted from the U251 cells using
TRIzol® Reagent (Invitrogen™; Thermo Fisher Scientific,
Inc.), according to the manufacturer's protocol. Nucleic acid
concentrations were determined using Quant-iT™
RiboGreen® RNA Assay kit (Invitrogen™; Molecular
Probes®; Thermo Fisher Scientific, Inc.). The RNA was
stored at −80°C until required.
SLC2A3 expression level was detected by one-step
qPCR using TaqMan probe specific for SLC2A3 mRNA. SLC2A3 primers
and probe were as follows: Forward 5′-CTCTTCGTCAACCGCTTTGG-3′,
reverse 5′-TCAACCGACTTAGCTACTTTACAC-3′ and TaqMan probe,
5′-FAM-AGCAGCCACCAGTGACAGCCAACA-BHQ1-3′. One-step qPCR was
performed on ABI 7500 Read-Time PCR system (Applied
Biosystems®; Thermo Fisher Scientific, Inc.) using 25 µl
QuantiTect Probe RT-PCR kit (Qiagen, Inc.) on 1–2 µg of total RNA.
PCR conditions were as follows: 50°C for 15 min; 95°C for 15 min;
45 cycles at 94°C for 30 sec; annealing at 55°C for 45 sec. A
no-template control was included in each assay. β-actin was used as
an endogenous control and vehicle control was used as a calibrator.
Each sample was run three times. The comparative threshold cycle
method was used to calculate the relative changes in SLC2A3 gene
expression. The relative changes of gene expression were calculated
using the 2−ΔΔCq method, where ΔCq = Cq (detected gene)
- Cq (β-actin), and Cq represents threshold cycle number.
Western blot analysis
U251 cells were cultured in 6-well plates to 70–80%
confluence. The cells were scraped and homogenized with lysis
buffer [150 mM NaCl, 100 mM Tris-HCl (pH 8.0), 1 mM
ethylenediaminetetraacetic acid, 0.5% Triton X-100] and a protease
inhibitor cocktail (Roche Diagnostics GmbH, Mannheim, Germany). The
cells were lysed in the same way 2–3 days following transfection or
Sp1 inhibitor treatment. The amount of soluble protein was
determined using a modified Lowry assay (DC™ Protein Assay kit;
Bio-Rad Laboratories, Inc., Hercules, CA, USA). Each lane was
loaded with 20 µg total protein. Proteins were electrophoretically
resolved by 9% SDS-polyacrylamide gel electrophoresis and
transferred to polyvinylidene difluoride (PVDF) membranes (EMD
Millipore). Following blocking with 5% dry milk for 1 h at room
temperature, the PVDF membranes were incubated overnight with
anti-GLUT3 (mouse monoclonal IgG1; #sc-74399; dilution,
1:200) and for 4 h with anti-GAPDH (mouse monoclonal
IgG1; #sc-365062; dilution, 1:200) antibodies, which
were purchased from Santa Cruz Biotechnology, Inc. Following 3
washes with Tris-buffered saline and Tween 20, the membranes were
incubated with a sheep anti-mouse IgG conjugated to horseradish
peroxidase secondary antibody (#NA931; GE Healthcare Life Sciences,
Chalfont, UK; dilution, 1:1,000) for 1 h at room temperature. The
protein blots were visualized using Pierce™ ECL Western Blotting
Substrate (Thermo Fisher Scientific, Inc.) on a Kodak Image Station
(Kodak, Rochester, NY, USA).
Cell viability assay
In vitro cell viability was determined by
3-(4,5-dimethylthiazol-2-yl)-2,5-diphenyltetrazolium bromide (MTT)
assay. Briefly, 2×10⁵ cells, including shRNA
cotransfection or mithramycin A treated cells, were seeded into
96-well culture plates. In total, 20 µl MTT (5 mg/ml;
Sigma-Aldrich) was added to the media at 37°C in 5% CO2
and 95% air for 72 h. Following removal of the culture media, the
remaining crystals were dissolved in 200 µl dimethyl sulfoxide
(DMSO; Sigma-Aldrich) and absorbance at 490 nm was measured. Cell
viability was calculated relative to a DMSO control.
Transwell assay
U251 cells were cultured for 72 h with 10 pmol
shRNA-GLUT3, 20 pmol siRNA-Sp1 or Sp1 inhibitor, and subsequently
cell invasion was assayed three times using a 24-well Transwell
plate (Neuro Probe, Inc., Gaithersburg, MD, USA) using
polycarbonate nucleopore filters (pore size, 8-µm). The cells were
centrifuged, resuspended in serum-free medium and
1.5×10⁴ cells were seeded in the upper chamber of each
well of the Transwell plate. The lower chambers contained
serum-free medium. The invasive cells that had moved through the
membrane were rinsed with PBS, fixed, and stained with an
ethanol-based crystal violet solution following 24 h of incubation.
The cells were examined under a microscope and all cells in a
specified region in the middle of the membrane were counted.
Experiments were repeated at least three times.
Scratch assay
The scratch motility assay was used to measure
two-dimensional movement of the cells. Aliquots of 1×10⁶
cells were plated in individual wells of 6-well tissue culture
plates. Following 48 h, a line of adherent cells was scraped from
the bottom of each well using a sterile 200 µl pipette tip to
generate a wound, and medium containing serum and blasticidin
(Thermo Fisher Scientific, Inc.) was added and cells were incubated
at 37°C. The cells were allowed to proliferate and migrate into the
wound for 36 h. The extent of migration of cells into the region
from which cells had been scraped was determined using photographs.
The experiment was repeated three times with multiple scratches
each time.
Statistical analysis
Data are presented as the mean ± standard error.
Statistical significance was determined by Student's t test using
SPSS version 17.0 was used (SPSS, Inc., Chicago, IL, USA).
P<0.05 was considered to indicate a statistically significant
difference.
Results
Sp1 induces GLUT3 through
transcriptional activation in glioma cells
To test the hypothesis that Sp1 is critical for the
production of GLUT3, which is encoded by the SLC2A3 gene, putative
Sp1 binding site sequences of the GLUT3 promoter were transfected
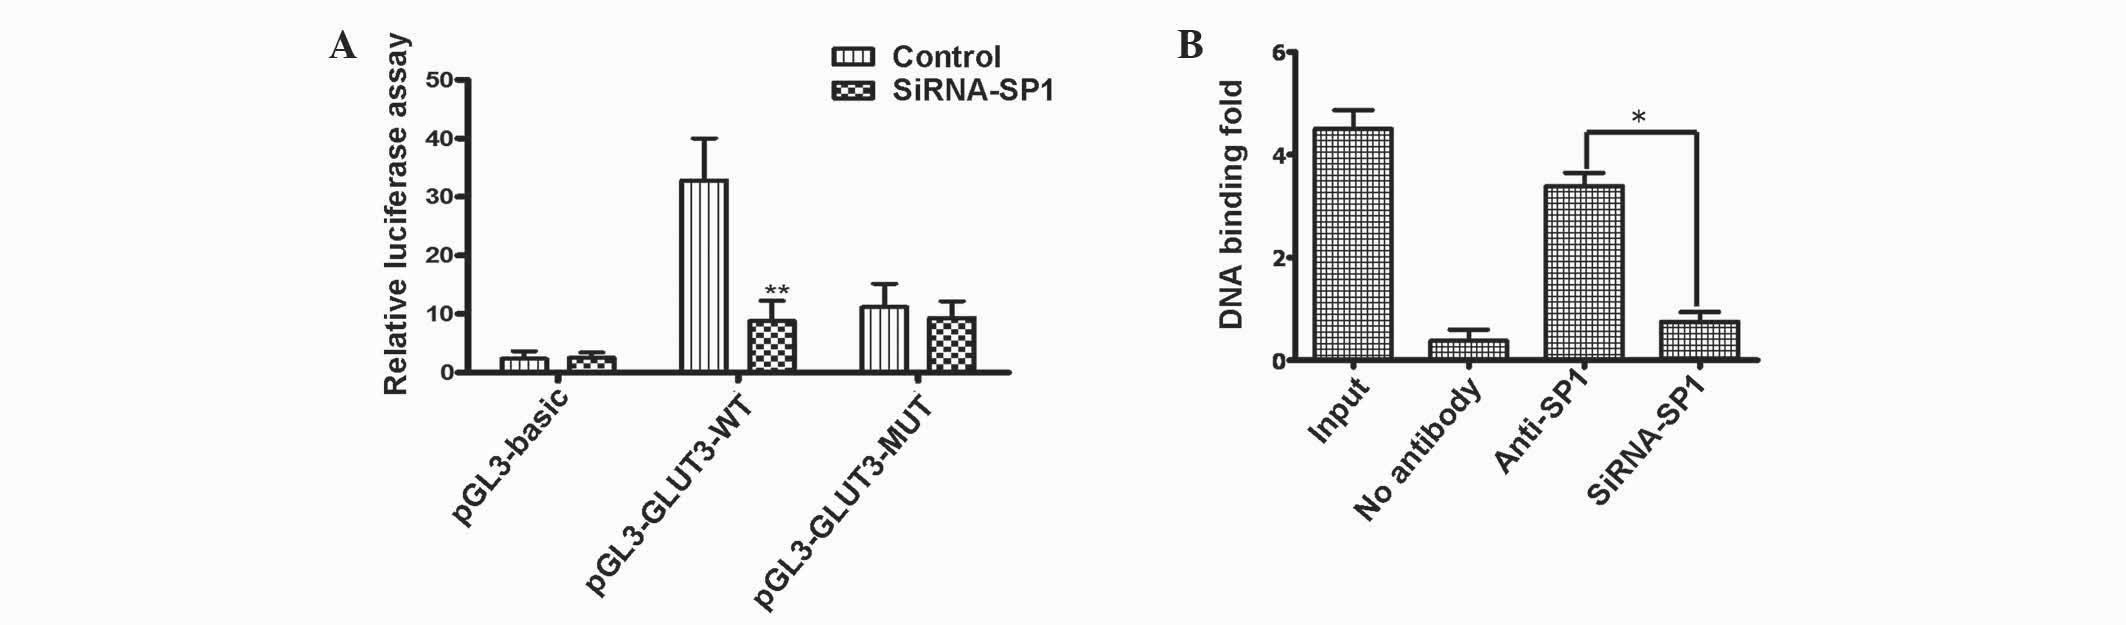
into a luciferase reporter plasmid. Compared with the empty
luciferase vector, pGL3-GLUT3-WT reporters, which comprised
nucleotides (nt) −381 to −200, generated a high level of luciferase
activity [32.8-fold compared with pGL3-Basic (empty vector);
P<0.001] in U251 cells. However, this increase was greatly
attenuated in Sp1-depleted cells (11.2-fold compared with
pGL3-GLUT3-WT; P<0.001) using Sp1 siRNA (Fig. 1A). Using reporters containing mutated
binding sites, the present study identified that the Sp1-binding
site −306 to −297 nt was required for activation of the GLUT3
promoter. The pGL3-GLUT3-MUT reporters containing a mutated Sp1
binding site was unable to respond to Sp1 deletion, indicating that
the putative Sp1 binding site is critical in Sp1 activation of
GLUT3 transcription (Fig 1A).
Subsequently, the Sp1 putative binding site within
the promoter of SLC2A3, composed of a GC-box (GGGGGCGGGGG), was
analyzed using ChIP. The assay revealed that a 182 bp DNA fragment
corresponding to the putative Sp1 binding site of the SLC2A3 gene
(−381 to −200 nt) was amplified from U251 cells when chromatin was
immunoprecipitated with a Sp1 antibody (Fig. 1B).
Sp1 activate GLUT3 expression in
glioma cells
The present study transduced U251 cells with
lentiviruses, which delivered shRNAs targeting GLUT3, to generate
cells with stable GLUT3 knockdown. The expression level of GLUT3 in
U251 cells were clearly reduced following an increase in the GLUT3
shRNA treatment concentration (Fig.
2A). By contrast, there was no reduction in GLUT3 expression
observed compared with untransfected cells when the cells were
treated with the negative control shRNA. Furthermore, Sp1 depletion
decreased GLUT3 mRNA expression with an increasing concentration of
siRNA-Sp1. Mithramycin A may also lead to a decrease in GLUT3 mRNA.
Therefore, the present study analyzed if GLUT3 expression was
affected by self-targeted shRNA or an Sp1-regulated mechanism,
either transfection with siRNA-Sp1 or treatment with mithramycin A
(Fig. 2B).
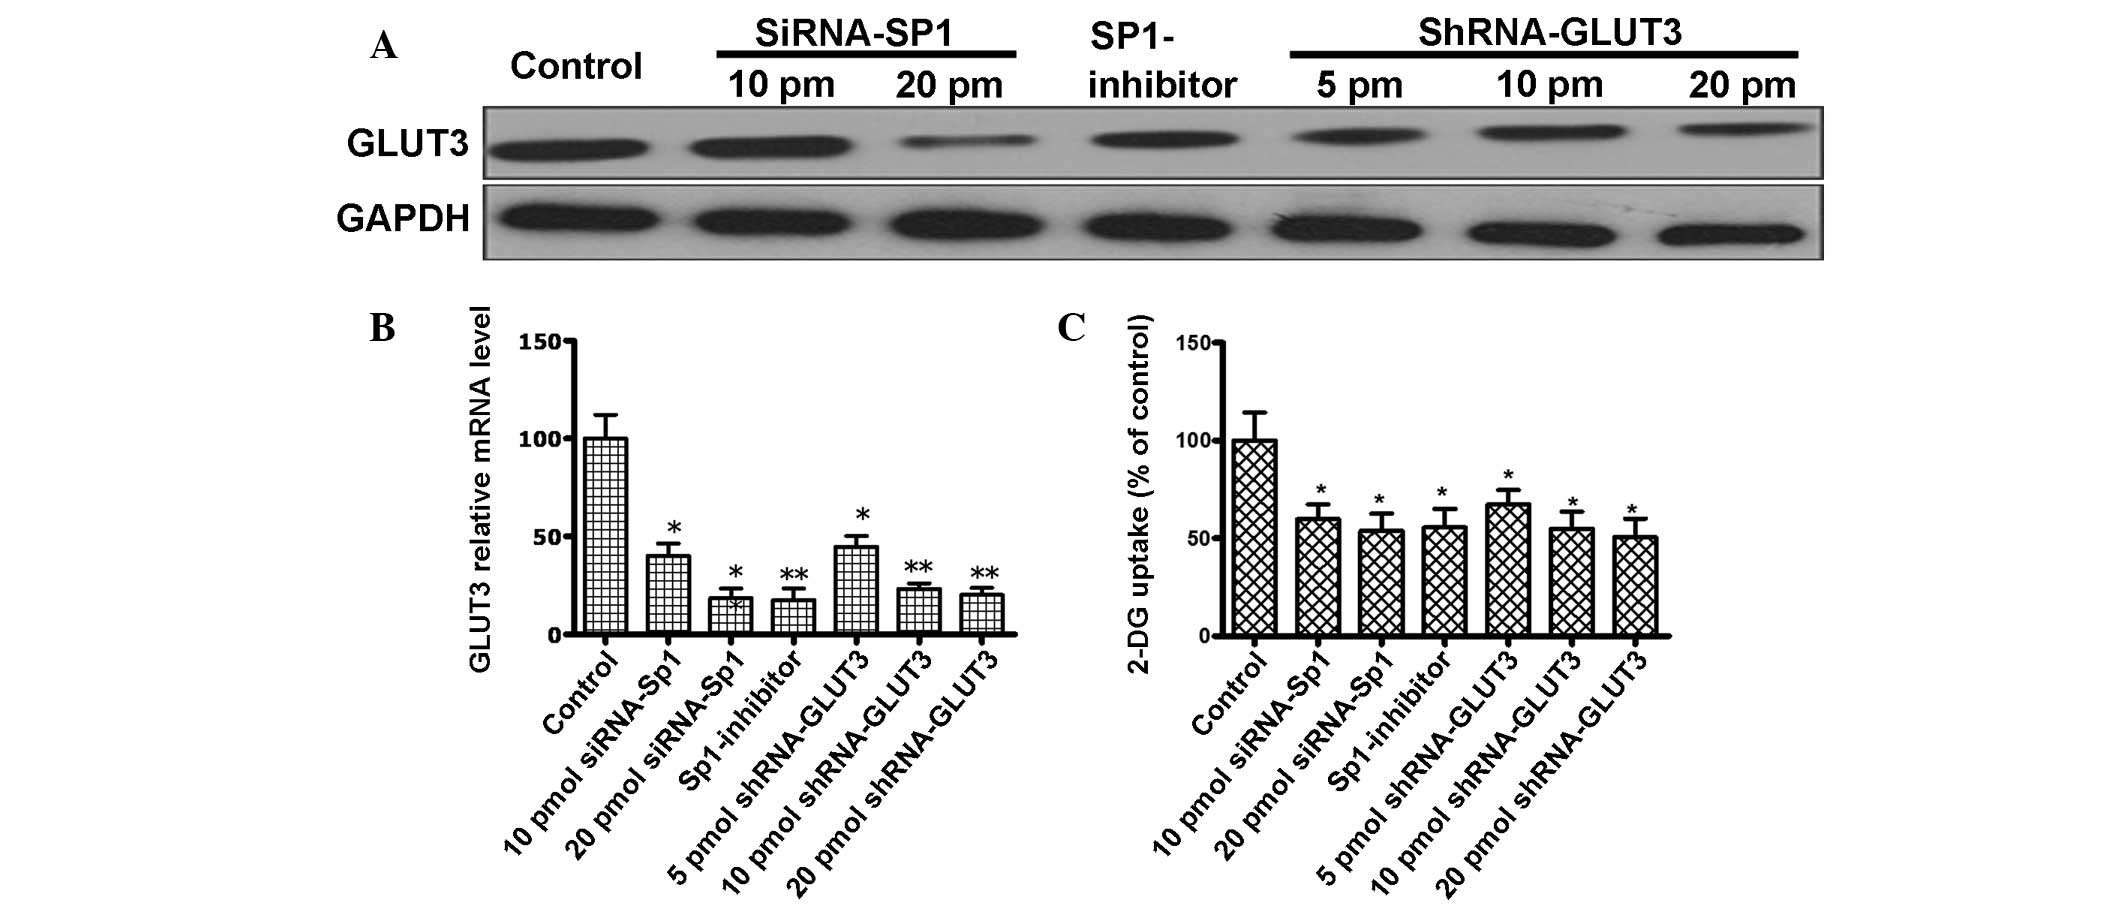 | Figure 2.(A) Western blot analysis for the
expression of GLUT3 in control and human glioma U251 cells treated
with siRNA-SP1 (10 and 20 pmol), shRNA-GLUT3 (10 and 20 pmol) and
SP1-inhibitor (300 nM). Notably, GLUT3 expression is decreased
following treatment with siRNA-SP1, shRNA-GLUT3 and SP1-inhibitor.
(B) GLUT3 relative mRNA level. GLUT3 mRNA expression was detected
using quantitative polymerase chain reaction in control and U251
cells treated with GLUT3 shRNA (5, 10 and 20 pmol), SP1 siRNA (10
and 20 pmol) and SP1-inhibitor (300 nM). (C) Glucose uptake in U251
cells. Uptake of-2-DG in control and U251 cells treated with GLUT3
shRNA (5, 10 and 20 pmol), SP1 siRNA (10 and 20 pmol) and
SP1-inhibitor (300 nM). Data are the means of three independent
experiments performed in triplicate. Error bars indicate the
standard deviation from the mean; *P<0.05;**P<0.01 vs.
control. GLUT3, glucose transporter 3; control, untreated U251
cells; siRNA, small interfering RNA; SP1, specific protein 1;
shRNA, short hairpin RNA; GAPDH, glyceraldehyde 3-phosphate
dehydrogenase; SP1-inhibitor, mithramycin A; mRNA, messenger RNA;
2-DG, [3H]-2-deoxyglucose; pm, picomole. |
GLUT3 promotes glucose uptake
The present study used stable lentivirus-transfected
U251 cells to assay the contribution of GLUT3 to the import of
glucose. Silencing of GLUT3 expression led to a decrease of ~50% in
the efficiency of radioactive 2-DG incorporation, revealing that
GLUT3 is important in glucose uptake in glioma cells (Fig. 2C). Furthermore, the present study
demonstrated that Sp1 expression silencing and mithramycin A also
led to a reduction in the efficiency of radioactive 2-DG
incorporation in the cells (Fig. 2C).
The present data indicates that Sp1 participates in the
GLUT3-dependent glucose uptake by regulating GLUT3 expression.
Reduced GLUT3 expression attenuated
the invasive potential of glioma cells in vitro by Sp1
regulation
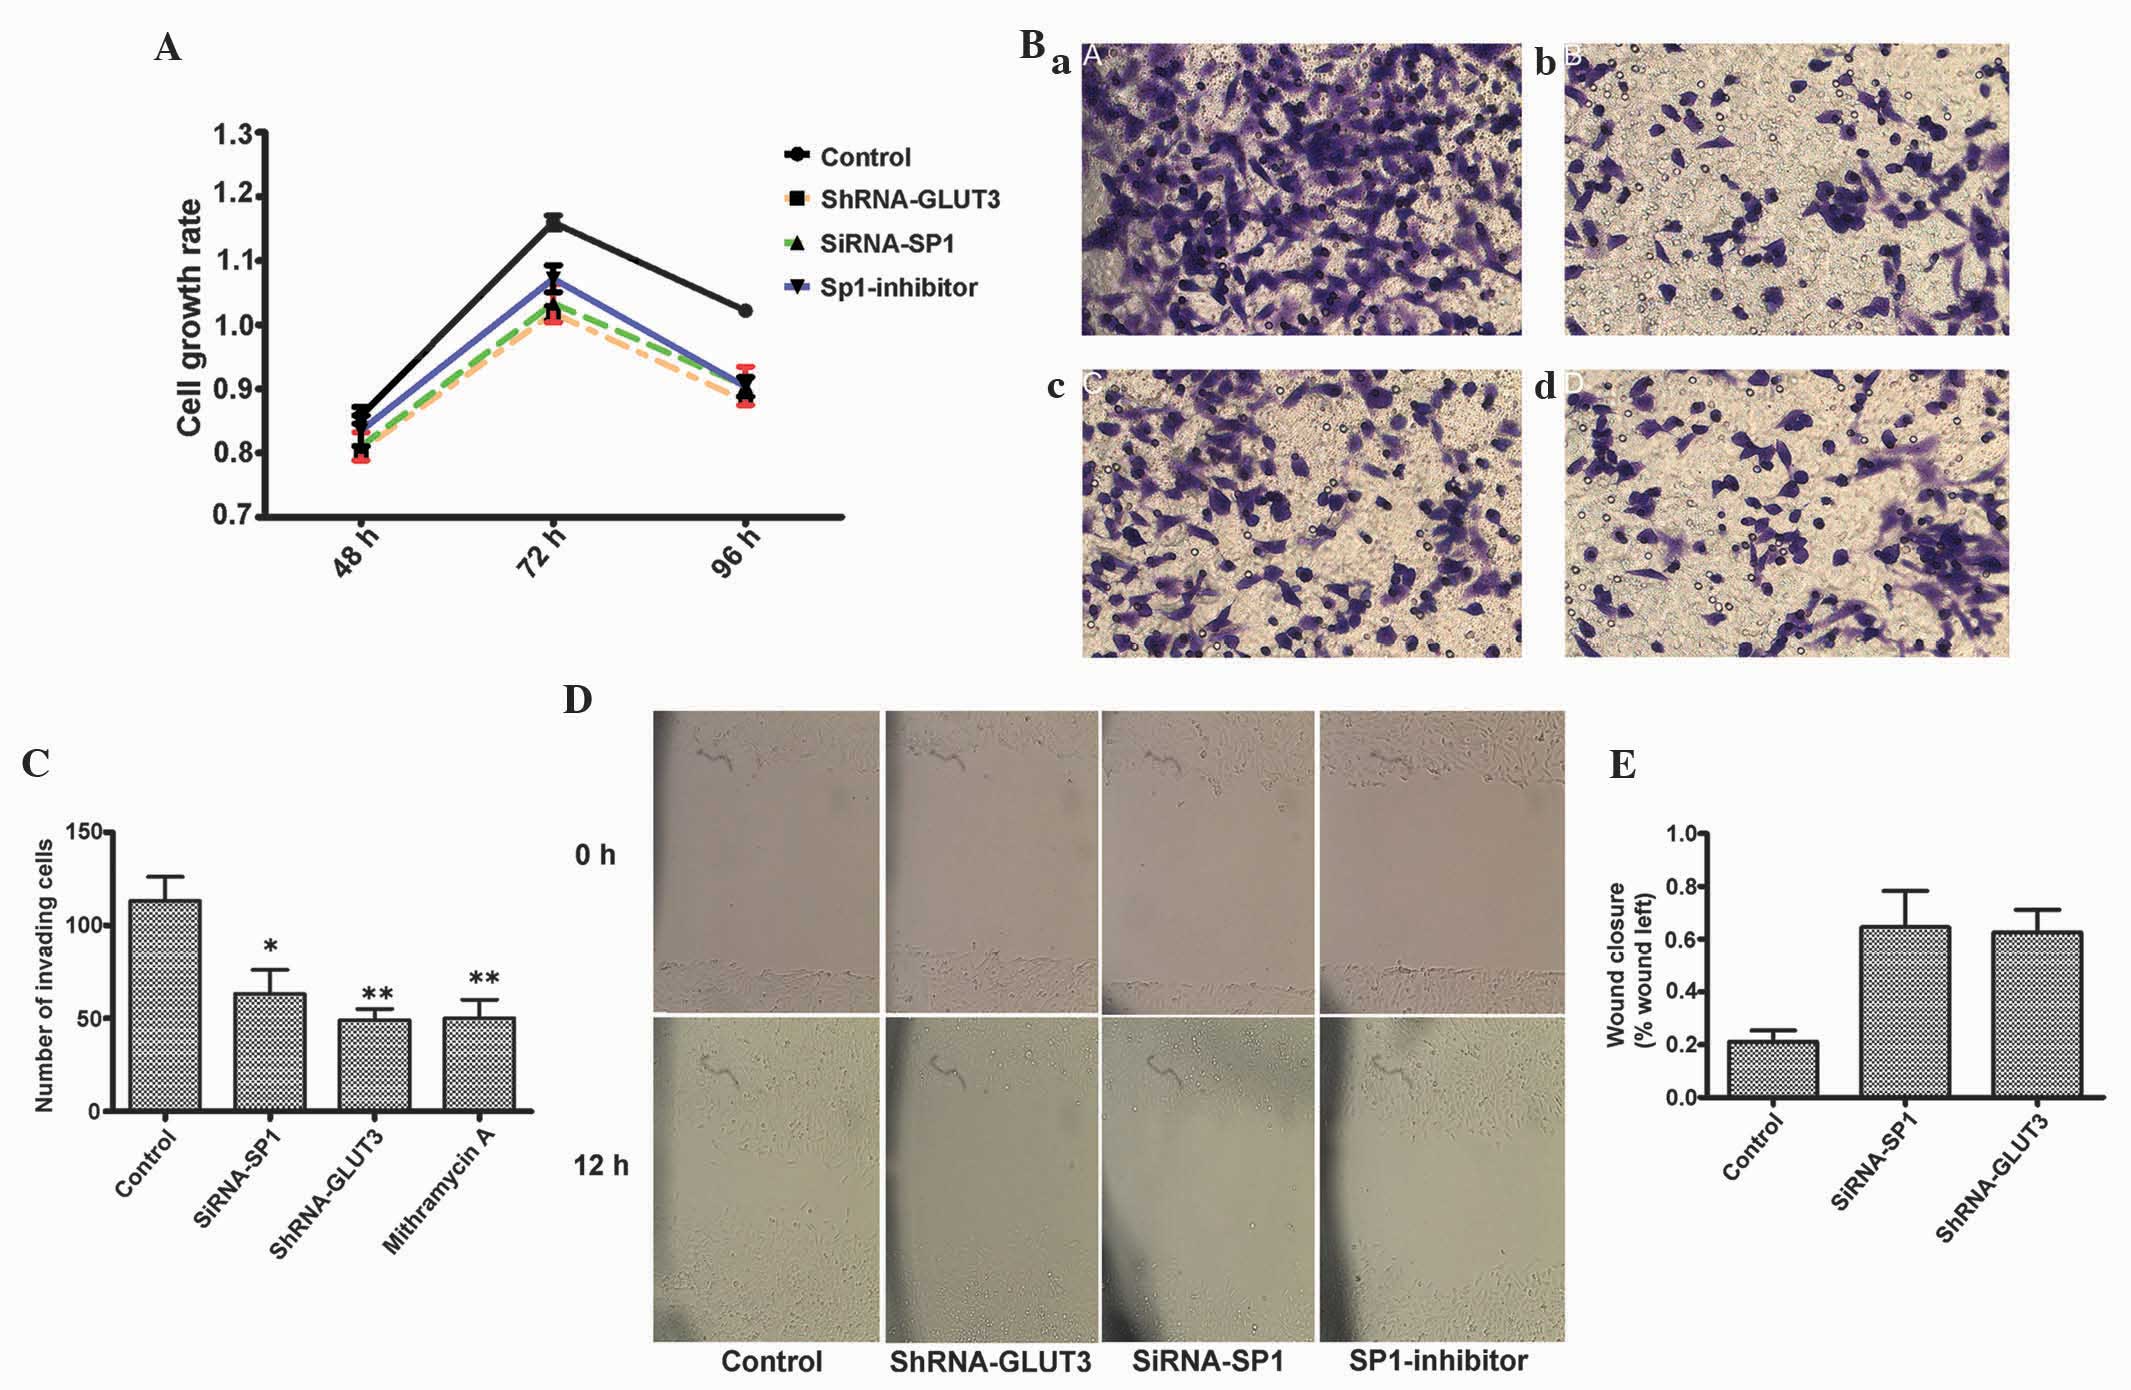
Subsequently, the effect of Sp1 depletion and
silencing of GLUT3 expression on the biological characteristics of
glioma cells was evaluated. The proliferation rates of U251 cells
treated with shRNA-GLUT3 (10 pmol), siRNA-Sp1 (20 pmol) or
mithramycin A (300 nM) were detected using an MTT assay. The
treated cells demonstrated significant growth inhibition compared
with the untreated cells (P<0.05; Fig.
3A).
The present study next examined the role of Sp1 in
GLUT3-mediated glioma invasion using Transwell assay. Sp1 depletion
using Sp1 RNAi or mithramycin A clearly inhibited glioma invasion
and the role of shRNA-GLUT3. Representative photomicrographs and
quantification of tumor cell invasion through matrigel are shown in
Fig. 3B and C.
In the scratch assay, the present study observed
that shRNA-GLUT3 transfected and Sp1 depleted cell migrated more
slowly compared with control cells (Fig.
3D). The values at 0 and 12 h demonstrated a significant
difference (Fig. 3E). The present
data confirmed that siRNA-Sp1 inhibits glioma cell migration in the
in vitro assay.
Discussion
The present study identified that in glioma cells
Sp1 is a transcription factor for GLUT3, and GLUT3 expression is
regulated by the Sp1 interaction with the GLUT3 promoter. The
present data also suggest that Sp1 knockdown or the use of an Sp1
inhibitor decreases glucose uptake and inhibits the biological
function of glioma cells and the GLUT3 blockade. Therefore,
demonstrating the contribution of Sp1 to tumor proliferation
through the regulation of GLUT3-mediated glucose metabolism.
It is well known that a variety of cancer cells
exhibit increased levels of glucose uptake and glycolysis as a
fundamental metabolic alteration, which is often associated with
elevated levels of GLUT family members, including GLUT1 and GLUT3
(9,21). In normal brain cells, GLUT3 gene
expression is confined to neurons; however, in highly malignant
glial cells of the human brain, GLUT3 may be the predominant
glucose transporter (7). Furthermore,
GLUT3 may contribute to the maintenance of human brain tumors, and
the expression of GLUT3 may be closely associated with various
pathological types of tumor (9).
However, the regulation of GLUT3 expression and its biological
significance in glioma tumorigenesis requires clarification. The
present study demonstrated that knockdown of GLUT3 expression
decreased the proliferation, invasion and migration of human glioma
cells. This indicates that GLUT3 is important in glioma cell
survival, growth and invasion. Furthermore, knockdown of GLUT3
expression decreased glucose uptake of the cells, suggesting that
GLUT3 may be critical in sugar metabolism.
It has been reported that Sp1 is an important
transcription factor, which enhances or represses the activity of
gene promoters involved in cell differentiation, cell cycle
progression and oncogenesis (10).
Sp1 is upregulated in human glioma and predicts a poor clinical
outcome (18). Sp1 mediates
transcriptional regulation of numerous genes, including MMP-2 and
purinergic receptor P2X7 in brain cells (18,19). In
addition, the Sp1 inhibitor mithramycin A has therapeutic effects
in numerous diseases, including brain cancer and neurodegeneration
(14,15,22,23).
Mithramycin A competitively binds to GC-rich promoter regions;
thereby replacing the transcription factor Sp1 (24,25).
Through this mechanism, mithramycin A inhibits the transcription of
Sp1-regulated genes, including v-myc avian myelocytomatosis viral
oncogene homolog and SRC proto-oncogene, non-receptor tyrosine
kinase (24,26). However, few studies demonstrate the
role of Sp1 in the regulation of glioma cell metabolism through
GULT3 expression.
The present data identify that Sp1 regulates the
expression of GLUT3 directly, and mithramycin A inhibits GLUT3
expression by binding to GGGGGCGGGGG regions of the GLUT3 promoter
in glioma cells. The present results were different from a previous
study in mice, in which Sp1 bound to the mouse Glut3 gene that
mediated the suppression of Glut3 gene expression in murine
neuroblasts and trophoblasts. Furthermore, in the present study
glucose uptake was decreased in Sp1 depleted cells or Sp1 inhibitor
treated cells. This suggests that Sp1 may also have a role in
glioma cell metabolism through GULT3 regulation. Additionally, Sp1
depletion or inhibition decreases glioma cells proliferation,
invasion and immigration. This indicates that Sp1 is important in
glioma cells survival, growth and invasion, which has been revealed
by certain studies in other types of tumors (14,16,17,26).
Indeed, mithramycin A is approved by the Food and Drug
Administration for the treatment of leukemia and testicular cancer.
In the future, it is possible that Sp1 may become a crucial
therapeutic target.
In summary, the present study suggests that GLUT3 is
extremely important in human glioma, and that its knockdown may
contribute to decreased biological activity and glucose uptake in
glioma cells. In addition, the present study identified that the
role of GLUT3 in glioma may be regulated by the Sp1 transcription
factor directly through binding to Sp1-sites in the GLUT3 promoter.
These results may provide a novel insight into glioma drug
treatment.
Acknowledgements
The present study was supported by National Natural
Science Foundation of China (grant no., 81260371).
References
|
1
|
Ahmed R, Oborski MJ, Hwang M, Lieberman FS
and Mountz JM: Malignant gliomas: Current perspectives in
diagnosis, treatment and early response assessment using advanced
quantitative imaging methods. Cancer Manag Res. 6:149–170.
2014.PubMed/NCBI
|
|
2
|
Chung WJ, Lyons SA, Nelson GM, Hamza H,
Gladson CL, Gillespie GY and Sontheimer H: Inhibition of cystine
uptake disrupts the growth of primary brain tumors. J Neurosci.
25:7101–7110. 2005. View Article : Google Scholar : PubMed/NCBI
|
|
3
|
Flavahan WA, Wu Q, Hitomi M, Rahim N, Kim
Y, Sloan AE, Weil RJ, Nakano I, Sarkaria JN, Stringer BW, et al:
Brain tumor initiating cells adapt to restricted nutrition through
preferential glucose uptake. Nat Neurosci. 16:1373–1382. 2013.
View Article : Google Scholar : PubMed/NCBI
|
|
4
|
Zheng J: Energy metabolism of cancer:
Glycolysis versus oxidative phosphorylation (Review). Oncol Lett.
4:1151–1157. 2012.PubMed/NCBI
|
|
5
|
Walker-Samuel S, Ramasawmy R, Torrealdea
F, Rega M, Rajkumar V, Johnson SP, Richardson S, Gonçalves M,
Parkes HG, Arstad E, et al: In vivo imaging of glucose
uptake and metabolism in tumors. Nat Med. 19:1067–1072. 2013.
View Article : Google Scholar : PubMed/NCBI
|
|
6
|
Rodríguez-Enríquez S, Marin-Hernández A,
Gallardo-Pérez JC and Moreno-Sánchez R: Kinetics of transport and
phosphorylation of glucose in cancer cells. J Cell Physiol.
221:552–559. 2009. View Article : Google Scholar : PubMed/NCBI
|
|
7
|
Boado RJ, Black KL and Pardridge WM: Gene
expression of GLUT3 and GLUT1 glucose transporters in human brain
tumors. Brain Res Mol Brain Res. 27:51–57. 1994. View Article : Google Scholar : PubMed/NCBI
|
|
8
|
Nagamatsu S, Sawa H, Wakizaka A and
Hoshino T: Expression of facilitative glucose transporter isoforms
in human brain tumors. J Neurochem. 61:2048–2053. 1993. View Article : Google Scholar : PubMed/NCBI
|
|
9
|
Nishioka T, Oda Y, Seino Y, Yamamoto T,
Inagaki N, Yano H, Imura H, et al: Distribution of the glucose
transporters in human brain tumors. Cancer Res. 52:3972–3979.
1992.PubMed/NCBI
|
|
10
|
Li L and Davie JR: The role of Sp1 and Sp3
in normal and cancer cell biology. Ann Anat. 192:275–283. 2010.
View Article : Google Scholar : PubMed/NCBI
|
|
11
|
Copland JA, Pardini AW, Wood TG, Yin D,
Green A, Bodenburg YH, Urban RJ and Stuart CA: IGF-1 controls GLUT3
expression in muscle via the transcriptional factor Sp1. Biochim
Biophys Acta. 1769:631–640. 2007. View Article : Google Scholar : PubMed/NCBI
|
|
12
|
Hsu TI, Wang MC, Chen SY, Yeh YM, Su WC,
Chang WC and Hung JJ: Sp1 expression regulates lung tumor
progression. Oncogene. 31:3973–3988. 2012. View Article : Google Scholar : PubMed/NCBI
|
|
13
|
Kou XX, Hao T, Meng Z, Zhou YH and Gan YH:
Acetylated Sp1 inhibits PTEN expression through binding to PTEN
core promoter and recruitment of HDAC1 and promotes cancer cell
migration and invasion. Carcinogenesis. 34:58–67. 2013. View Article : Google Scholar : PubMed/NCBI
|
|
14
|
Safe S, Imanirad P, Sreevalsan S, Nair V
and Jutooru I: Transcription factor Sp1, also known as specificity
protein 1 as a therapeutic target. Expert Opin Ther Targets.
18:759–769. 2014. View Article : Google Scholar : PubMed/NCBI
|
|
15
|
Sleiman SF, Langley BC, Basso M, Berlin J,
Xia L, Payappilly JB, Kharel MK, et al: Mithramycin is a
gene-selective Sp1 inhibitor that identifies a biological
intersection between cancer and neurodegeneration. J Neurosci.
31:6858–6870. 2011. View Article : Google Scholar : PubMed/NCBI
|
|
16
|
Malek A, Núñez LE, Magistri M, Brambilla
L, Jovic S, Carbone GM, Morís F and Catapano CV: Modulation of the
activity of Sp transcription factors by mithramycin analogues as a
new strategy for treatment of metastatic prostate cancer. PLoS One.
7:e351302012. View Article : Google Scholar : PubMed/NCBI
|
|
17
|
Copland JA, Pardini AW, Wood TG, Yin D,
Green A, Bodenburg YH, Urban RJ and Stuart CA: IGF-1 controls GLUT3
expression in muscle via the transcriptional factor Sp1. Biochim
Biophys Acta. 1769:631–640. 2007. View Article : Google Scholar : PubMed/NCBI
|
|
18
|
Guan H, Cai J, Zhang N, Wu J, Yuan J, Li J
and Li M: Sp1 is upregulated in human glioma, promotes
MMP-2-mediated cell invasion and predicts poor clinical outcome.
Int J Cancer. 130:593–601. 2012. View Article : Google Scholar : PubMed/NCBI
|
|
19
|
Garcia-Huerta P, Díaz-Hernandez M,
Delicado EG, Pimentel-Santillana M, Miras-Portugal MT and
Gómez-Villafuertes R: The specificity protein factor Sp1 mediates
transcriptional regulation of P2X7 receptors in the nervous system.
J Biol Chem. 287:44628–44644. 2012. View Article : Google Scholar : PubMed/NCBI
|
|
20
|
Maher F, Davies-Hill TM, Lysko PG,
Henneberry RC and Simpson IA: Expression of two glucose
transporters, GLUT1 and GLUT3, in cultured cerebellar neurons:
Evidence for neuron-specific expression of GLUT3. Mol Cell
Neurosci. 2:351–360. 1991. View Article : Google Scholar : PubMed/NCBI
|
|
21
|
Macheda ML, Rogers S and Best JD:
Molecular and cellular regulation of glucose transporter (GLUT)
proteins in cancer. J Cell Physiol. 202:654–662. 2005. View Article : Google Scholar : PubMed/NCBI
|
|
22
|
Seznec J, Silkenstedt B and Naumann U:
Therapeutic effects of the Sp1 inhibitor mithramycin A in
glioblastoma. J Neurooncol. 101:365–377. 2011. View Article : Google Scholar : PubMed/NCBI
|
|
23
|
Amann T and Hellerbrand C: GLUT1 as a
therapeutic target in hepatocellular carcinoma. Expert Opin Ther
Targets. 13:1411–1427l. 2009. View Article : Google Scholar : PubMed/NCBI
|
|
24
|
Blume SW, Snyder RC, Ray R, Thomas S,
Koller CA and Miller DM: Mithramycin inhibits Sp1 binding and
selectively inhibits transcriptional activity of the dihydrofolate
reductase gene in vitro and in vivo. J Clin Invest.
88:1613–1621. 1991. View Article : Google Scholar : PubMed/NCBI
|
|
25
|
Van Dyke MW and Dervan PB: Chromomycin,
mithramycin and olivomycin binding sites on heterogeneous
deoxyribonucleic acid. Footprinting with (methidiumpropyl-EDTA)
iron (II). Biochemistry. 22:2373–2377. 1983. View Article : Google Scholar : PubMed/NCBI
|
|
26
|
Remsing LL, Bahadori HR, Carbone GM,
McGuffie EM, Catapano CV and Rohr J: Inhibition of c-src
transcription by mithramycin: Structure-activity relationships of
biosynthetically produced mithramycin analogues using the c-src
promoter as target. Biochemistry. 42:8313–8324. 2003. View Article : Google Scholar : PubMed/NCBI
|