Introduction
Hepatocellular carcinoma (HCC) is the third most
common cause of cancer-associated mortality worldwide (1). While local treatments, including
surgical resection and radiofrequency ablation (RFA), lead to
favorable outcomes for early-stage HCC (2,3), no
effective treatment has been established for advanced HCC that is
not amenable to surgical resection, and the prognosis of advanced
HCC is poor.
Sorafenib (Nexavar; Bayer, Leverkusen, Germany) is
an oral multi-targeted tyrosine kinase inhibitor (4–6) that is
indicated for unresectable advanced HCC and significantly improves
the progression-free and overall survival times of patients
(7,8).
Sorafenib has been widely used for the treatment of unresectable
advanced HCC, but it is an expensive drug that has certain adverse
effects, such as hand-foot skin reaction and diarrhea (7). In order for patients to continue
treatment with sorafenib, it is essential to evaluate the early
response to sorafenib. Sorafenib is characterized by antitumor
effects, including tumor growth inhibition and antiangiogenic
effects, which makes it challenging to evaluate the therapeutic
effects using the conventional Response Evaluation Criteria in
Solid Tumors (RECIST) (9).
Alternative evaluation criteria, including tumor necrosis and
intratumoral hemodynamics, such as the modified RECIST (10), Response Evaluation Criteria in Cancer
of the Liver (11) and Choi criteria
(12), have been recommended.
A previous study reported the use of Arrival time
parametric imaging (AtPI) (13) with
contrast-enhanced ultrasonography (CEUS) using Sonazoid (Daiichi
Sankyo, Tokyo, Japan) to evaluate early responses to sorafenib in
patients with advanced HCC (14). In
this method, based upon the color mapping images obtained by AtPI,
the mean arrival time of the contrast agent at the target lesion
from the starting point, which was a large artery near the lesion,
was calculated to obtain the difference between prior to and 2
weeks subsequent to the administration of sorafenib. Blood flow
velocity was considered to have been reduced when the difference
was ≥0 [mean time (MT) (+) group] and to have been increased when
the difference was <0 [MT(−) group]. When the overall survival
was compared between the groups, the survival time was
significantly longer in the MT(+) group compared with the MT(−)
group. Thus, MT, which is an index of objective evaluation by AtPI,
may be useful for evaluating the early response to sorafenib.
In general, AtPI is used to evaluate any changes in
intratumoral hemodynamics, such as changes in the blood flow
velocity. In the present study, the presence or absence of
intratumoral necrosis was compared with the intratumoral vascular
architecture on micro-flow imaging (MFI) (15–17)
(Toshiba Medical Systems, Otawara, Japan) in the post-vascular
phase by CEUS with Sonazoid prior to and subsequent to sorafenib
administration, to determine whether the visual changes may be
applied to the evaluation of the therapeutic effects of
sorafenib.
Materials and methods
Patient sample
In total, 94 patients with advanced HCC underwent
treatment with sorafenib at Toho University Medical Center, Omori
Hospital (Tokyo, Japan) between April 2009 and July 2013. Of the 94
patients, 45 patients agreed to participate the present study and
CEUS was performed prior to sorafenib administration. However, of
the 45 patients, 26 patients were able to take sorafenib for more
than 4 weeks, and were followed up by CEUS with Sonazoid prior to
and 2–4 weeks subsequent to the sorafenib administration.
Therefore, these 26 patients were enrolled in the present study.
They were all male patients with a mean age of 69.3±6.9 years. The
underlying liver diseases were hepatitis B in 2 patients, hepatitis
C in 16 patients, alcoholic hepatitis in 7 patients and other in 1
patient. The Child-Pugh classification (18) was A for 21 patients and B for 5
patients. The median α-fetoprotein (AFP) level prior to
administration was 639.4 ng/ml, and the median level of
des-γ-carboxy prothrombin (DCP) was 617 mAU/ml. The initial dose of
sorafenib was 800 mg/day for 4 patients, 400 mg/day for 14 patients
and 200 mg/day for 8 patients. The present study was approved by
the Ethical Review Board of Toho University Medical Center, Omori
Hospital. Informed consent was obtained from all patients for
inclusion in the current study.
CEUS
CEUS was performed prior to and 2–4 weeks subsequent
to the administration of sorafenib. One lesion that could be
followed throughout the study period was selected. Ultrasonography
(US) was used in each patient to standardize evaluations, and CEUS
was performed in the same cross-section, under the same conditions,
at all time points. The ultrasound equipment used in the present
examination was an SSA-790A ultrasound (Toshiba Medical Systems,
Otawara, Japan) with a Toshiba PVT-375BT convex probe (3.75-MHz
center frequency). The imaging mode was wideband harmonic imaging
(pulse subtraction), with transmission and reception frequencies of
1.8 and 3.5 MHz, respectively. The mechanical index (MI) for
acoustic output was set to 0.2; the dynamic range was set to 60–65
dB. A single focus point was set at the deep site of the lesion,
and a bolus intravenous injection of 0.5 ml Sonazoid was
administered via a left cubital venous line followed by flushing
with 10 ml normal saline. In the post-vascular phase 10–15 min
subsequent to the injection of Sonazoid, 0.5 ml Sonazoid was
intravenously injected for the target lesion using the re-injection
method (19) to compare the presence
or absence of intratumoral necrosis 60–90 sec subsequent to the
re-injection, in addition to the intratumoral vascular architecture
on the MFI findings prior to and subsequent to the administration
of sorafenib.
MFI
MFI was introduced by Sugimoto et al
(15). Briefly, maximum-hold
processing started immediately subsequent to the burst scan. The
burst scan consisted of high MI (1.3–1.6) scanning for 5 frames.
Low MI (0.16–0.30) scanning was commenced again, immediately
subsequent to the MI burst scanning, to visualize the fresh
microbubble contrast agent flowing into the scanning volume. The
maximum intensity holding sequence was started simultaneously with
flash replenishment low MI imaging, which stored and exhibited the
maximum brightness at each pixel. The accumulation time for each
MFI sequence was 5–7 sec, depending on the perfusion of the target
tissue. Target lesions that exhibited non-enhancement (cystic-like)
subsequent to re-injection were considered to indicate intratumoral
necrosis. The intratumoral vascular architecture shown on the MFI
findings was classified into three groups, as follows: Vd group, in
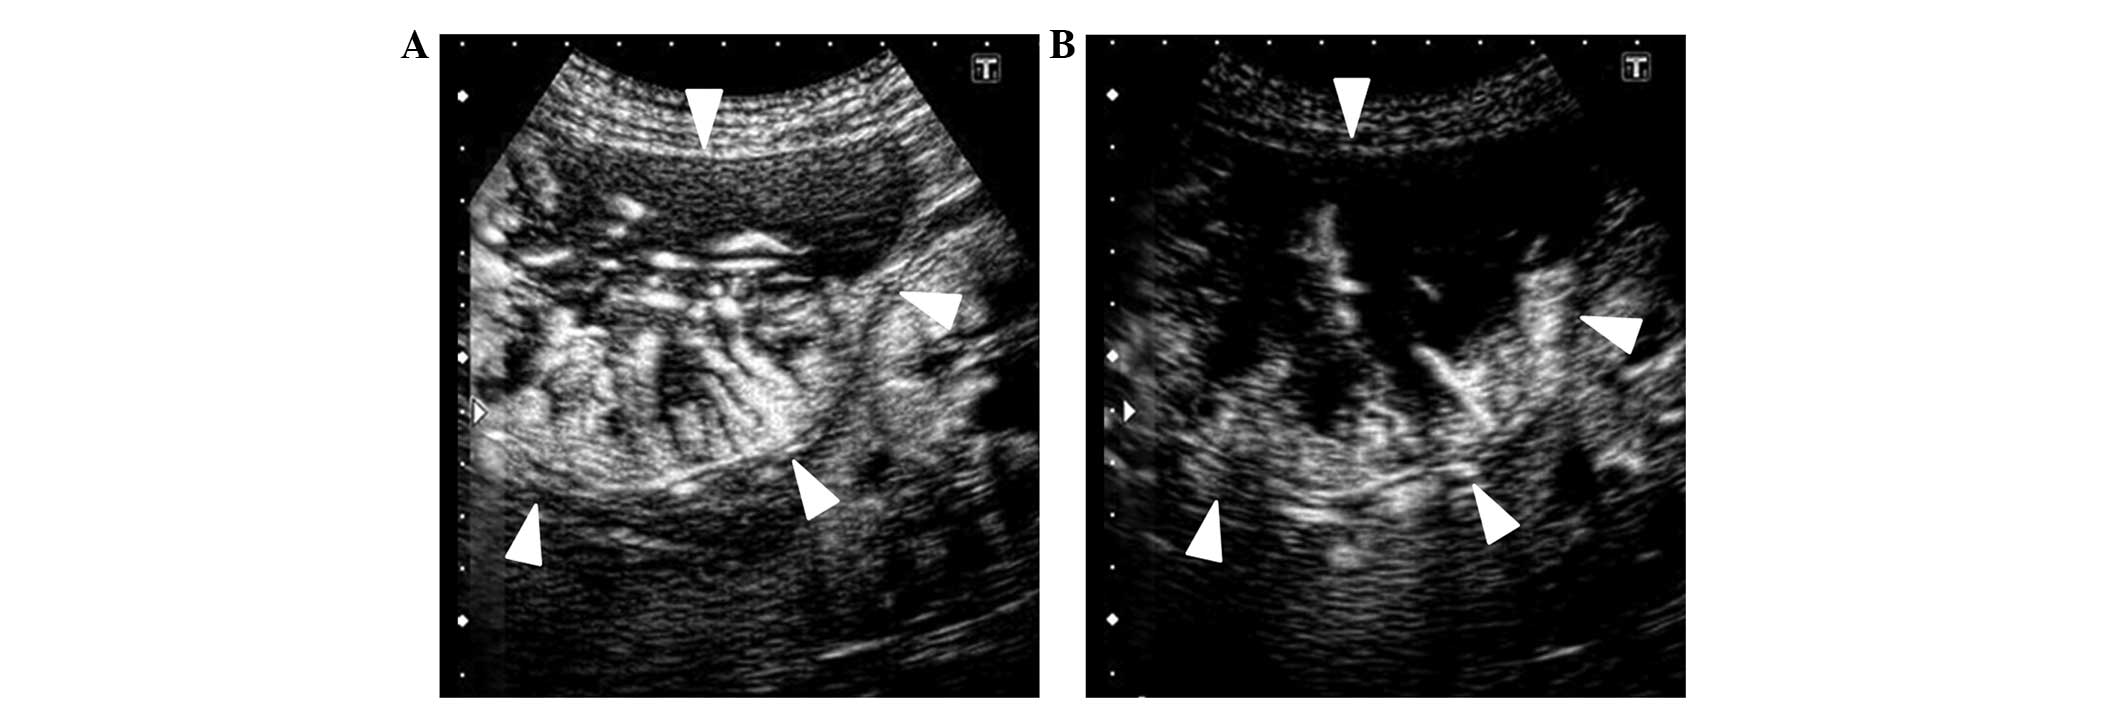
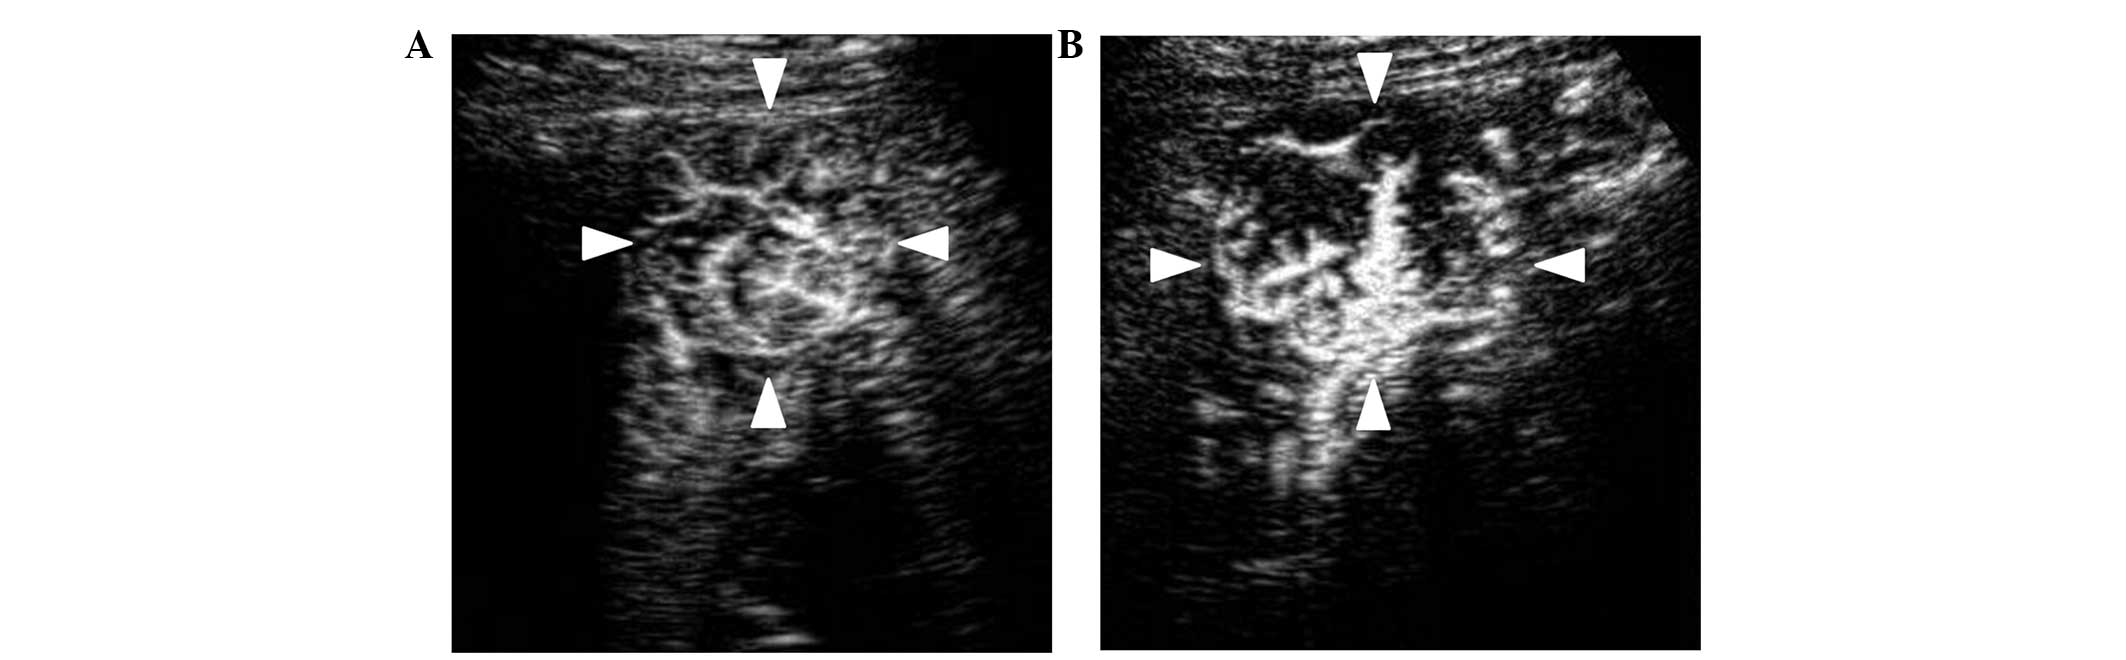
which intratumoral vessels visually narrowed or decreased (Fig. 1); Vnc group, in which intratumoral
vessels remained unchanged; and Vi group, in which intratumoral
vessels were thickened or increased (Fig.
2). The classification was performed by 2 ultrasonography
specialists, who classified the MFI findings independently without
knowledge of the clinical characteristics or therapeutic course of
each patient. The observers reviewed the images and clips stored on
the hard disc for offline analysis.
Statistical analysis
The degree of inter-observer agreement was
calculated using the κ-statistic. In general, a κ-statistic value
>0.75 is considered to indicate excellent agreement, 0.4–0.75
indicates good agreement and <0.4 indicates poor agreement
(20). In the Vd, Vnc and Vi groups,
the following 12 patient and tumor background characteristics were
reported: Mean age; gender; underlying liver disease, consisting of
hepatitis B, hepatitis C, alcoholic hepatitis and other; Child-Pugh
classification (A or B); previous treatment, such as transarterial
chemoembolization, RFA and surgical resection; median AFP level;
median DCP level; Barcelona Clinic Liver Cancer (BCLC) staging
classification (B or C) (21);
presence or absence of portal vein tumor thrombus (PVTT); presence
or absence of extrahepatic metastasis; median duration of sorafenib
administration; and presence or absence of intratumoral necrosis
(Table I).
 | Table I.Characteristics of the patients. |
Table I.
Characteristics of the patients.
| Variables | Vd group, n | Vnc group, n | Vi group, n |
|---|
| Total | 11 | 10 | 5 |
| Age,
yearsa | 66.9±6.8 | 70.2±6.2 | 72.8±8.2 |
| Gender |
|
|
|
| Male | 11 | 10 | 5 |
|
Female | 0 | 0 | 0 |
| Etiology |
|
|
|
|
Alcohol | 3 | 2 | 2 |
| HBV | 1 | 0 | 1 |
| HCV | 6 | 8 | 2 |
|
Other | 1 | 0 | 0 |
| Child Pugh
classification |
|
|
|
| A | 10 | 8 | 3 |
| B | 1 | 2 | 2 |
| Previous
treatment |
|
|
|
| Yes | 8 | 8 | 4 |
|
TACE | 6 | 7 | 4 |
|
RFA | 4 | 6 | 2 |
|
Surgical
resection | 3 | 2 | 0 |
| No | 3 | 2 | 1 |
| Median AFP,
ng/ml | 151.9 | 1,153.8 | 13,276.0 |
| Median DCP,
mAU/ml | 553.0 | 1,444.5 | 681.0 |
| BCLC |
|
|
|
| B | 5 | 8 | 3 |
| C | 6 | 2 | 2 |
| PVTT |
|
|
|
| Yes | 2 | 1 | 0 |
| No | 9 | 9 | 5 |
| Extrahepatic
metastasis |
|
|
|
| Yes | 2 | 0 | 0 |
| No | 9 | 10 | 5 |
| Median period of
sorafenib administration, months (range) | 15.6 (5.7–33.3) | 9.7 (3.6–51.3) | 3.6 (1.8–11.5) |
| Intratumoral
necrosis |
|
|
|
|
Yes | 4 | 3 | 1 |
| No | 7 | 7 | 4 |
The survival time was calculated using the
Kaplan-Meier method, in order to compare times between the
intratumoral necrosis (+) and (−) groups, and among the Vd, Vnc and
Vi groups based on the MFI findings. The survival time was
calculated from the start of sorafenib administration to the final
follow-up or mortality.
Statistical analysis was performed using SPSS
version 11.0 for Windows (SPSS, Inc., Chicago, IL, USA). P<0.05
were considered to indicate a statistically significant
difference.
Results
The mean initial dose of sorafenib, median
observation period and median survival time (MST) in all 26
patients were 400±196 mg/day, 9.4 months (range, 3.1–51.3 months)
and 9.5 months (95% CI, 5.7–13.0), respectively. The concordance
rate (κ-statistic) of the MFI findings between the 2 observers was
0.865, which was considered excellent agreement. The MFI findings
were observed in 11 patients in the Vd group, 10 patients in the
Vnc group, and 5 patients in the Vi group.
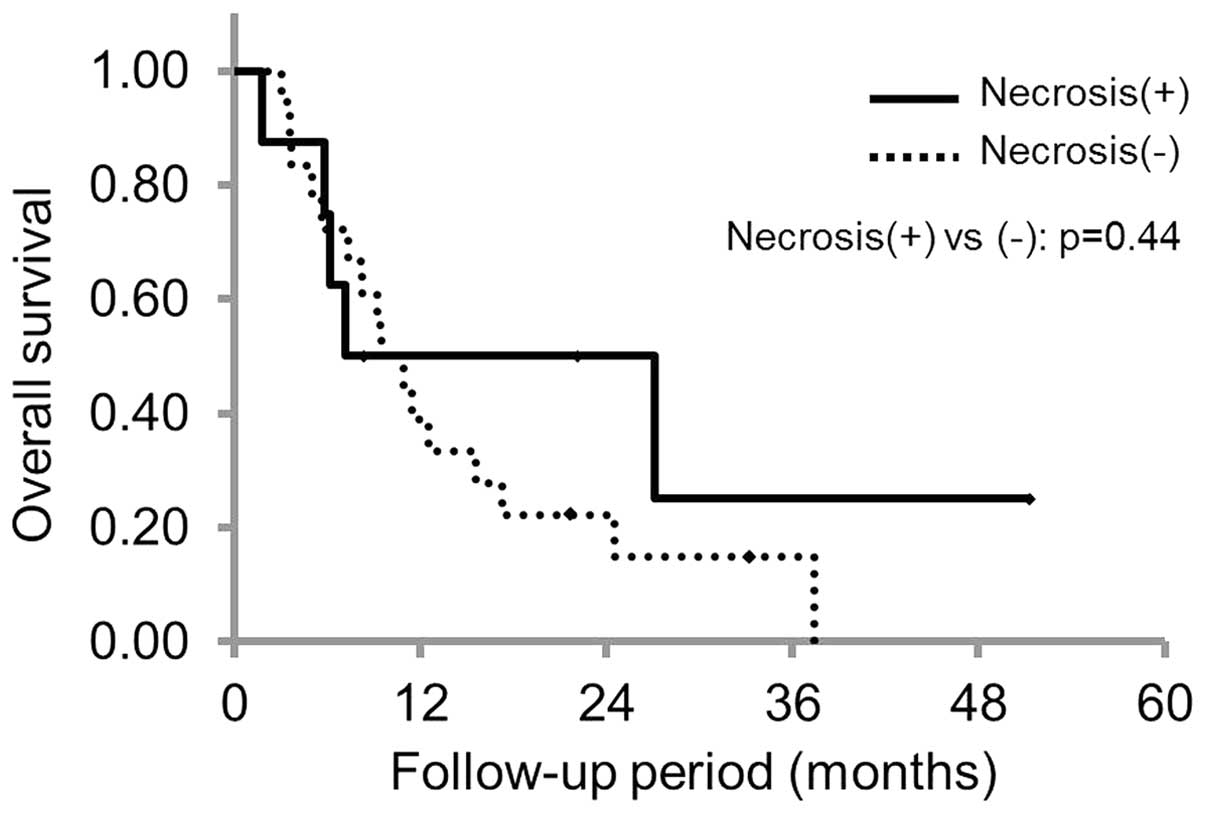
Of the 26 patients, 8 patients showed intratumoral
necrosis and 18 patients did not, and the MST was 7.2 months (95%
CI, 2.2–12.2) and 9.5 months (95% CI, 5.1–13.8) in the patient with
and without intratumoral necrosis, respectively. There were no
statistically significant differences between the groups (P=0.44;
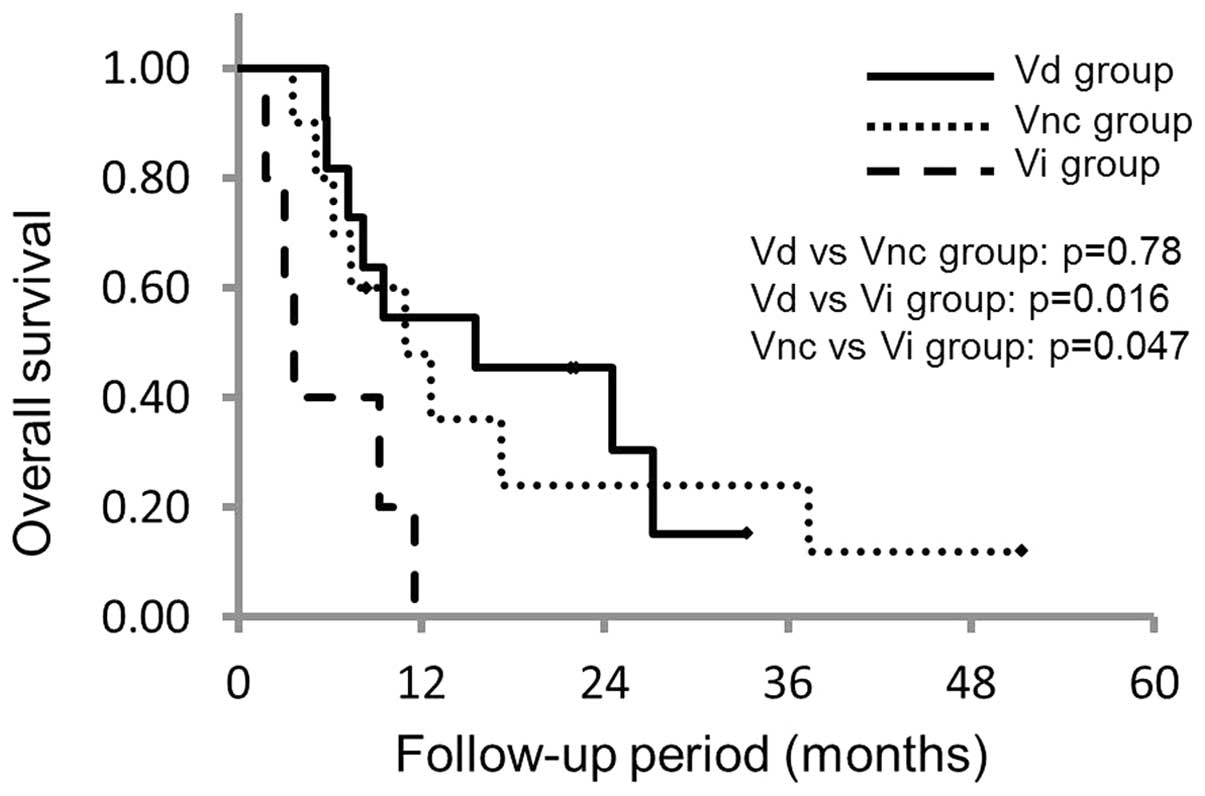
Fig. 3). Based upon the MFI findings,
the MST in the Vd, Vnc and Vi groups was 15.6 months (95% CI,
5.0–23.3), 11.0 months (95% CI, 3.5–17.6) and 3.6 months (95% CI,
1.2–6.0), respectively. The P-values for the differences between
the Vd and Vnc groups, Vd and Vi groups, and Vnc and Vi groups were
0.78, 0.016 and 0.047, respectively, which indicated that the
survival time decreased significantly in the Vi group (Fig. 4).
Discussion
MFI was developed as combination of the
flash-replenishment sequence and the maximum intensity holding
sequence was expected to make it possible to visualize vascular
structures with high spatial resolution and vascular continuity
(15–17).
Moschouris et al (22) reported the therapeutic effect of
sorafenib based on the findings of non-contrast-enhanced US and
CEUS using SonoVue (Bracco, Milan, Italy) prior to and subsequent
to sorafenib administration, but there has been no comparison study
using CEUS with Sonazoid; in particular, MFI on imaging prior to
and subsequent to sorafenib administration. The present study
compared the presence or absence of intratumoral necrosis, as well
as the intratumoral vascular architecture, based upon MFI findings
in the post-vascular phase by CEUS using Sonazoid, prior to and
subsequent to sorafenib administration, and determined whether the
visual changes may be applied to evaluation of therapeutic effects
of sorafenib.
According to Moschouris et al (22), who studied 21 patients with HCC by US
and CEUS using SonoVue, intratumoral bleeding or necrosis occurred
in 50% of patients undergoing sorafenib treatment, showing the
therapeutic efficacy of treatment, which was visible as a cystic
transformation by US. In general, necrosis may be attributed to the
characteristic therapeutic effects of sorafenib. The present
comparison between the intratumoral necrosis (+) and (−) groups
suggested a tendency towards prolongation of survival in the
intratumoral necrosis (+) group, but there was no statistically
significant difference in the survival time between the 2 groups.
However, the small sample size and the short observation period of
the present study may have contributed to this finding. A future
study should increase the number of patients and the duration of
the observation period.
Tanaka et al (23) and Sato et al (24) classified the MFI findings based on the
MFI pattern classification, in order to allow comparison with the
histological examination of HCC tumor biopsy and surgically excised
specimens. Tanaka et al (23)
reported that the MFI pattern classification may aid the evaluation
of the differentiation grade of HCC. In addition, Sato et al
(24) reported that the MFI pattern
classification may be an individual predictive factor of a poor
prognosis in patients with HCC. These studies suggest that the MFI
findings of the intratumoral vascular architecture may aid the
evaluation of the differentiation grade of HCC.
Furthermore, the present study demonstrated that the
survival time was significantly worse in the Vi group, in which the
intratumoral vascular architecture increased on the MFI imaging
subsequent to sorafenib administration, compared with the Vd and
Vnc groups. There was no difference in survival time between the Vd
group, in which the intratumoral vessels decreased visually, and
the Vnc group, in which intratumoral vessels were not changed. It
is possible that the aforementioned changes in the vascular
architecture are consistent with those in the study by Jain
(25), but the antiangiogenic effect
of sorafenib may change the intratumoral vascular architecture
during the clinical course. The present study also suggested that
the change in the intratumoral vascular architecture may predict
the therapeutic efficacy of sorafenib.
Limitations of the present study include the small
sample size, short observation period, evaluation by examination of
a single crosssectional ultrasonography image and a single target
lesion, and the non-quantitative nature of the analysis. Evaluation
of a single cross-sectional ultrasonography image and a single
target lesion may be controversial when considering the
multicentric carcinogenesis of HCC (26,27).
However, previous studies investigating the early evaluation of the
therapeutic effects of sorafenib by AtPI using CEUS also
demonstrated significant results, regardless of the evaluation of a
single cross-sectional US image of a single target lesion (14). Furthermore, while the present study
was a non-quantitative analysis, the visual changes in the MFI
findings may be objective, as the concordance rate (κ-statistic) of
the MFI findings between the 2 observers was 0.865, which was
considered to indicate excellent agreement. The findings of the
present study suggested that the comparison of the intratumoral
vascular architecture using MFI prior to and subsequent to
sorafenib administration may be applied to the evaluation of the
therapeutic effects of sorafenib. Notably, sorafenib is an
expensive drug that has certain adverse effects (7). Therefore, a change from sorafenib to
other early treatments, according to the classification of MFI
findings, may be considered.
In conclusion, the findings of the present study
suggested that visual evaluation of the intratumoral vascular
architecture using MFI may be applied to the evaluation of the
therapeutic effect of sorafenib, even when the sample size is
small. The early evaluation of the therapeutic effects of sorafenib
in patients with HCC using CEUS with Sonazoid may be of use.
Acknowledgements
The authors wish to thank Takahide Kudo, Kenichi
Maruyama and the staff of Department of Clinical Functional
Physiology, Toho University Medical Center, Omori Hospital.
References
|
1
|
Parkin DM, Bray F, Ferlay J and Pisani P:
Global cancer statistics, 2002. CA Cancer J Clin. 55:74–108. 2005.
View Article : Google Scholar : PubMed/NCBI
|
|
2
|
Chen MS, Li JQ, Zheng Y, Guo RP, Liang HH,
Zhang YQ, Lin XJ and Lau WY: A prospective randomized trial
comparing percutaneous local ablative therapy and partial
hepatectomy for small hepatocellular carcinoma. Ann Surg.
243:321–328. 2006. View Article : Google Scholar : PubMed/NCBI
|
|
3
|
Yi HM, Zhang W, Ai X, Li KY and Deng YB:
Radiofrequency ablation versus surgical resection for the treatment
of hepatocellular carcinoma conforming to the Milan criteria:
Systemic review and meta-analysis. Int J Clin Exp Med. 7:3150–3163.
2014.PubMed/NCBI
|
|
4
|
Wilhelm SM, Carter C, Tang L, Wilkie D,
McNabola A, Rong H, Chen C, Zhang X, Vincent P, McHugh M, et al:
BAY 43–9006 exhibits broad spectrum oral antitumor activity and
targets the RAF/MEK/ERK pathway and receptor tyrosine kinases
involved in tumor progression and angiogenesis. Cancer Res.
64:7099–7109. 2004. View Article : Google Scholar : PubMed/NCBI
|
|
5
|
Chang YS, Adnane J, Trail PA, Levy J,
Henderson A, Xue D, Bortolon E, Ichetovkin M, Chen C, McNabola A,
et al: Sorafenib (BAY 43–9006) inhibits tumor growth and
vascularization and induces tumor apoptosis and hypoxia in RCC
xenograft models. Cancer Chemother Pharmacol. 59:561–574. 2007.
View Article : Google Scholar : PubMed/NCBI
|
|
6
|
Hotte SJ and Hirte HW: BAY 43–9006: Early
clinical data in patients with advanced solid malignancies. Curr
Pharm Des. 8:2249–2253. 2002. View Article : Google Scholar : PubMed/NCBI
|
|
7
|
Llovet JM, Ricci S, Mazzaferro V, Hilgard
P, Gane E, Blanc JF, de Oliveira AC, Santoro A, Raoul JL, Forner A,
et al: Sorafenib in advanced hepatocellular carcinoma. N Engl J
Med. 359:378–390. 2008. View Article : Google Scholar : PubMed/NCBI
|
|
8
|
Cheng AL, Kang YK, Chen Z, Tsao CJ, Qin S,
Kim JS, Luo R, Feng J, Ye S, Yang TS, et al: Efficacy and safety of
sorafenib in patients in the Asia-Pacific region with advanced
hepatocellular carcinoma: A phase III randomised, double-blind,
placebo-controlled trial. Lancet Oncol. 10:25–34. 2009. View Article : Google Scholar : PubMed/NCBI
|
|
9
|
Eisenhauer EA, Therasse P, Bogaerts J,
Schwartz LH, Sargent D, Ford R, Dancey J, Arbuck S, Gwyther S,
Mooney M, et al: New response evaluation criteria in solid tumours:
Revised RECIST guideline (version 1.1). Eur J Cancer. 45:228–247.
2009. View Article : Google Scholar : PubMed/NCBI
|
|
10
|
Lencioni R and Llovet JM: Modified RECIST
(mRECIST) assessment for hepatocellular carcinoma. Semin Liver Dis.
30:52–60. 2010. View Article : Google Scholar : PubMed/NCBI
|
|
11
|
Kudo M, Kubo S, Takayasu K, Sakamoto M,
Tanaka M, Ikai I, Furuse J, Nakamura K and Makuuchi M: Liver Cancer
Study Group of Japan (Committee for Response Evaluation Criteria in
Cancer of the Liver, Liver Cancer Study Group of Japan): Response
evaluation criteria in cancer of the liver (RECICL) proposed by the
liver cancer study group of Japan (2009 revised version). Hepatol
Res. 40:686–692. 2010. View Article : Google Scholar : PubMed/NCBI
|
|
12
|
Choi H, Charnsangavej C, Faria SC,
Macapinlac HA, Burgess MA, Patel SR, Chen LL, Podoloff DA and
Benjamin RS: Correlation of computed tomography and positron
emission tomography in patients with metastatic gastrointestinal
stromal tumor treated at a single institution with imatinib
mesylate: Proposal of new computed tomography response criteria. J
Clin Oncol. 25:1753–1759. 2007. View Article : Google Scholar : PubMed/NCBI
|
|
13
|
Watanabe M, Shiozawa K, Takahashi M, Wakui
N, Otsuka Y, Kaneko H, Tanikawa K, Shibuya K, Kamiyama N and Sumino
Y: Parametric imaging using contrast-enhanced ultrasound with
Sonazoid for hepatocellular carcinoma. J Med Ultrasonics. 37:81–86.
2010. View Article : Google Scholar
|
|
14
|
Shiozawa K, Watanabe M, Kikuchi Y, Kudo T,
Maruyama K and Sumino Y: Evaluation of sorafenib for hepatocellular
carcinoma by contrast-enhanced ultrasonography: A pilot study.
World J Gastroenterol. 18:5753–5758. 2012. View Article : Google Scholar : PubMed/NCBI
|
|
15
|
Sugimoto K, Moriyasu F, Kamiyama N, Metoki
R, Yamada M, Imai Y and Iijima H: Analysis of morphological
vascular changes of hepatocellular carcinoma by microflow imaging
using contrast-enhanced sonography. Hepatol Res. 38:790–799. 2008.
View Article : Google Scholar : PubMed/NCBI
|
|
16
|
Yang H, Liu GJ, Lu MD, Xu HX and Xie XY:
Evaluation of the vascular archirecture of hepatocellular carcinoma
by micro flow imaging: Pathologic correlation. J Ultrasound Med.
26:461–467. 2007.PubMed/NCBI
|
|
17
|
Linden RA, Trabulsi EJ, Forsberg F,
Gittens PR, Gomella LG and Halpern EJ: Contrast enhanced ultrasound
flash replenishment method for directed prostate biopsies. J Urol.
178:2354–2358. 2007. View Article : Google Scholar : PubMed/NCBI
|
|
18
|
Pugh RN, Murray-Lyon IM, Dawson JL,
Pietroni MC and Williams R: Transection of the oesophagus for
bleeding oesophageal varices. Br J Surg. 60:646–649. 1973.
View Article : Google Scholar : PubMed/NCBI
|
|
19
|
Kudo M: Hepatocellular carcinoma 2009 and
beyond: From the surveillance to molecular targeted therapy.
Oncology. 75(Suppl 1): 1–12. 2008. View Article : Google Scholar : PubMed/NCBI
|
|
20
|
Zhao H, Yao JL, Wang Y and Zhou KR:
Detection of small hepatocellular carcinoma: Comparison of dynamic
enhancement magnetic resonance imaging and multiphase
multirow-detector helical CT scanning. World J Gastroenterol.
13:1252–1256. 2007. View Article : Google Scholar : PubMed/NCBI
|
|
21
|
Bruix J, Sala M and Llovet JM:
Chemoembolization for hepatocellular carcinoma. Gastroenterology.
127(Suppl 1): S179–S188. 2004. View Article : Google Scholar : PubMed/NCBI
|
|
22
|
Moschouris H, Malagari K, Gkoutzios P,
Kalokairinou M, Stamatiou K, Chatzimichail K, Kornezos I,
Karagiannis E, Kiltenis M and Papadaki MG: Intermediate and
advanced hepatocellular carcinoma treated with the antiangiogenic
agent sorafenib. Evaluation with unenhanced and contrast-enhanced
ultrasonography. Med Ultrason. 14:87–94. 2012.PubMed/NCBI
|
|
23
|
Tanaka H, Iijima H, Higashiura A, Yoh K,
Ishii A, Takashima T, Sakai Y, Aizawa N, Iwata K, Ikeda N, et al:
New malignant grading system for hepatocellular carcinoma using the
Sonazoid contrast agent for ultrasonography. J Gastroenterol.
49:755–763. 2014. View Article : Google Scholar : PubMed/NCBI
|
|
24
|
Sato K, Tanaka S, Mitsunori Y, Mogushi K,
Yasen M, Aihara A, Ban D, Ochiai T, Irie T, Kudo A, et al:
Contrast-enhanced intraoperative ultrasonography for vascular
imaging of hepatocellular carcinoma: Clinical and biological
significance. Hepatology. 57:1436–1447. 2013. View Article : Google Scholar : PubMed/NCBI
|
|
25
|
Jain RK: Normalization of tumor
vasculature: An emerging concept in antiangiogenic therapy.
Science. 307:58–62. 2005. View Article : Google Scholar : PubMed/NCBI
|
|
26
|
Matsui O, Kadoya M, Kameyama T, Yoshikawa
J, Takashima T, Nakanuma Y, Unoura M, Kobayashi K, Izumi R and Ida
M: Benign and malignant nodules in cirrhotic livers: Distinction
based on blood supply. Radiology. 178:493–497. 1991. View Article : Google Scholar : PubMed/NCBI
|
|
27
|
Sakamoto M, Hirohashi S and Shimosato Y:
Early stages of multistep hepatocarcinogenesis: Adenomatous
hyperplasia and early hepatocellular carcinoma. Hum Pathol.
22:172–178. 1991. View Article : Google Scholar : PubMed/NCBI
|