Introduction
The complement system is a major component of the
innate immune system. Activation of the cascade reaction of the
complement system leads to the cytolytic destruction of cancer
cells, and it is the primary pathway for protecting the human body
from bacterial infections and cancer cells. Decay-accelerating
factor (CD55) and membrane attack complex (MAC)-inhibitory protein
(CD59) belong to the family of membrane-bound complement regulatory
proteins (1). CD59 is a regulatory
protein that participates in the inhibition of MAC formation, while
CD55 inhibits the formation of C3 and C5 convertases by preventing
their cleavage (2). The primary role
of CD59 and CD55 is the protection of normal host cells from damage
caused by the accidental activation of the complement system
(3).
Over-expression of CD59 and CD55 has been observed
in a variety of solid tumors, including non-Hodgkin lymphoma and
colon, breast and ovarian cancer. An increase in CD55 and CD59
expression has also been associated with a poor response to
treatment, an increased tumour stage and shorter disease-free
survival time of patients (4–7). Consequently, the activity of complement
inhibitors CD59 and CD55 may be associated with the mechanism of
cancer cell escape (3).
Ovarian cancer is the fourth leading cause of
mortality among women, following breast, lung and colon cancer, and
poses a major challenge for treatment, due to late diagnosis, low
therapeutic efficiency and increasing chemoresistance. Ovarian
cancer is treated by surgery and chemotherapy with a combination of
taxanes and platinum (8,9). Complement system activation is a
potential target for immunotherapy in ovarian cancer, using
complement-activating monoclonal antibodies, and the mechanism of
action is associated with complement-mediated cytotoxicity.
However, this method may have limited efficacy, due to the
expression of natural complement inhibitors present in ovarian
cancer cells, including CD55, CD59 and membrane cofactor protein
(CD46) (4). Therefore, complement
inhibitors may represent the primary cause of failure for
immunotherapy with monoclonal antibodies. It appears that an
improved understanding of the regulatory mechanisms of complement
system inhibitor expression, and their function in ovarian and
other gynecological cancer, is essential for improving
immunotherapy (4).
Cytokines play a major role in the regulation of
complement inhibitory protein expression, and are identified in the
tumour microenvironment. The key cytokines in this regulation
appear to be interleukins-6 and 8 (IL-6 and IL-8), since increased
levels of these cytokines have been identified in the ascites fluid
of ovarian cancer patients (10,11). In
vitro IL-6 is secreted by mesothelial cells, fibroblasts,
macrophages and ovarian tumour cells, while IL-8 is secreted by
endothelial cells and mesothelial cells, monocytes and ovarian
tumour cells (11). Therefore, the
tumour microenvironment is significant in all processes of ovarian
cancer progression.
The primary aim of the present study was to
characterize the expression of the complement system inhibitors
CD59 and CD55 at the mRNA and protein level in the human ovarian
cancer A2780 cell line following IL-6 and IL-8 stimulation. The
present results revealed that CD59 and CD55 proteins present on
ovarian carcinoma cells appear to be key factors in protecting
malignant ovarian cells from complement-mediated death.
Materials and methods
Cell culture
The human ovarian cancer A2780 cell line was
obtained from the European Collection of Cell Culture (Salisbury,
UK). A2780 cells were cultured in RPMI-1640 medium supplemented
with L-glutamine, penicillin-streptomycin (10 U/ml-100 µg/ml) and
10% fetal bovine serum (FBS) (all Sigma-Aldrich, Munich, Germany),
in a humidified atmosphere of 95% air and 5% CO2 at
37°C. This cell line was selected, since A2780 cells do not produce
IL-6, but expresses the IL-6 receptor (12).
Stimulation of cells
Human ovarian carcinoma cells were seeded into petri
dishes (5 ml; 3×10⁵ cells/ml). The cells were washed
with phosphate buffered saline (PBS) with Ca2+ and Mg2+ (Sigma
Aldrich, St. Louis, MO, USA) and next were incubated in medium RPMI
1640 supplemented with L-glutamine containing various
concentrations of IL-6 and IL-8. Human IL-6 and IL-8 were purchased
from Sigma-Aldrich. Subsequent to a 24 h of incubation, the
supernatant was collected and transferred to Eppendorf tubes and
frozen at −80°C for subsequent studies. The cells were incubated
with 5 mM EDTA in phosphate-buffered saline (PBS) for 10 min.
Subsequently, the cells were transferred to new tubes and
centrifuged at 12,000 × g for 10 min at 4°C. The supernatant was
removed and precipitated cells were stored at −80°C.
Cell proliferation assay
The effect of IL-6 and IL-8 on the proliferation of
ovarian cancer cells was determined using a
3-(4,5-dimethylthiazol-2-yl)-2,5-diphenyltetrazolium bromide (MTT)
assay. The cells were cultured at a density of 5×10³
cells per well in 96-well cell culture plates (Nunc™ MicroWell™;
Thermo Fisher Scientific, Inc., Waltham, MA, USA). Subsequent to a
24 h incubation, the cells were exposed to various concentrations
of IL-6 and IL-8 (1, 10 and 100 ng/ml). In total 96 h later, the
proliferation of the treated cells was assessed using the MTT
assay. The amount of formazan dye was determined by quantifying its
absorbance at 570 nm using the FLUOstar Omega Microplate Reader
(BMG Labtech GmbH, Ortenberg, Germany). The proliferation rate (PR)
was measured by the following equation: PR (%) = (absorbance of
treatment probe / absorbance of control probe) × 100%.
Enzyme-linked immunosorbent assay
(ELISA)
To determine the amount of soluble CD59 and CD55 in
the cell medium, an ELISA Kit for Human CD59 glycoprotein and ELISA
Kit for Human Complement decay-accelerating factor were used (EIAab
Science Co., Ltd., Wuhan, China), according to the manufacturer's
protocol.
Reverse transcription-quantitative
polymerase chain reaction (RT-qPCR)
After a 24 h stimulation with various concentrations
of IL-6 and IL-8 (1, 10 and 100 ng/ml), total cellular RNA from the
cultured cells was isolated using a High Pure RNA Isolation kit
(Roche Diagnostics GmbH, Mannheim, Germany), according to the
manufacturer's protocol. Extracted RNA was purified and diluted in
DNase and RNase free water. Quality and quantity of the isolated
RNA was measured by a NanoDrop® spectrophotometer
(Thermo Fisher Scientific, Inc.). DNase I (Roche Diagnostic GmbH,
Mannheim, Germany) was used when total RNA was isolated (180U per
sample) but not when RT-qPCR was performed. The qPCR was performed
according to the manufacturer's protocol: TaqMan® Gene
Expression Assays Protocol (Applied Biosystems®; Thermo
Fisher Scientific, Inc.) Complementary cDNA was synthesized from 2
µg total RNA using SuperScript II Reverse Transcriptase
(Invitrogen™; Thermo Fisher Scientific, Inc.). Subsequently, 1 µl
of the resulting cDNA solution was used to amplify cDNA using
TaqMan® Gene Expression Assays with specific primers to
CD59 (assay ID, Hs00174141_m1) and CD55 (assay ID, Hs00892618_m1),
according to the manufacturer's protocol (Applied
Biosystems®; Thermo Fisher Scientific, Inc.). qPCR was
performed in an ABI 7500 Fast Real-Time PCR System (Applied
Biosystems®). Relative CD59 and CD55 expression was
measured using the 2-(∆∆Cq) method (13), using β-actin (assay ID, Hs99999903_m1;
Applied Biosystems®) as the endogenous control. Three
independent experiments were performed.
Western blotting
Cells were lysed in RIPA lysis buffer (1%
Tergitol®, 0.5% sodium deoxycholate, 0.1% SDS, 1 mM
EDTA, 1 mM EGTA, 1 mM NaVO4, 20 mM NaF, 0.5 DTT, 1 mM
PMSF, PIC in PBS). The lysates were centrifuged at 12,000 × g for
10 min at 4°C. The protein concentration was then measured using a
Bicinchoninic Acid Protein Assay kit. In total, 20 mg of protein
samples were electrophoresed using 10% sodium dodecyl sulfate
polyacrylamide gel electrophoresis under reducing conditions, and
transferred to polyvinylidene difluoride membranes. Non-specific
binding sites on the membranes were blocked with 5% skim milk in
Tris-buffered saline containing 0.05% Tween 20 for 1 h at room
temperature, and the membranes were subsequently probed with rabbit
polyclonal anti-CD59 (catalog no., sc-28805), mouse monoclonal
anti-CD55 (catalog no., sc-59092) and mouse monoclonal β-actin
antibodies (catalog no., sc-47778) (dilution, 1:1,000; Santa Cruz
Biotechnology, Inc., Dallas, TX, USA) overnight at 4°C. This was
followed by an incubation at room temperature for 1 h with
horseradish peroxidase-conjugated goat anti-rabbit and anti-mouse
secondary antibodies (cat nos., sc-2004 and sc-2005, respectively;
dilution, 1:2,000; Santa Cruz Biotechnology, Inc.). The membranes
were visualized with a chemiluminescence substrate kit (Pierce™ ECL
Western Blotting Substrate; Thermo Scientific, Inc.). Densitometric
analysis was performed with Image J version 1.48 software,
normalized to β-actin values.
Immunofluorescence
Cells were grown in 8-well cell culture slides
(Nunc™ MicroWell™) in RPMI-1640 with 10% FBS. Subsequent to a 24 h
stimulation with various concentration of IL-6 and IL-8 (1, 10 and
100 ng/ml), the cell culture slides were fixed in 3.7% formaldehyde
for 15 min and permeabilized in 0.1% Triton X-100 for 10 min.
Following permeabilization, the cell culture slides were blocked in
3% bovine serum albumin (Sigma Aldrich) for 15 min, and following
washing were incubated with mouse monoclonal anti-CD59 (catalog
no., ab9182) and anti-CD55 (catalog no., ab1422) antibodies (Abcam,
Cambridge, UK) at 10 µg/ml overnight at 4°C. Subsequently, the
cells were incubated at room temperature with a donkey anti-mouse
IgG Alexa Fluor® 488 conjugated secondary antibody
(green fluorescence; catalog no., ab150105; dilution, 1:1,000;
Abcam) for 90 min. Fluorescence labeling was analyzed under a
fluorescent microscope (BX51; Olympus Corporation, Hamburg,
Germany).
Statistical analysis
Statistical analysis was performed with GraphPad
Prism 5 software (GraphPad Software, Inc., La Jolla, CA, USA).
Multiple comparisons were performed using one-way analysis of
variance followed by Tukey's post hoc test. Data are
presented as the mean ± standard deviation. All statistical tests
were two-sided and P<0.05 was considered to indicate a
statistically significant difference.
Results
Proliferation of ovarian cancer cells
following stimulation by IL-6 and IL-8
It has been widely reported that IL-6 and IL-8
reinforce the proliferation of ovarian cancer cells (11). However, the present study demonstrated
that IL-6 and IL-8 did not affect ovarian cancer A2780 cell
proliferation (Fig. 1); subsequent to
a 96 h incubation with IL-6 or IL-6/IL-8 combination, no
significant differences were noted between control and treated
cells.
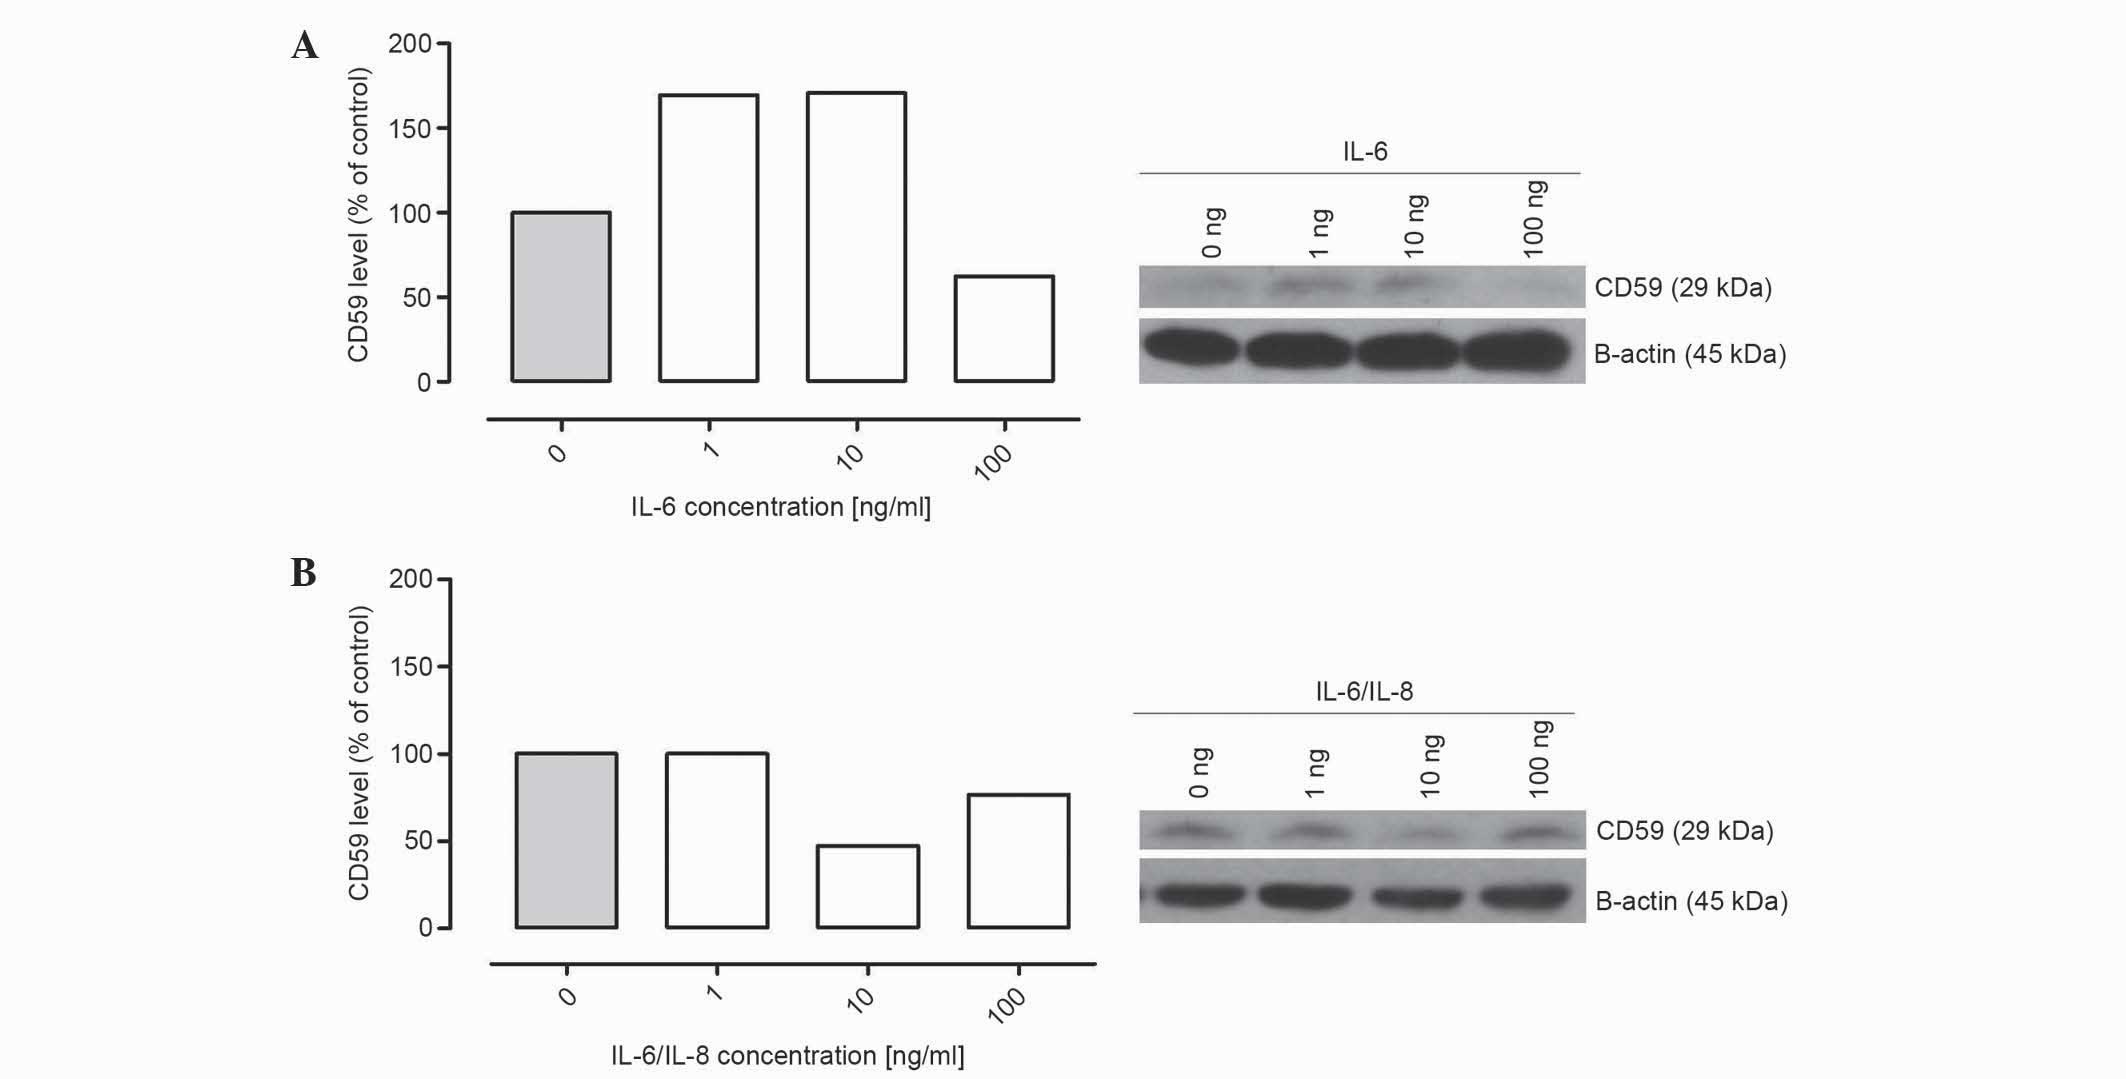
IL-6 and IL-8 treatment affects the
production of membrane-bound complement regulatory protein CD59 by
ovarian cancer cells
Western blotting was performed to investigate the
effect of IL-6 and IL-8 on the expression of CD55 and CD59 in
ovarian cancer A2780 cells. The cells were incubated with various
concentrations of IL-6 alone or IL-6/IL-8 combination. The present
results revealed that the cancer cells treated with IL-6 alone and
in combination with IL-8 expressed the membrane-bound complement
inhibitor CD59. The protein level of CD59 was increased subsequent
to a 24 h incubation with IL-6, and a 1 ng/ml concentration of IL-6
was sufficient to enhance the expression of CD59 (Fig. 2A). However, the level of CD59 was
deceased compared with the control following an incubation with 100
ng/ml IL-6 (Fig. 2A). Abnormal
alterations in the protein expression of CD59 were observed when
the cells were incubated with IL-6/IL-8 combination; the protein
level was decreased following an incubation with 10 ng/ml IL-6/IL-8
combination (Fig. 2B). These results
should be confirmed, since only representative results are
presented by the present study.
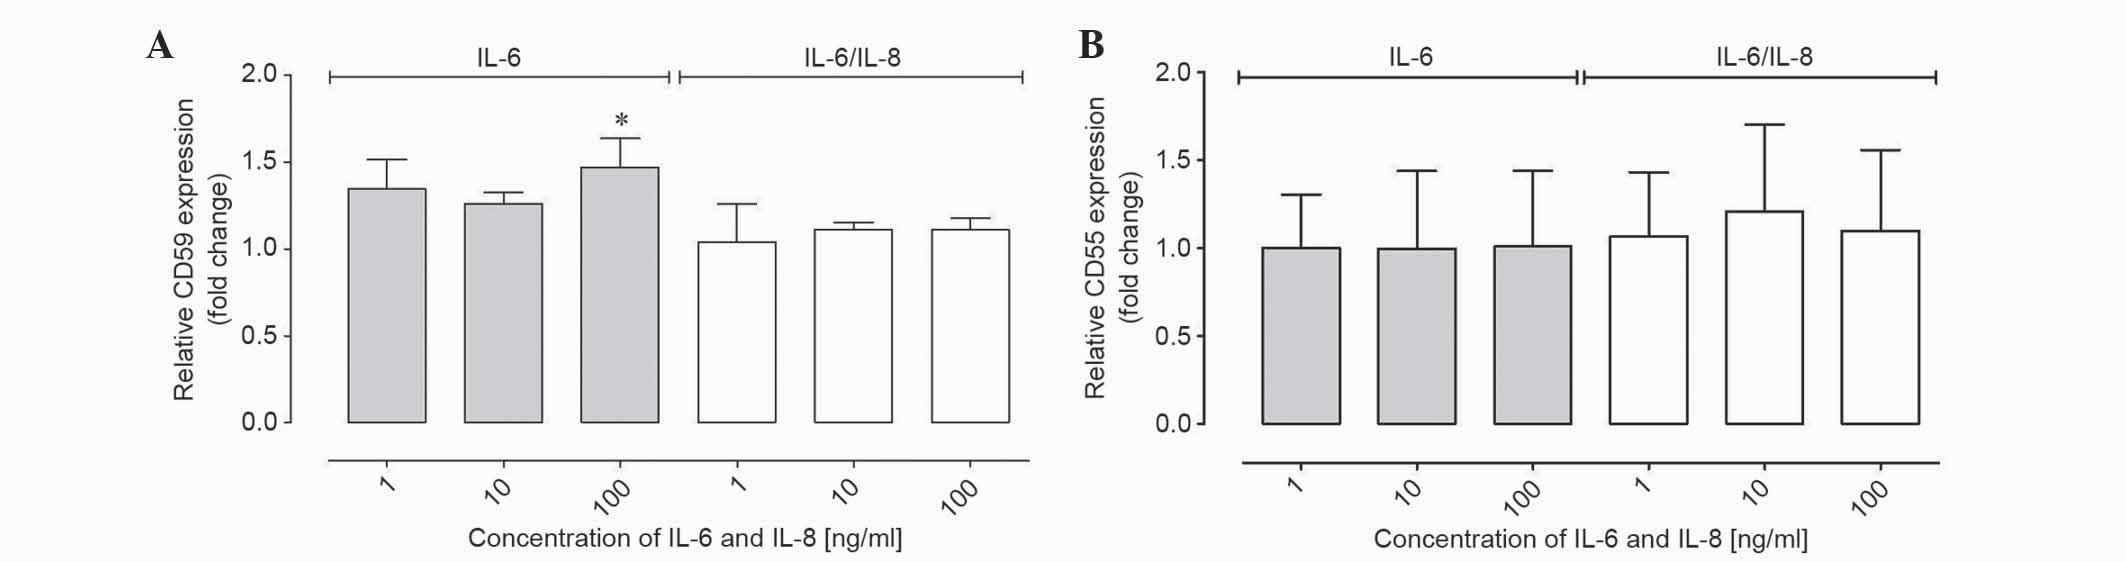
IL-6 and IL-8 affected the CD59 and
CD55 gene expression at the mRNA level in ovarian cancer cells
RT-qPCR was performed to determine the CD55 and CD59
gene expression at the mRNA level. To present the results of
relative gene expression, the ΔΔCq method was used, with β-actin as
the reference gene and non-IL-6 and IL-8 treated samples as a
control. The mRNA level was analyzed in the same qPCR reaction
using a TaqMan probe. The results demonstrated that the relative
CD59 expression from the cells at the mRNA level was increased
compared with the control following stimulation with IL-6; however,
these results were not statistically significant (Table I; Fig.
3A). In samples incubated with IL-6 at 100 ng/ml the fold
change was ~1.5, which was statistically significant compared with
the control (P<0.01; Table I;
Fig. 3A). Therefore, the relative
expression of CD59 was increased compared with control samples at
higher concentrations of IL-6 treatment. In samples incubated with
IL-6/8 combination, no significant differences in expression were
observed (Table I; Fig. 3A). The expression of CD55 in samples
incubated with IL-6 and IL-6/IL-8 combination was unchanged
compared with the control (Table I;
Fig. 3B).
 | Table I.Quantitative polymerase chain analysis
results for CD55 and CD59 expression in human ovarian cancer A2780
cells treated with various combinations of IL-6 or IL-6/IL-8
combination. |
Table I.
Quantitative polymerase chain analysis
results for CD55 and CD59 expression in human ovarian cancer A2780
cells treated with various combinations of IL-6 or IL-6/IL-8
combination.
| A, CD55 |
|---|
|
|---|
| IL-6 | IL-6/IL-8
combination |
|---|
|
|
|---|
| Concentration,
ng/ml | R ± SD | Concentration,
ng/ml | R ± SD |
|---|
|
1 | 1.00±0.30 |
1 | 1.07±0.36 |
| 10 | 1.00±0.44 | 10 | 1.21±0.50 |
| 100 | 1.01±0.43 | 100 | 1.10±0.46 |
|
| B, CD59 |
|
| IL-6 | IL-6/IL-8
combination |
|
|
| Concentration,
ng/ml | R ± SD | Concentration,
ng/ml | R ± SD |
|
|
1 | 1.35±0.17 |
1 | 1.04±0.22 |
| 10 | 1.26±0.07 | 10 | 1.11±0.04 |
| 100 |
1.47±0.17a | 100 | 1.11±0.07 |
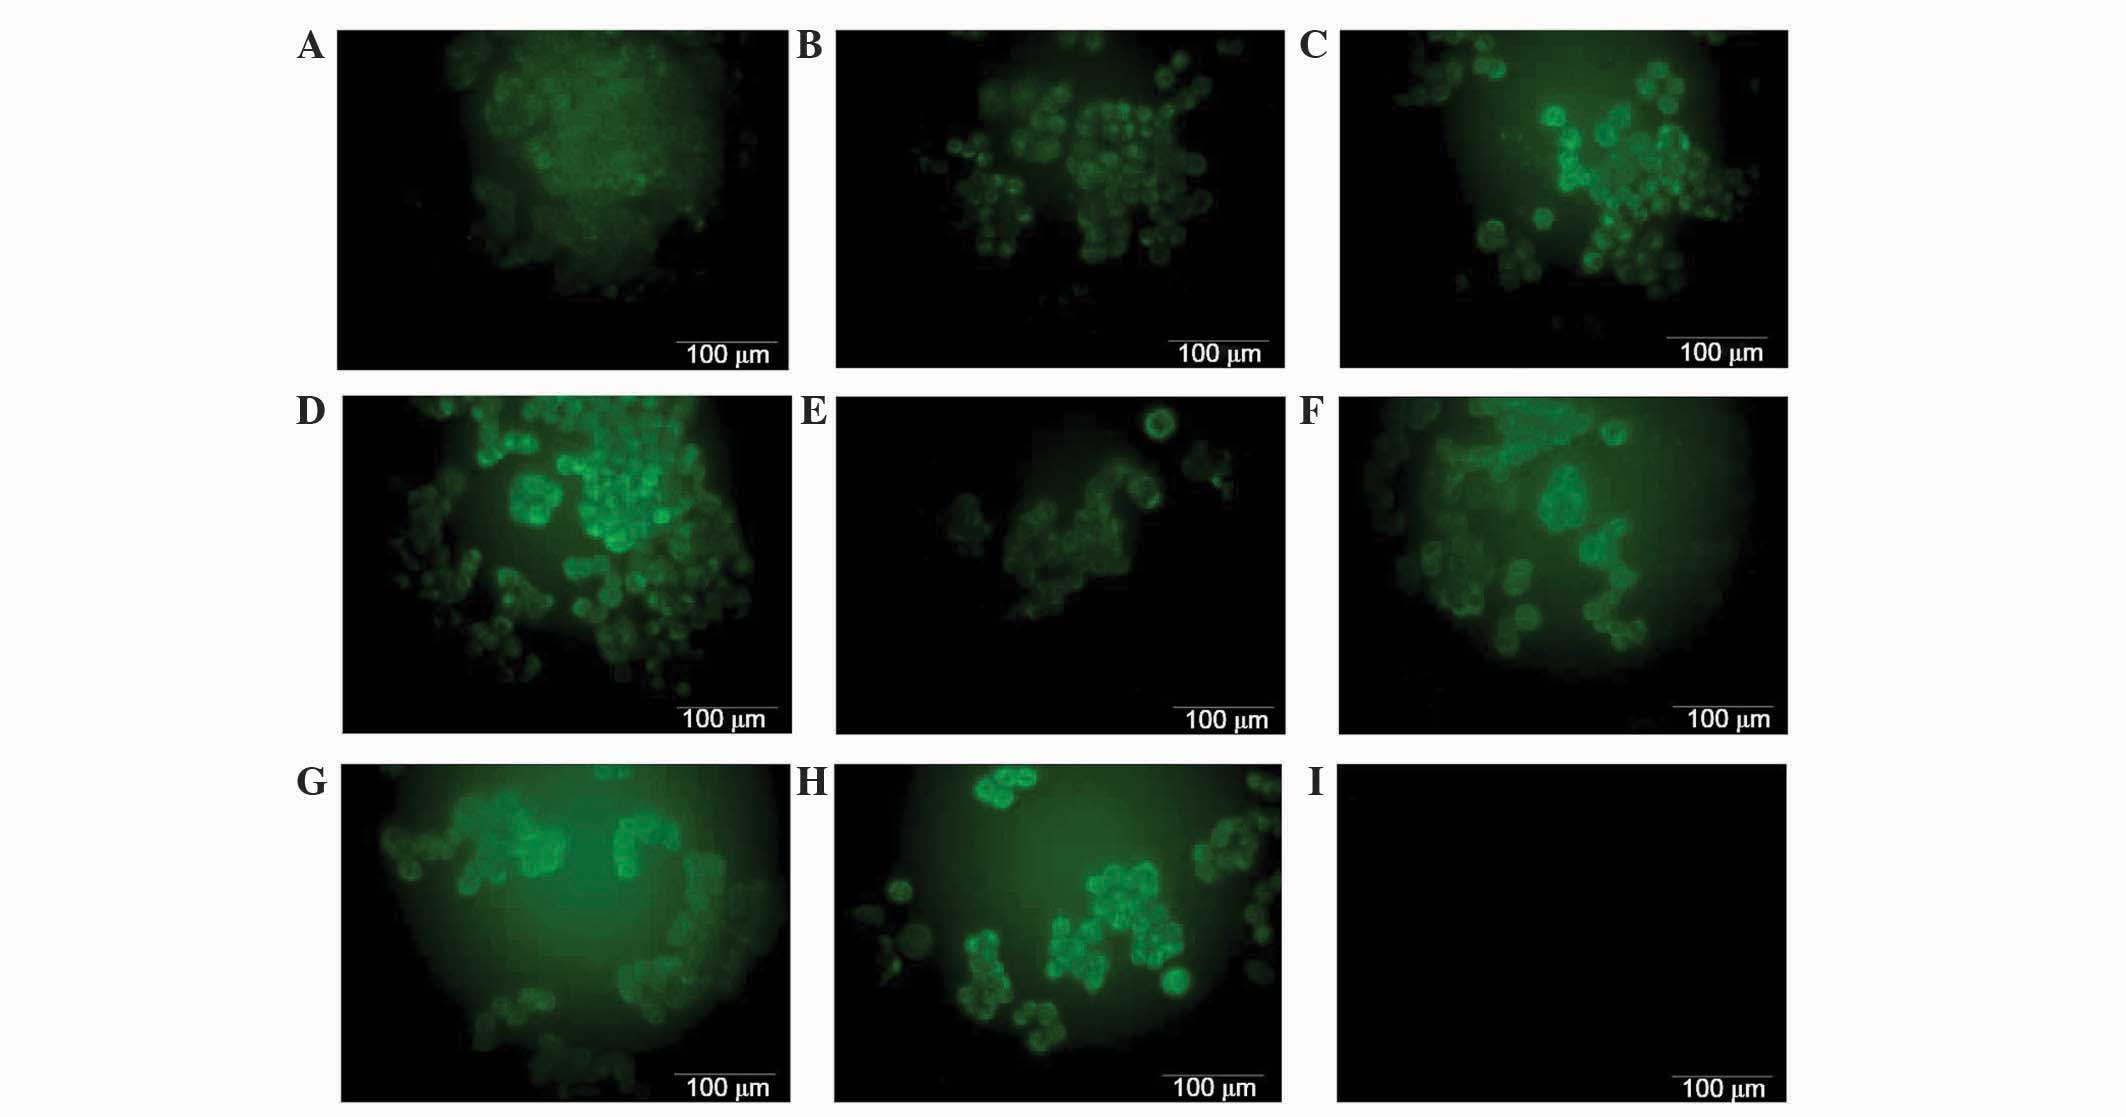
Ovarian cancer A2780 cell line
expresses the membrane-bound complement regulatory protein
CD55
To investigate the membrane-bound form of complement
inhibitors CD55 and CD59, A2780 cells were visualized using
immunofluorescence. Immunofluorescence was performed using mouse
monoclonal anti-CD59 and anti-CD55 primary antibodies, and donkey
anti-mouse IgG Alexa Fluor® 488 conjugated secondary
antibody (green fluorescence). As expected, the expression of CD55
was observed on the surface of the cells (Fig. 4). However, no differences in
fluorescence were observed between cells in cells incubated with
IL-6 or IL-6/IL-8 combination compared with control cells (Fig. 4). CD59 was not detected on the cancer
cells surface, possibly due to its expression being too low to be
detected (data not shown).
A2780 cells do not produce a soluble
form of CD55 or CD59 to a significant level
A2780 cell culture was stimulated with various
concentrations (1, 10, 100 ng/ml) of IL-6 alone and IL-6/IL-8
combination. Following 24 h, soluble forms of CD55 and CD59 were
analyzed in the cell culture supernatants with the use of an ELISA
method. The two ELISA tests had a detection range of 31.2–2,000.0
pg/ml. The minimum detectable dose of human CD59 and CD55
glycoprotein is typically <10.7 pg/ml. However in the present
study, no CD59 and CD55 glycoproteins were detected (data not
shown). It is possible that the concentration of the glycoprotein
in the cell culture supernatants was too low to be detected, or
that ovarian cancer cells do not release CD55 and CD59 into the
microenvironment.
Discussion
The complement system is an important part of innate
immunity. CD59 and CD55 are cell surface-anchored proteins that
regulate the activation of complement (3). Cancer cells may protect themselves
against complement-dependent cytotoxicity by the expression of
complement system inhibitors. The present study investigated the
role of IL-6 and IL-8 on CD55 and CD59 expression in the human
ovarian cancer A2780 cell line. The present results revealed that
IL-6 affects the expression of CD59 at a protein level; these
effects were also detected at the mRNA level of CD59. Relative
expression of CD59 was the highest in cells incubated with IL-6 at
a concentration of 100 ng/ml compared with control cells, and these
results were statistically significant. However, western blot
analysis did not confirm this result; analysis at the protein level
revealed that IL-6 had a positive affect on the CD59 protein
expression, but only on samples incubated with 1 and 10 ng/ml IL-6,
since the level of CD59 in cell lysates was decreased compared with
control cells when incubated with 100 ng/ml IL-6. The current study
only presents representative results from western blotting.
Furthermore under the same experimental conditions, CD59 was not
detected on the surface of the cells by immunofluorescence; the
fluorescence signal from the CD59 was too weak and was not
detectable. Similarly, with regards to the soluble form of CD59,
the amount of inhibitor in the culture medium was below the
detection limit of the ELISA test used by the present study.
Consequently, the present authors hypothesize the existence of
other mechanisms that may regulate the expression of CD59 at the
post-transcriptional stage. By contrast, expression of CD55
remained relatively unchanged at the mRNA and protein level;
however, CD55 was not detected during western blotting and ELISA
analysis, only with immunofluorescence and qPCR.
Several studies have addressed the expression of
complement system inhibitors in numerous tumors. However, to the
best of our knowledge, the role of IL-6 and IL-8 on CD55 and CD59
expression in ovarian cancer cells has not yet been characterized
and investigated. Shang et al (7) demonstrated that the expression levels of
CD46, CD55 and CD59 were significantly higher in colon cancer
tissues compared with normal colon tissues. However, this was
independent of the presence of IL-6 and IL-8. Additionally, Wang
et al (14) demonstrated that
IL-6 and IL-8 may promote cell proliferation in ovarian carcinoma
CAOV-3 and OVCAR-3 cells in a time- and dose-dependent manner, and
this cell proliferation, induced by IL-6 and IL-8, was suppressed
by the use of specific antibodies. However, no significant
difference was observed in the proliferation rate of A2780 cells
following stimulation by IL-6 and IL-8 in the present study. The
results differed to those of our study were likely caused by the
use of different cell lines and different incubation times. In the
study by Wang et al (14)
ovarian cancer cell lines CAOV-3 and OVCAR-3 were incubated with
IL-6 and/or IL-8 for 24 h, 48 h, 72 h, 96 h and 120 h, and for 48
h, 96 h and 144 h in CAOV-3 and OVCAR-3 cells, respectively. In the
present study the A2780 cancer cells were incubated for 96h only.
The concentrations of IL-6 and IL-8 were similar in both studies.
The largest effect in Wang et al (14) study was observed after 120 h
incubation with IL-6, IL-8 or both. Additionally, the cell lines
used were different in origin, genetic profile and clinical stage,
so the influence of IL-6 and IL-8 may be different (15).
Overall, based on the present results, it may be
concluded that human ovarian cancer A2780 cells express factors
CD55 and CD59, but do not secrete this protein into the tumor
microenvironment. The expression of these factors at the protein
level appears to be independent on IL-6 and IL-8. However, the
mechanism that regulates this process should be investigated
further.
Acknowledgements
The present study was supported by the National
Science Centre, based on the decision no. DEC––2011/01/D/NZ7/04688.
University of Information Technology and Management, Rzeszow,
Poland.
References
|
1
|
Fishelson Z, Donin N, Zell S, Schultz S
and Kirschfink M: Obstacles to cancer immunotherapy: Expression of
membrane complement regulatory proteins (mCRPs) in tumors. Mol
Immunol. 40:109–123. 2003. View Article : Google Scholar : PubMed/NCBI
|
|
2
|
Alegretti AP, Mucenic T, Tavares Brenol JC
and Xavier RM: The role of CD55/CD59 complement regulatory proteins
on peripheral blood cells of systemic lupus erythematosus patients.
Rev Bras Rheumatol. 49:276–287. 2009.
|
|
3
|
Li J, Gao MH and Zhang B: Inhibition of
mutant CD59 protein on proliferation of ovarian cancer A2780 cells.
Ai Zheng. 28:379–383. 2009.(In Chinese). PubMed/NCBI
|
|
4
|
Bjørge L, Hakulinen J, Vintermyr OK, Jarva
H, Jensen TS, Iversen OE and Meri S: Ascitic complement system in
ovarian cancer. Br J Cancer. 92:895–905. 2005. View Article : Google Scholar : PubMed/NCBI
|
|
5
|
Dzietczenia J, Wróbel T, Mazur G, Poręba
R, Jaźwiec B and Kuliczkowski K: Expression of complement
regulatory proteins: CD46, CD55, and CD59 and response to rituximab
in patients with CD20 (+)non-Hodgkin's lymphoma. Med Oncol.
27:743–746. 2010. View Article : Google Scholar : PubMed/NCBI
|
|
6
|
Liu M, Yang YJ, Zheng H, Zhong XR, Wang Y,
Wang Z, Wang YG and Wang YP: Membrane-bound complement regulatory
proteins are prognostic factors of operable breast cancer treated
with adjuvant trastuzumab: A retrospective study. Oncol Rep.
32:2619–2627. 2014.PubMed/NCBI
|
|
7
|
Shang Y, Chai N, Gu Y, Ding L, Yang Y,
Zhou J, Ren G, Hao X, Fan D, Wu K and Nie Y: Systematic
immunohistochemical analysis of the expression of CD46, CD55 and
CD59 in colon cancer. Arch Pathol Lab Med. 138:910–919. 2014.
View Article : Google Scholar : PubMed/NCBI
|
|
8
|
Davidson B and Tropé CG: Ovarian cancer:
Diagnostic, biological and prognostic aspects. Womens Health.
10:519–533. 2014.
|
|
9
|
Wcisło G and Szczylik C: Preface. Ovarian
Cancer: Pathobiology, Diagnosis and an Overview of Contemporary
Methods of Treatment. Wcisło G and Szczylik C: (1st). Termedia.
(Poznań). 92011.
|
|
10
|
Kulbe H, Chakravarty P, Leinster DA,
Charles KA, Kwong J, Thompson RG, Coward JI, Schioppa T Robinson,
et al: A dynamic inflammatory cytokine network in the human ovarian
cancer microenvironment. Cancer Res. 72:66–75. 2012. View Article : Google Scholar : PubMed/NCBI
|
|
11
|
Thibault B, Castells M, Delord JP and
Couderc B: Ovarian cancer microenvironment: Implications for cancer
dissemination and chemoresistance acquisition. Cancer Metastasis
Rev. 33:17–39. 2014. View Article : Google Scholar : PubMed/NCBI
|
|
12
|
Asschert JG, Vellenga E, Ruiters MH and de
Vries EG: Regulation of spontaneous and TNF/INF-induced IL-6
expression in two human ovarian-carcinoma cell lines. Int J Cancer.
82:244–249. 1999. View Article : Google Scholar : PubMed/NCBI
|
|
13
|
Livak KJ and Schmittgen TD: Analysis of
relative gene expression data using real-time quantitative PCR and
2(−Delta Delta C(T)) method. Methods. 25:402–408. 2001. View Article : Google Scholar : PubMed/NCBI
|
|
14
|
Wang Y, Yang J, Gao Y, Du Y, Bao L, Niu W
and Yao Z: Regulatory effect of E2, IL-6 and IL-8 on the growth of
epithelial ovarian cancer cells. Cell Mol Immunol. 2:365–372.
2005.PubMed/NCBI
|
|
15
|
Beaufort CM, Helmijr JC, Piskorz AM, et
al: Ovarian cancer cell line panel (OCCP): Clinical importance of
in vitro morphological subset. PLoS One. 9:e1039882014.
View Article : Google Scholar : PubMed/NCBI
|