Introduction
It has been ~70 years since chemotherapy was
introduced into clinical practice to treat malignant tumors
(1). A variety of chemotherapeutic
agents have been developed to interfere with the metabolism of
cancer cells, including osteosarcoma, colon carcinoma, liver
carcinoma and breast carcinoma cells, and a clinician may improve
therapeutic outcomes by dose escalation, alterations in the
combination of chemotherapy and the addition of irradiation therapy
(1,2).
However, the overall survival rate of osteosarcoma, colon
carcinoma, liver carcinoma and breast carcinoma patients has not
improved with the chemotherapeutic agents as much as expected
(1,2).
Intrinsic and acquired resistance to chemotherapeutic agents is the
major obstacle for successful chemotherapy (2). Clinical practice has revealed that the
profile of intrinsic gene expression varies greatly in patients
that respond poorly to chemotherapy (3). Several genes, including multi-drug
resistant protein 1 (4), cluster of
differentiation 117 and ATP binding cassette subfamily G member 2
(5), have been identified as drug
resistance genes in human osteosarcoma; however, there is no
consensus regarding biomarkers for the detection of cancer
resistance to a certain chemotherapy.
Two dimensional gel electrophoresis (2-D PAGE) is a
powerful method for analyzing complex protein samples, and previous
studies have successfully employed 2-D PAGE for the identification
of chemoresistance-associated genes (6). In the present study, an
adriamycin-resistant human osteosarcoma MG-63 sub-line was
established, and adriamycin resistance-associated proteins were
identified by comparing the adriamycin-resistance sub-line with its
parental cell line, with the aid of 2-DE and matrix-assisted laser
desorption ionization time-of-flight mass spectrometry
(MALI-TOF-MS). Out of all the genes that were aberrantly expressed
in the resistant sub-line, prohibitin (PHB) was demonstrated to be
capable of interacting with multiple oncogenes and tumor suppressor
genes. This suggests that it has the potential to be a biomarker
for chemotherapy resistance.
Materials and methods
Cell cultures
Human osteosarcoma cell line MG-63 was obtained from
the American Type Culture Collection (Manassas, VA, USA). The cells
were routinely maintained in complete growth medium [RPMI-1640
(Gibco; Thermo Fisher Scientific, Inc., Waltham, MA, USA)
supplemented with 10% fetal bovine serum (Gibco; Thermo Fisher
Scientific, Inc.)] at 37°C in a humidified 5% CO2
incubator. Unless specified, all reagents and materials for cell
culture were from Gibco (Thermo Fisher Scientific, Inc.) or Corning
Incorporated (Corning, NY, USA).
Establishment of adriamycin resistant
MG-63 sub-line
MG-63 cells were routinely maintained in complete
growth medium. The method for establishing drug resistant cell
lines was performed as previously reported (7). Briefly, the resistant MG-63 cells were
established by exposure to increasing concentrations of adriamycin,
starting from 4 ng/ml with a 25% increase each time. Subsequent to
6 months of continuous cultivation, the subcultures that capable of
growing exponentially in the presence of the highest concentration
of adriamycin (44 ng/ml) were designated as the
adriamycin-resistant sub-line (MG-63/ADR).
2-D-polyacrylamide gel electrophoresis
(PAGE), MALDI-TOF-MS analysis and protein identification
2-D-PAGE was conducted as previously described
(8). Briefly, the protein samples
from the adriamycin-resistant sub-lines and parental MG-63 cells
were diluted in sample buffer with 2% IPG buffer (pH 3–10; GE
Heathcare Life Sciences, Chalfont, UK). The samples were applied to
18-cm, immobilized pH gradient strips (Immobiline Drystrip pH 3–10;
GE Healthcare Life Sciences). Upon completion of isoelectric
focusing, the strips were equilibrated and the second dimensional
electrophoresis was examined overnight at 3 W/gel at 20°C.
Triplicate sets of silver-stained gels were scanned using a UMAX
POWER LOOK III flat-bed scanner (UMAX Technologies, Dallas, TX,
USA) and analyzed with the PDQuest 2-D Analysis software, version
8.0 (Bio-Rad Laboratories, Inc., Hercules, CA, USA). The
digitalized 2-DE gel images were compared using an electronic
alignment method PDQuest 2-D analysis software version 8.0; Bio-Rad
Laboratories, Inc.) (6).
Differentially expressed spots were analyzed and annotated.
The spots were cut into pieces and digested with
12.5 ng/µl trypsin (Promega Corporation, Madison, WI, USA) in 50 mM
ammonium bicarbonate (pH 8.0; Sigma-Aldrich, St. Louis, MO, USA).
Following elution with 2 µl matrix solution consisting of 10 mg/ml
α-cyano-3-hydroxy-cinnamic acid (Sigma-Aldrich), the remaining
liquid was submitted to a mass spectrometer (MALDI-TOF III; Bruker
Corporation, Billerica, MA, USA). The spectra were internally
calibrated using the trypsin autolysis products as controls [842.51
m/z (M+H) and 2,211.11 m/z (M+H)] by flexImaging software version
2.0 (Bruker Corporation) and blasted against Swiss-Prot (www.uniprot.org/) and National Center for
Biotechnology Information BLAST (blast.ncbi.nlm.nih.gov/Blast.cgi) databases using the
Proteomics Mascot software version 2.0, which was purchased from
Matrix Science, Inc. (Boston, MA, USA). All searches were analyzed
with a 50 ppm mass tolerance.
Western blot analysis
For immunoblot analysis, the MG-63/ADR and parental
MG-63 cells were washed with phosphate-buffered saline, and
subsequently lysed with radioimmunoprecipitation buffer (Tiangen
Biotech Co., Ltd., Beijing, China). Following centrifugation at
12,000 × g for 15 min at 4°C, the supernatant was separated on a
10% sodium dodecyl sulfate-PAGE gel (Tiangen Biotech Co., Ltd.) and
transblotted onto a polyvinylidene difluoride membrane
(Sigma-Aldrich). Following blocking with 5% bovine serum albumin
(BSA; Sigma-Aldrich) in Tris-buffered saline and Tween 20, the
membrane was incubated with mouse anti-human PHB monoclonal
antibody (catalogue no. sc-377037; 1:3,000; Santa Cruz
Biotechnology, Inc., Dallas, TX, USA) at 4°C overnight, and then
with goat anti-mouse immunoglobulin (Ig) G polyclonal antibody
(catalogue no. sc-395763; 1:2,000; Santa Cruz Biotechnology, Inc.)
at 37°C for 2 h. Specific bands were visualized using
Odyssey® CLx Imaging System (LI-COR Biotechnology,
Lincoln, NE, USA). β-actin was used as an indicator for quality of
protein loading.
Reverse transcription-quantitative
polymerase chain reaction (RT-qPCR) analysis of adriamycin
resistance-associated genes
The RNA from MG-63/ADR and parental MG-63 cells was
isolated using TRIzol® Reagent (catalog no., D9108A;
Takara Bio, Inc., Otsu, Japan), according to the manufacturer's
protocol. cDNA samples were prepared using a 1st Strand cDNA
Synthesis kit (catalog no., D6110S; Takara Bio, Inc.), according to
the manufacturer's protocol. The primer pairs for qPCR were as
follows: β-actin, forward 5′-ACATCTGCTGGAAGGTGGAC-3′ and reverse
5′-CTGTGGCATCCACGAAACTA-3′; and PHB, forward
5′-CGGAGAGGACTATGATGAG-3′ and reverse 5′-GGTCAGATGTGTCAAGGA-3′
(Sangon Biotech Co., Ltd., Shanghai, China). qPCR was performed
using SYBR® Premix Ex Taq™ II kit (catalog no., RR820A;
Takara, Bio, Inc.) in ABI PRISM® 7900HT Sequence
Detection System (Applied Biosystems®; Thermo Fisher
Scientific, Inc.). Hot-start PCR was performed as follows: 30 sec
at 95°C; 45 cycles, with 1 cycle of 5 sec at 95°C and 44 cycles of
30 sec at 60°C. All samples were read in triplicate, and values
were normalized to β-actin expression. The relative expression data
were calculated according to the 2−ΔCq method and
presented as fold-change (7).
Laser-scanning confocal
microscope
The cells were seeded on cover slips overnight prior
to the following experiment. Subsequent to fixation with 3%
paraformaldehyde (Sigma-Aldrich) in PBS (pH 7.4) for 10 min at room
temperature, the cover slips were washed in ice-cold PBS three
times. Subsequently, the cover slips were immersed in PBS
containing 0.25% Triton X-100 for 10 min to permeabilize cell
membranes. Following washing in PBS three times for 5 min for each
wash, the cells were incubated with 1% BSA in PBS and 0.05% Tween
20 (PBST) for 30 min at room temperature to block the unspecific
binding of the antibodies. Subsequently, the cells were incubated
in the mixture of two primary antibodies [mouse anti-human PHB
(monoclonal antibody; catalogue no. sc-377037; 1:2,000; Santa Cruz
Biotechnology, Inc.)/rabbit anti-human FBJ murine osteosarcoma
viral oncogene homolog (c-fos; polyclonal antibody; catalogue no.
sc-52; 1:2,000; Santa Cruz Biotechnology, Inc.); mouse anti-human
PHB (monoclonal antibody; catalogue no. sc-377037; 1:2,000; Santa
Cruz Biotechnology, Inc.)/rabbit anti-human v-myc avian
myelocytomatosis viral oncogene homolog (c-myc; polyclonal
antibody; catalogue no. sc-788; 1:2,000; Santa Cruz Biotechnology,
Inc.); mouse anti-human PHB (monoclonal antibody; catalogue no.
sc-377037; 1:2,000; Santa Cruz Biotechnology, Inc.)/rabbit
anti-human tumor protein p53 (polyclonal antibody; catalogue no.
sc-6243; 1:2,000; Santa Cruz Biotechnology, Inc.); and mouse
anti-human PHB (monoclonal antibody; catalogue no. sc-377037;
1:2,000; Santa Cruz Biotechnology, Inc.)/rabbit anti-human
retinoblastoma 1 (Rb; monoclonal antibody; catalogue no. sc-1538;
1:2,000; Santa Cruz Biotechnology, Inc.)] in 1% BSA in PBST in a
humidified chamber for 1 h at room temperature. Following washing 3
times in PBS for 5 min, the cells were incubated with the mixture
of two secondary antibodies [cyanine dye
(Cy®3)-conjugated goat anti-mouse IgG (polyclonal
antibody; catalogue no. 115-165-164; 1:2,000; Jackson
ImmunoResearch Laboratories, Inc., West Grove, PA,
USA)/Cy3-conjugated goat anti-rabbit IgG (polyclonal antibody;
catalogue no. 111-165-003; 1:2,000; Jackson ImmunoResearch
Laboratories, Inc.)] in 1% BSA for 1 h at room temperature in dark.
The cells were washed in PBS for 5 min in the dark. For counter
staining, the cells were incubated in DAPI (Sigma-Aldrich) for 5
min at 37°C. Following rinsing in PBS, the cells were mounted with
a drop of mounting medium (Gibco; Thermo Fisher Scientific, Inc.)
and sealed with nail polish to prevent movement under the
microscope. Image acquisition was performed by laser confocal
scanning microscopy (TCS-SP2 MP; Leica Microsystems, Inc., Buffalo
Grove, IL, USA).
Overexpression of PHB in MG-63/ADR
sub-line
The full length of open reading frame of human PHB
was subcloned into lentiviral vector pLVX-puro (Invitrogen; Thermo
Fisher Scientific, Inc.). The lentivirus was subsequently generated
by cotransfection of human embryonic kidney 293T cells with the
recombinant lentiviral expression vector and Lenti-X™ Packaging
System from Clontech Laboratories, Inc. (Mountainview, CA, USA).
For probing the effects of PHB on cell growth, the resistant
MG-63/ADR sub-line was transduced with lentivirus bearing PHB
(Invitrogen; Thermo Fisher Scientific, Inc.), and a stable clone
were screened by limiting dilution under the selective pressure of
puromycin (2.5 µg/ml; Sigma-Aldrich). Cell growth curve analysis
was performed as described previously (9).
3-(4,5-dimethylthiazol-2-yl)-2,5-diphenyltetrazolium bromide (MTT)
assay
Cells were cultured in 96-well tissue culture
plates. At 24 and 48 h after transfection, MTT (Sigma-Aldrich) was
added to each well to a final concentration of 5 mg/ml in culture
medium, and incubated at 37°C for 4 h. The reaction was terminated
by removal of the supernatant and addition of 150 µl dimethyl
sulfoxide (Sigma-Aldrich) to dissolve the formazan product. The
plates were read at 405 nm on an MK3 micro-ELISA plate reader
(Thermo Fisher Scientific, Inc.). Each assay was performed in
duplicates of 10 wells.
Statistical analysis
SPSS 19.0 software (IBM SPSS, Armonk, NY, USA) was
used to perform statistical analysis. Data are represented as the
mean, median, minimum and maximum values. Student's t test was used
to analyze the data. P<0.05 was considered to indicate a
statistically significant difference.
Results
Proteomic analysis of MG-63 cells pre-
and post-chemoresistance
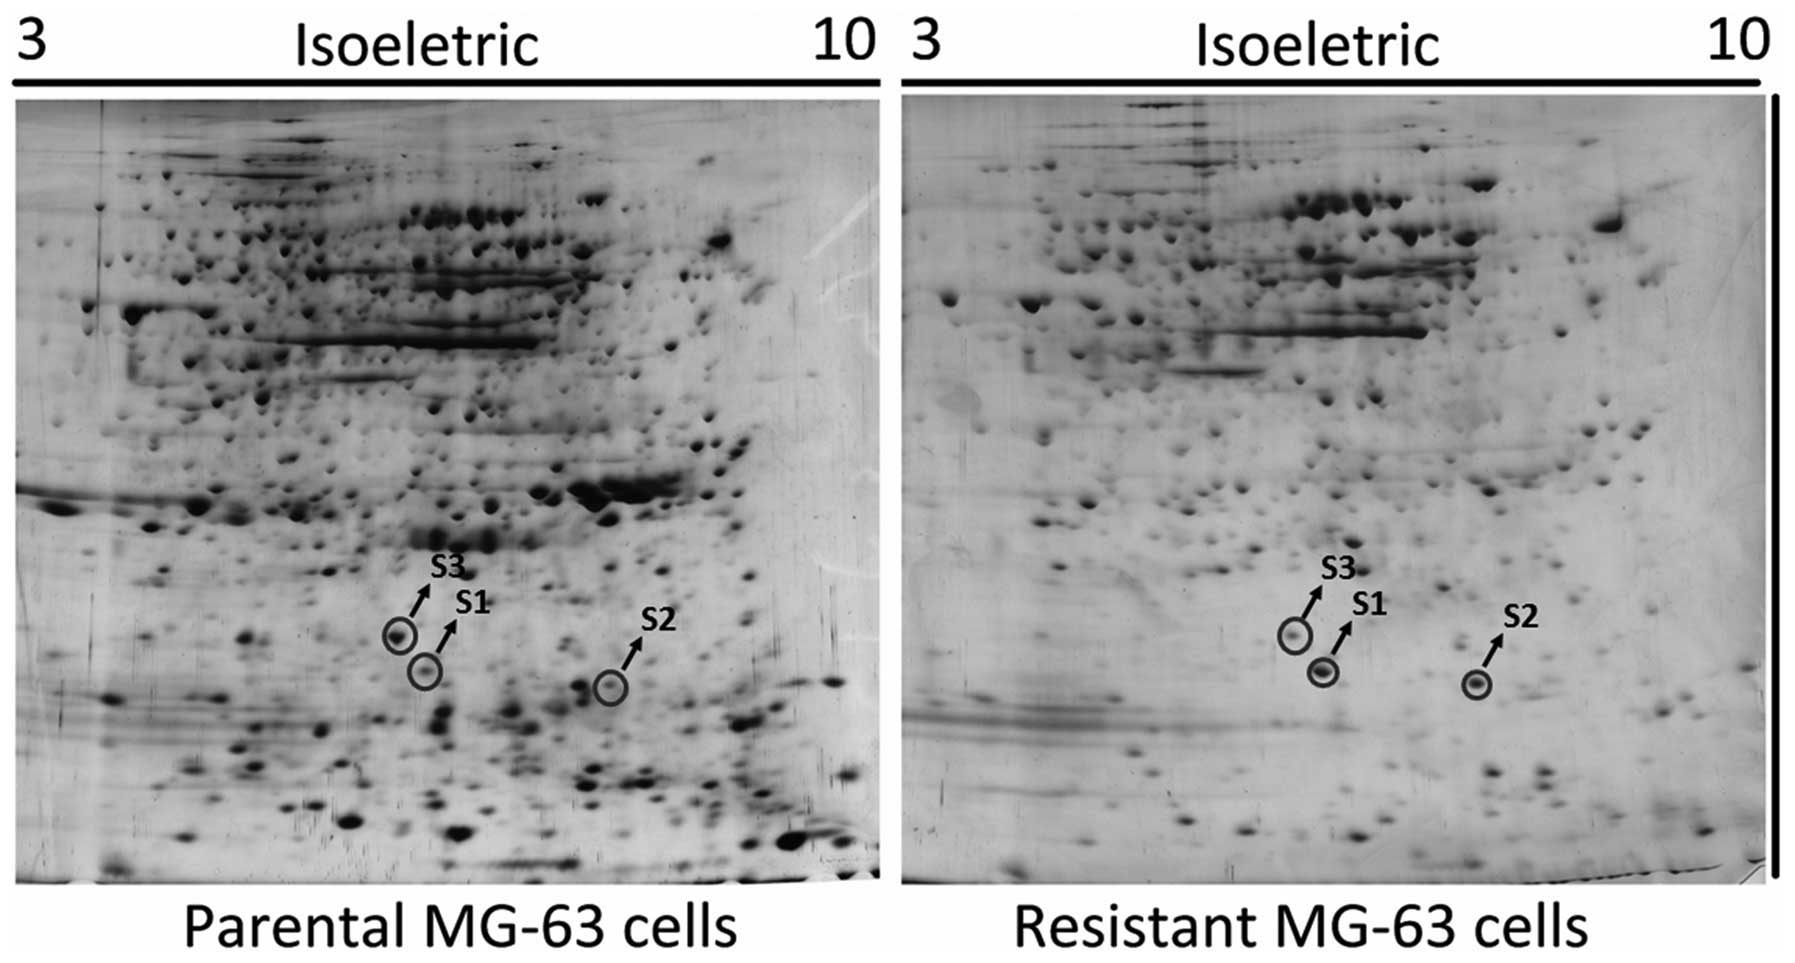
The whole cell lysates from MG-63 and MG-63/ADR
cells were separated using 2-DE, and the gel was visualized by
silver-staining. The procedure was independently repeated 3 times
and a representative gel image is shown in Fig. 1. The number of protein spots in the
MG-63/ADR sub-line markedly decreased when compared with the
parental MG-63 cells. The spots differentiated by intensity were
excised and digested with trypsin, and were subsequently identified
by mass spectrometry. The identified proteins are listed in
Table I.
 | Table I.Differentially expressed proteins in
adriamycin-resistant human osteosarcoma MG-63 and parental MG-63
cells. |
Table I.
Differentially expressed proteins in
adriamycin-resistant human osteosarcoma MG-63 and parental MG-63
cells.
| Spot no. | Protein | NCBI ID | Theoretical
isoelectric point, pI | Theoretical Mw,
kDa | Expression
intensity |
|---|
| S1 | HMGB1 | GI:48145843 | 8.20 | 25.4 | High |
| S2 | RhoA | GI:6706217 | 5.73 | 24.9 | High |
| S3 | Prohibitin | GI:246483 | 5.76 | 29.8 | Low |
Analysis of aberrant expression of PHB
by qPCR and western blot analysis
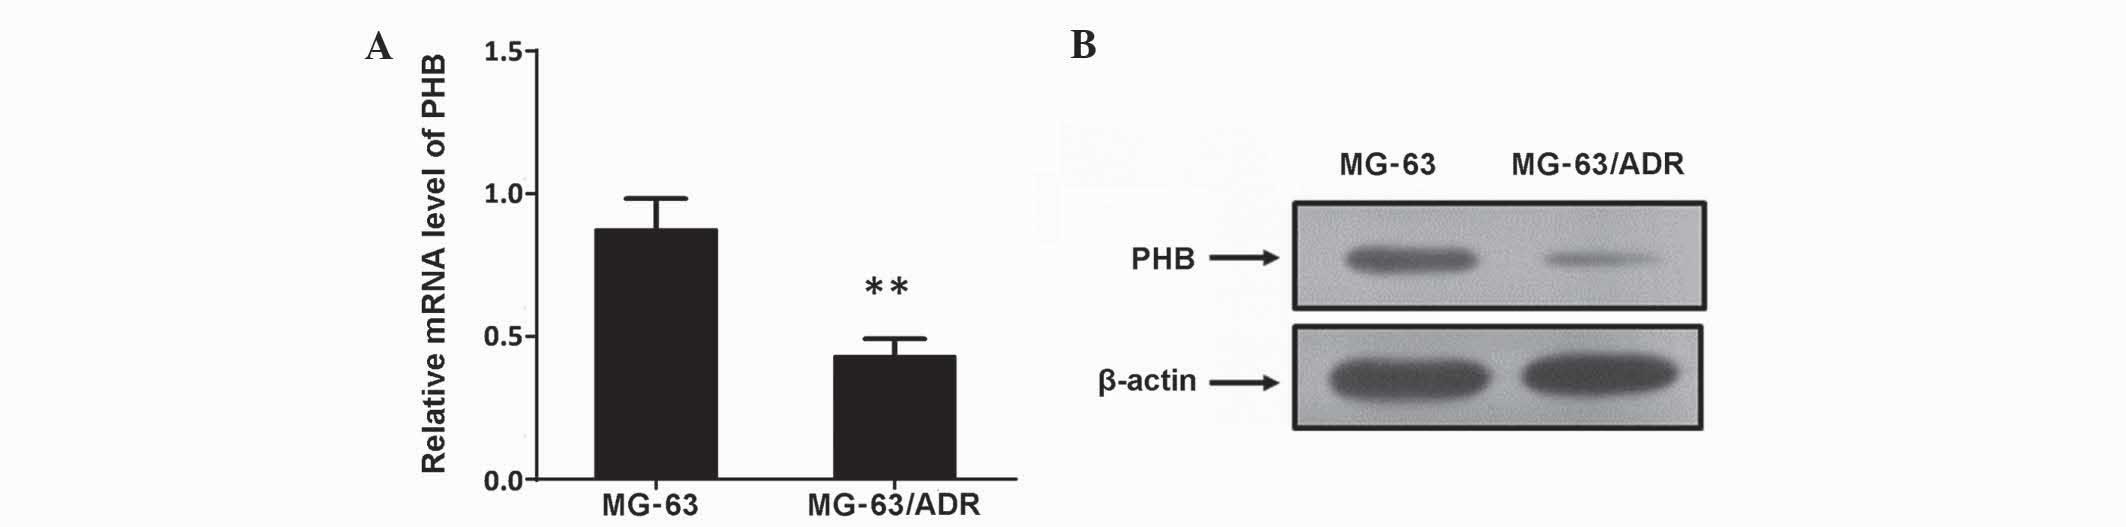
To additionally verify the aberrant alterations
identified by 2D-PAGE, western immunoblotting and RT-qPCR were
employed to confirm expression levels. The results showed that PHB
in MG-63/ADR cells was much lower compared with parental MG-63
cells, suggesting the expression of PHB in the MG-63/ADR cells was
significantly inhibited (Fig. 2;
P<0.01). These results were consistent with the 2-DE
analysis.
Colocalization of PHB with c-myc,
c-fos, p53 and Rb staining
The MG-63 and MG-63/ADR cells were immunostained
with primary antibodies for PHB, c-myc, c-fos, p53 and Rb. The
anti-PHB antibody and other antibodies were labeled with red
fluorescence Cy3. Laser confocal scanning microscopy was used to
observe the alteration of colocalization of PHB with other
proteins. The colocalized region was yellow or orange.
Colocalization of PHB with c-myc
The green fluorescence representing PHB was
distributed throughout the MG-63 cells. The fluorescent density in
the nucleus was clearer compared with the cytoplasm. The red
fluorescence representing c-myc was markedly distributed in the
nucleus and the density was not uniform. In images where the red
and green fluorescence has been merged together, PHB was observed
to be colocalized with c-myc in the nucleoplasm region,
particularly in the nucleolus region (Fig. 3A). However, in the MG-63/ADR cells,
the PHB expression was primarily distributed in nucleus, and the
red fluorescence of c-myc was decreased and uniformly distributed
in the nucleus. The merged images demonstrated that the
colocalization of PHB with c-myc in the cytoplasm was not clear,
suggesting the colocalized region of PHB with c-myc was not in the
cytoplasm (Fig. 3A).
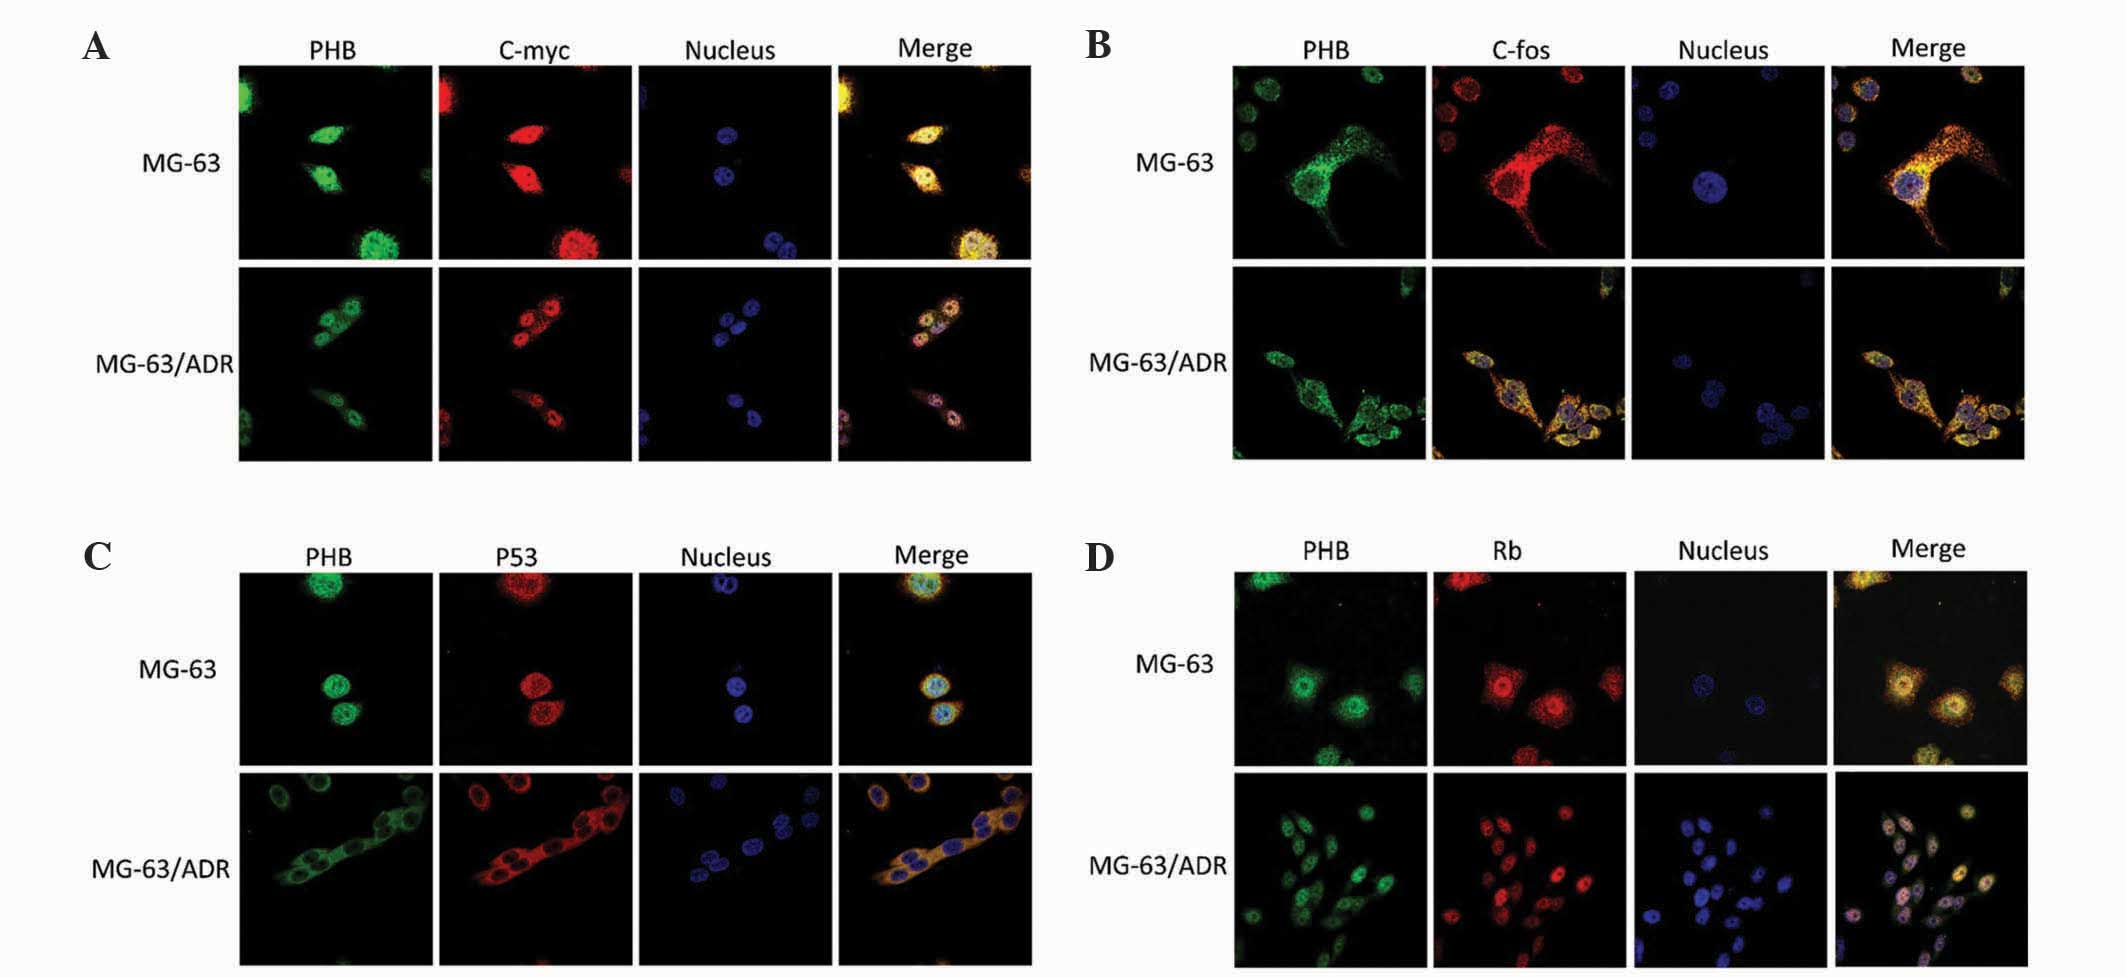 | Figure 3.Colocalization of PHB with c-myc,
c-fos, p53 and Rb in human osteosarcoma MG-63 and MG-63/ADR cells.
Colocalization of PHB with (A) c-myc, (B) c-fos, (C) p53 and (D)
Rb. MG-63/ADR, human osteosarcoma adriamycin-resistant cells; PHB,
prohibitin; c-myc, v-myc avian myelocytomatosis viral oncogene
homolog; c-fos, FBJ murine osteosarcoma viral oncogene homolog;
p53, tumor protein p53; Rb, retinoblastoma 1. |
Colocalization of PHB with c-fos
In MG-63 parental cells, PHB and c-fos were
primarily expressed in the cytoplasm and nucleoplasm expression was
extremely weak. PHB and c-fos colocalized together in the
cytoplasm; however, the overall fluorescent intensity in MG-63/ADR
cells was much lower compared with parental MG-63 cells, indicating
that PHB and c-fos were downregulated when the MG-63 cells were
conferred with adriamycin resistance. Nevertheless, the
colocalization region was not altered pre- and post-chemoresistance
(Fig. 3B).
Colocalization of PHB with p53
Cytoplasmic p53 was dominant in parental MG-63
cells. The fluorescence intensity of PHB and p53 was relatively
weak in the nucleus. The expression of PHB and p53 was entirely
attenuated in MG-63/ADR cells, and the fluorescence in the nucleus
was almost completely depleted. However, the colocalization of PHB
with p53 was present in cells pre- and post-chemoresistance
(Fig. 3C).
Colocalization of PHB with Rb
The green fluorescence representing PHB was
distributed in the nucleus region of parental MG-63 cells. The
fluorescent density in the nucleolus was relatively clear, while
the fluorescence in the cytoplasm was much weaker. The red
fluorescence representing Rb was distributed throughout the whole
cell. The merged image indicated that PHB colocalized with Rb in
the nucleoplasm region, particularly in the nucleolus region
(Fig. 3D). Adriamycin treatment did
not affect the colocalization of PHB with Rb, but did attenuated
their expression levels.
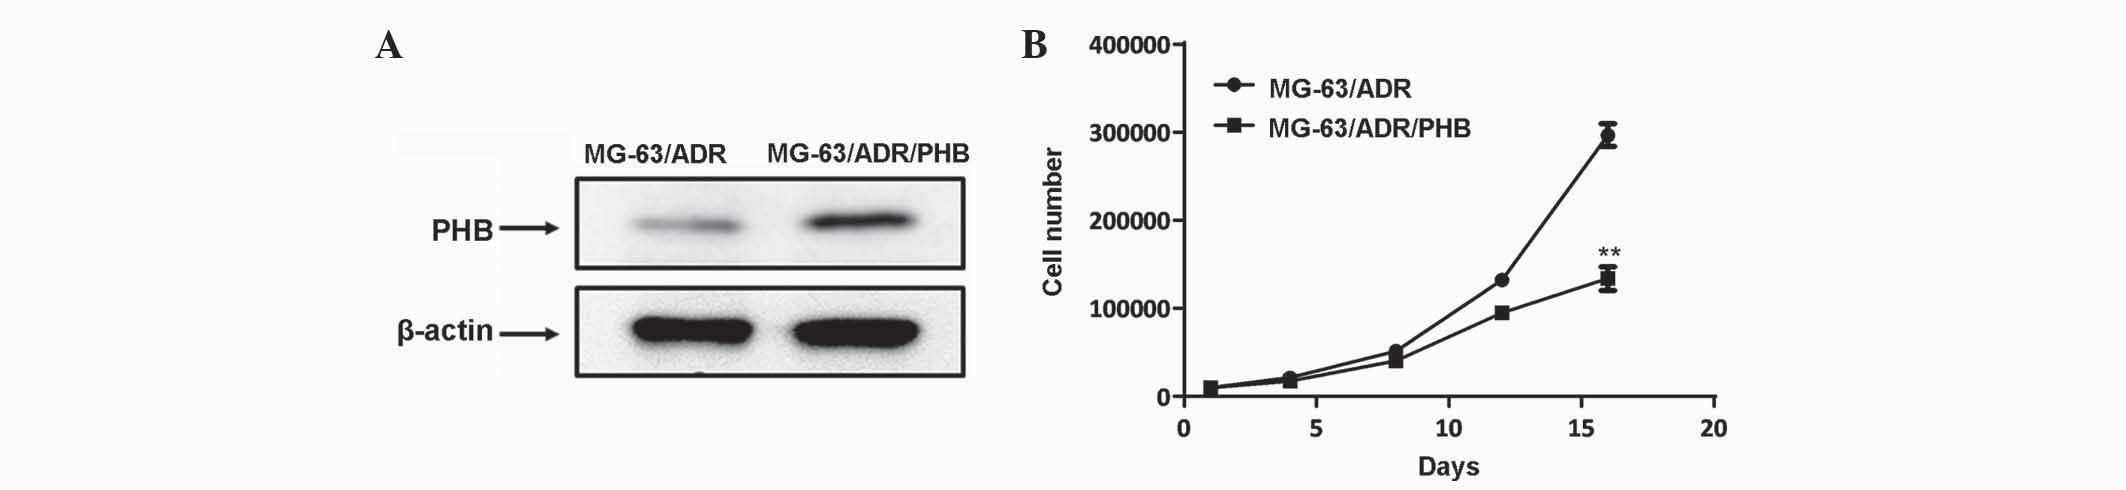
Overexpression of PHB in MG-63/ADR
cells
To additionally elucidate the function of PHB in
modulating the sensitivity of MG-63 cells to chemotherapeutic
drugs, the expression of PHB was artificially increased in the
MG-63/ADR cells using a lentiviral expression vector (Fig. 4A). The cell proliferation assay
revealed that overexpression of PHB decreased the proliferative
rate of MG-63/ADR cells (Fig. 4B;
P<0.01), indicating its pivotal role in mediating
chemoresistance in human osteosarcoma cells.
Discussion
Chemotherapy has prolonged the life span of patients
with localized osteosarcoma (10,11).
However, almost one third of patients with localized osteosarcoma
suffer from recurrence or progressive disease due to the
development of drug resistance (10,11). The
present study developed an adriamycin-resistant MG-63 sub-line, and
employed the 2-DE method to identify differentially expressed genes
in the resistant sub-line compared with the parental MG-63 cells.
All these differentially expressed genes are directly associated
with chemoresistance, and one of these, PHB, is involved in the
evolution of osteosarcoma resistance to adriamycin.
RhoA is a member of the Ras superfamily, which
regulates cytoskeletal dynamics; therefore participating in
multiple cellular activities, including cell motility and polarity
(12). The Rho subfamily includes
three isoforms RhoA, RhoB and RhoC, which share 84% homology in
sequence differing near the C terminus (13). When overexpressed, RhoA, RhoB and RhoC
induce stress fibers and induce terminal morphological alterations
during apoptosis (14). However,
several studies have indicated that the three isoforms have
distinct functions. RhoA is localized to the plasma membrane, while
RhoB is directed to endosomal membranes, due to its unique
C-terminal lipid modifications, and manipulates the endosomal
trafficking of membrane receptors (15). Furthermore, RhoA inhibits cancer cell
invasion in vitro, whereas RhoC often enhances cancer
metastasis (16). Depletion of RhoA
promotes cell invasion (17)and
constitutive overexpression in T cells induces the expression of
anti-apoptotic protein B-cell lymphoma-2, which protects cells from
apoptosis (18). By contrast,
knockdown of RhoA results in the apoptosis of T cells (19). The present data demonstrates that the
expression levels of RhoA were markedly increased in the MG-63/ADR
sub-line, which may have a role in overcoming cytotoxic
drug-induced apoptotic cell death.
High-mobility group box 1 (HMGB1) is a highly
conserved nuclear protein, which is a damage-associated molecule
that interacts with receptors for advanced glycation end products
and toll-like receptors (20–22). A number of studies have revealed its
pivotal role in mediating autophagy in cancer development and
therapy (23,24). Endogenous HMGB1 may negatively
regulate apoptosis of tumor cells, and manipulating HMGB1
expression may alter the sensitivity of cancer cells to
chemotherapeutic drugs (25,26). Various anticancer agents, including
doxorubicin, cisplatin and methotrexate, upregulate HMGB1
expression in human osteosarcoma cells, while suppression of its
expression using RNA interference-mediated knockdown restores the
chemosensitivity of osteosarcoma cells in vivo and in
vitro (27,28). The present data demonstrated that
HMGB1 levels were increased in the MG-63/ADR sub-line, which was
consistent with the results from another study (28), indicating it may serve as a candidate
gene for monitoring osteosarcoma chemoresistance.
PHB is known as a tumor suppressor and is
ubiquitously expressed in multiple tissues with antiproliferative
properties (29). It controls the
transition from G1 to S phase in cycling cells (29). High levels of PHB are commonly
observed in various human cancer solid tumor cell lines (30,31). In
the nucleus, PHB interacts with E2F transcription factor 1
(32), p53 and phosphorylated Rb
(33) to regulate the expression of
genes that are associated with cell proliferation and
differentiation. The present data demonstrated that the level of
PHB in the MG-63/ADR sub-line was decreased compared to parental
cells. In addition, the present data from laser confocal microscopy
revealed that PHB colocalized with c-myc, c-fos, p53 and Rb in the
parental MG-63 cells; however, the regions where colocalization was
observed was distinct from colocalization regions observed in the
MG-63/ADR sub-line. Furthermore, the fluorescence intensity
representing PHB staining was attenuated in the resistant sub-line
compared with the parental MG-63 cells. Overexpression of PHB in
the MG-63/ADR sub-line decreased the proliferative rate of cells in
the present study. Previously, it was observed that a deletion of
the PHB gene led to an 80% reduction of mitochondrial potential
(34), and subsequently triggered the
release of apoptogenic factors, indicating that PHB-regulated
mitochondria potential may also affect chemotherapeutic
effects.
Overall, the present study employed 2-DE and
MALDI-TOF-MS methods and identified notable genes that respond to
adriamycin resistance in human osteosarcoma cells. The functions of
these genes were associated with apoptotic signaling pathways. Of
all the identified genes, PHB was demonstrated to be a promising
target for novel therapeutic strategies, as it interacted with
c-myc, c-fos, p53 and Rb, and an overexpression of PHB modulated
the proliferative rate of adriamycin-resistant MG-63 cells.
However, additional study is required to elucidate how these
chemoresistance-associated genes interfere with the
adriamycin-activated pathway leading to adriamycin resistance in
human osteosarcoma.
Acknowledgements
The present study was supported by the National
Natural Science Foundation of China (Beijing, China; grant no.,
81360550).
References
|
1
|
Saleh EM, El-Awady RA and Anis N:
Predictive markers for the response to 5-fluorouracil therapy in
cancer cells: Constant-field gel electrophoresis as a tool for
prediction of response to 5-fluorouracil-based chemotherapy. Oncol
Lett. 5:321–327. 2013.PubMed/NCBI
|
|
2
|
Lewis IJ, Nooij MA, Whelan J, Sydes MR,
Grimer R, Hogendoorn PC, Memon MA, Weeden S, Uscinska BM, van
Glabbeke M, et al: Improvement in histologic response but not
survival in osteosarcoma patients treated with intensified
chemotherapy: A randomized phase III trial of the European
osteosarcoma intergroup. J Natl Cancer Inst. 99:112–128. 2007.
View Article : Google Scholar : PubMed/NCBI
|
|
3
|
Mintz MB, Sowers R, Brown KM, Hilmer SC,
Mazza B, Huvos AG, Meyers PA, Lafleur B, McDonough WS, Henry MM, et
al: An expression signature classifies chemotherapy-resistant
pediatric osteosarcoma. Cancer Res. 65:1748–1754. 2005. View Article : Google Scholar : PubMed/NCBI
|
|
4
|
Scotlandi K, Serra M, Nicoletti G, Vaccari
M, Manara MC, Nini G, Landuzzi L, Colacci A, Bacci G, Bertoni F, et
al: Multidrug resistance and malignancy in human osteosarcoma.
Cancer Res. 56:2434–2439. 1996.PubMed/NCBI
|
|
5
|
Adhikari AS, Agarwal N, Wood BM, Porretta
C, Ruiz B, Pochampally RR and Iwakuma T: CD117 and Stro-1 identify
osteosarcoma tumor-initiating cells associated with metastasis and
drug resistance. Cancer Res. 70:4602–4612. 2010. View Article : Google Scholar : PubMed/NCBI
|
|
6
|
Zhou J, Wei YH, Liao MY, Xiong Y, Li JL
and Cai HB: Identification of cisplatin-resistance associated genes
through proteomic analysis of human ovarian cancer cells and a
cisplatin-resistant subline. Asian Pac J Cancer Prev. 13:6435–6439.
2012. View Article : Google Scholar : PubMed/NCBI
|
|
7
|
Zhang X, Yashiro M, Qiu H, Nishii T,
Matsuzaki T and Hirakawa K: Establishment and characterization of
multidrug-resistant gastric cancer cell lines. Anticancer Res.
30:915–921. 2010.PubMed/NCBI
|
|
8
|
Görg A, Drews O, Lück C, Weikand F and
Weiss W: 2-DE with IPGs. Electrophoresis. 30(Suppl 1): S122–S132.
2009. View Article : Google Scholar : PubMed/NCBI
|
|
9
|
Dannenberg JH, David G, Zhong S, van der
Torre J, Wong WH and Depinho RA: mSin3A corepressor regulates
diverse transcriptional networks governing normal and neoplastic
growth and survival. Genes Dev. 19:1581–1595. 2005. View Article : Google Scholar : PubMed/NCBI
|
|
10
|
Chen Y, Yang Y, Yuan Z, Wang C and Shi Y:
Predicting chemosensitivity in osteosarcoma prior to chemotherapy:
An investigational study of biomarkers with immunohistochemistry.
Oncol Lett. 3:1011–1016. 2012.PubMed/NCBI
|
|
11
|
Goorin AM, Schwartzentruber DJ, Devidas M,
Gebhardt MC, Ayala AG, Harris MB, Helman LJ, Grier HE and Link MP:
Pediatric Oncology Group: Presurgical chemotherapy compared with
immediate surgery and adjuvant chemotherapy for nonmetastatic
osteosarcoma: Pediatric oncology group study POG-8651. J Clin
Oncol. 21:1574–1580. 2003. View Article : Google Scholar : PubMed/NCBI
|
|
12
|
Jaffe AB and Hall A: Rho GTPases:
Biochemistry and biology. Annu Rev Cell Dev Biol. 21:247–269. 2005.
View Article : Google Scholar : PubMed/NCBI
|
|
13
|
Wheeler AP and Ridley AJ: Why three Rho
proteins? RhoA, RhoB, RhoC and cell motility. Exp Cell Res.
301:43–49. 2004. View Article : Google Scholar : PubMed/NCBI
|
|
14
|
Aznar S and Lacal JC: Rho signals to cell
growth and apoptosis. Cancer Lett. 165:1–10. 2001. View Article : Google Scholar : PubMed/NCBI
|
|
15
|
Adamson P, Paterson HF and Hall A:
Intracellular localization of the P21rho proteins. J Cell Biol.
119:617–627. 1992. View Article : Google Scholar : PubMed/NCBI
|
|
16
|
Simpson KJ, Dugan AS and Mercurio AM:
Functional analysis of the contribution of RhoA and RhoC GTPases to
invasive breast carcinoma. Cancer Res. 64:8694–8701. 2004.
View Article : Google Scholar : PubMed/NCBI
|
|
17
|
Vega FM, Fruhwirth G, Ng T and Ridley AJ:
RhoA and RhoC have distinct roles in migration and invasion by
acting through different targets. J Cell Biol. 193:655–665. 2011.
View Article : Google Scholar : PubMed/NCBI
|
|
18
|
Cho HJ, Baek KE, Park SM, Kim IK, Nam IK,
Choi YL, Park SH, Im MJ, Choi J, Ryu J, et al: RhoGDI2 confers
gastric cancer cells resistance against cisplatin-induced apoptosis
by upregulation of Bcl-2 expression. Cancer Lett. 311:48–56. 2011.
View Article : Google Scholar : PubMed/NCBI
|
|
19
|
Costello PS, Cleverley SC, Galandrini R,
Henning SW and Cantrell DA: The GTPase rho controls a p53-dependent
survival checkpoint during thymopoiesis. J Exp Med. 192:77–85.
2000. View Article : Google Scholar : PubMed/NCBI
|
|
20
|
Lotze MT and Tracey KJ: High-mobility
group box 1 protein (HMGB1): Nuclear weapon in the immune arsenal.
Nat Rev Immunol. 5:331–342. 2005. View
Article : Google Scholar : PubMed/NCBI
|
|
21
|
Wang W, Jiang H, Zhu H, Zhang H, Gong J,
Zhang L and Ding Q: Overexpression of high mobility group box 1 and
2 is associated with the progression and angiogenesis of human
bladder carcinoma. Oncol Lett. 5:884–888. 2013.PubMed/NCBI
|
|
22
|
Cunha C, Carvalho A, Esposito A, Bistoni F
and Romani L: DAMP signaling in fungal infections and diseases.
Front Immunol. 3:2862012. View Article : Google Scholar : PubMed/NCBI
|
|
23
|
White E and DiPaola RS: The double-edged
sword of autophagy modulation in cancer. Clin Cancer Res.
15:5308–5316. 2009. View Article : Google Scholar : PubMed/NCBI
|
|
24
|
Livesey KM, Tang D, Zeh HJ and Lotze MT:
Autophagy inhibition in combination cancer treatment. Curr Opin
Investig Drugs. 10:1269–1279. 2009.PubMed/NCBI
|
|
25
|
Xie M, Kang R, Yu Y, Zhu S, He YL, Xu WQ,
Tang DL and Cao LZ: Enhancive effect of HMGB1 gene silence on
adriamycin-induced apoptosis in K562/A02 drug resistance leukemia
cells. Zhonghua Xue Ye Xue Za Zhi. 29:549–552. 2008.(In Chinese).
PubMed/NCBI
|
|
26
|
Yu Y, Xie M, He YL, Xu WQ, Zhu S and Cao
LZ: Role of high mobility group box 1 in adriamycin-induced
apoptosis in leukemia K562 cells. Ai Zheng. 27:929–933. 2008.(In
Chinese). PubMed/NCBI
|
|
27
|
Huang J, Ni J, Liu K, Yu Y, Xie M, Kang R,
Vernon P, Cao L and Tang D: HMGB1 promotes drug resistance in
osteosarcoma. Cancer Res. 72:230–238. 2012. View Article : Google Scholar : PubMed/NCBI
|
|
28
|
Huang J, Liu K, Yu Y, Xie M, Kang R,
Vernon P, Cao L, Tang D and Ni J: Targeting HMGB1-mediated
autophagy as a novel therapeutic strategy for osteosarcoma.
Autophagy. 8:275–277. 2012. View Article : Google Scholar : PubMed/NCBI
|
|
29
|
Dell'Orco RT, McClung JK, Jupe ER and Liu
XT: Prohibitin and the senescent phenotype. Exp Gerontol.
31:245–252. 1996. View Article : Google Scholar : PubMed/NCBI
|
|
30
|
Coates PJ, Nenutil R, McGregor A, Picksley
SM, Crouch DH, Hall PA and Wright EG: Mammalian prohibitin proteins
respond to mitochondrial stress and decrease during cellular
senescence. Exp Cell Res. 265:262–273. 2001. View Article : Google Scholar : PubMed/NCBI
|
|
31
|
Czarnecka AM, Campanella C, Zummo G and
Cappello F: Mitochondrial chaperones in cancer: From molecular
biology to clinical diagnostics. Cancer Biol Ther. 5:714–720. 2006.
View Article : Google Scholar : PubMed/NCBI
|
|
32
|
Rizwani W, Alexandrow M and Chellappan S:
Prohibitin physically interacts with MCM proteins and inhibits
mammalian DNA replication. Cell Cycle. 8:1621–1629. 2009.
View Article : Google Scholar : PubMed/NCBI
|
|
33
|
Zhou TB and Qin YH: Signaling pathways of
prohibitin and its role in diseases. J Recept Signal Transduct Res.
33:28–36. 2013. View Article : Google Scholar : PubMed/NCBI
|
|
34
|
Gogvadze V, Orrenius S and Zhivotovsky B:
Mitochondria as targets for cancer chemotherapy. Semin Cancer Biol.
19:57–66. 2009. View Article : Google Scholar : PubMed/NCBI
|