Introduction
Glioblastoma multiforme (GBM) is the most prevalent
brain and central nervous system (CNS) malignancy, accounting for
45.2% of primary brain malignancies and CNS tumors, 54% of all
gliomas and 16% of all primary brain and CNS tumors (1). In addition, the mean annual incidence
rate of GBM is 3.19/100,000 population (2). Despite decades of concerted efforts and
advances in surgery, radiotherapy and chemotherapy, patients that
develop this disease continue to have a poor prognosis. The median
survival time is 3 months with no treatment and 1–2 years with
treatment from the time of diagnosis (3). The invasive nature of GBM makes it
impossible to remove the tumor completely, even with aggressive
surgical resection (4). Thus, there
is a strong need to understand the molecular basis of this fatal
malignancy in order to identify novel targets that can be
translated into new diagnostic and therapeutic tools (5). To date, multiple factors, such as Myc
(6), EGFR (7), FGL2 (8)
and microRNA-145 (4), have been
proposed to be involved in the occurrence of GBM. Although
considerable progress has been made in research of the molecular
mechanism of GBM in recent years, its detailed mechanism remains
unknown.
SET, which belongs to the NAP1 family of histone
chaperones (9), is a PP2A inhibitor
(10) and a 39-kDa phosphoprotein
encoded by the SET gene. SET was originally identified as a
component of the SET-CAN fusion gene produced by somatic
translocation in acute and undifferentiated leukemia (11). It is a multifunctional protein that
interacts with other proteins in the regulation of cellular
signaling (12). SET has been
described as an oncogene that regulates important signaling
pathways, with SET reported to have roles in inhibiting the DNase
activity of tumor suppressor NM23-H1, increasing AP-1 activity,
activating MAPK signaling, regulating granzyme B (13) and producing IFN-γ in human NK cells.
All these functions are involved in SET-regulated cell apoptosis,
cell cycle progression and cell mortality (14) through cell processes, such as DNA
replication, chromatin remodeling, gene transcription,
differentiation and migration (15).
Furthermore, SET is overexpressed in various types of cancer,
including brain, lung, ovarian, head and neck, and prostate cancer,
Wilms' tumor, colorectal adenocarcinoma, and leukemia (16).
In order to understand the detailed mechanism of SET
in the occurrence of GBM, immunohistochemistry (IHC) was performed
to determine the protein expression level of SET in glioblastoma
tissues and normal brain tissues via the streptavidin-peroxidase
(SP) method. After SET was silenced with small interfering (si)RNA,
flow cytometry, Cell Counting Kit-8 (CCK-8) and Transwell migration
assays were performed on U251−SET and
U87MG−SET cells to determine cell apoptosis, cell
proliferation and cell migration, respectively. In addition,
reverse transcription-quantitative polymerase chain reaction
(RT-qPCR) and western blotting were used to examine mRNA and
protein expression levels of Bcl-2, Bax and caspase-3 in
U251−SET and U87MG−SET cells,
respectively.
Materials and methods
Tissue specimens
Human glioblastoma tissues were obtained from 20
patients and normal brain tissues were obtained from 12 patients
(including 6 adjacent normal tissues and 6 other patients) that
underwent surgery at The Third People's Hospital of Chengdu
(Chengdu, China) between April 2012 and January 2015. Sample
acquisition was approved by the Medical Research Ethics Committee
of The Third People's Hospital of Chengdu and written informed
consent was obtained from all patients. Clinicopathological
parameters are indicated in Table
I.
 | Table I.Clinicopathological parameters of 26
patients with glioblastoma. |
Table I.
Clinicopathological parameters of 26
patients with glioblastoma.
| Parameter | n |
|---|
| Gender |
|
|
Female | 12 |
|
Male | 14 |
| Age, years |
|
|
≥50 | 14 |
|
<50 | 12 |
| WHO
classificationa |
|
| I | 3 |
| II | 6 |
|
III | 6 |
| IV | 5 |
| Differentiation
degreeb |
|
|
Well | 3 |
|
Moderate | 6 |
|
Low | 11 |
Antibodies
The primary antibodies used for western blotting
were as follows: Rabbit polyclonal SET antibody (1:1,000 dilution;
catalog no. sc-25564), rabbit polyclonal Bcl-2 antibody (1:500
dilution; catalog no. sc-492), rabbit polyclonal Bax antibody
(1:1,000 dilution; catalog no. sc-623), mouse monoclonal caspase-3
antibody (1:800 dilution; catalog no. sc-65497) and mouse
monoclonal β-actin antibody (1:1,000 dilution; catalog no.
sc-8432). The secondary antiobodies used were anti-rabbit
immunoglobulin (Ig)G (catalog no. zb2301) and anti-mouse IgG
(catalog no. zb2305) horseradish peroxidase-conjugated antibodies
(1:2,000 dilution; Santa Cruz Biotechnology, Inc., Dallas, TX,
USA). Detection was performed using a Chemiluminescent Western Blot
detection kit (Thermo Fisher Scientific, Inc., Waltham, MA,
USA).
IHC
Glioblastoma tissue specimens were fixed in formalin
and embedded in paraffin. The sections were cut to 4 µm. After
dewaxing with xylene and rehydrating with sequential ethanol, the
sections were blocked with 3% H2O2 at room
temperature for endogenous peroxidase ablation for 10 min, and
antigen retrieval was performed with citrate buffer at ~95°C for 20
min. After rinsing in phosphate-buffered saline (PBS) with Tween 20
(0.01 M of PBS, pH 7.4; 3×5 min), the sections were incubated with
goat serum (Zhongshan Goldenbridge Biotechnology Co., Ltd.,
Beijing, China) at 37°C for 30 min. Subsequently, samples were
incubated with rabbit SET antibody (Santa Cruz Biotechnology, Inc.)
diluted in PBS (0.01 M of PBS, pH 7.4) at 4°C overnight followed by
biotin-labeled goat anti-rabbit IgG and
streptavidin/horseradish-peroxidase at 37°C for 1 h. Then, the
sections were stained with 3,3′-diaminobenzidine (Zhongshan
Goldenbridge Biotechnology Co., Ltd.) in the dark for ~2 min until
coloration (Nikon TS100; Nikon Corporation, Tokyo, Japan) was
complete, counterstained with hematoxylin for 2 min, dehydrated,
cleared with running water and mounted with neutral gums. The same
steps were conducted for the negative control group, but the rabbit
SET antibody was replaced with PBS.
Staining intensity was graded as 0 (negative), 1
(weak), 2 (moderate) or 3 (strong); while staining extent was
graded as 0 (<5%), 1 (5–25%), 2 (25–50%), 3 (50–75%) or 4
(>75%). The sum of the staining intensity and extent values were
used to determine the final expression of SET, as follows: 0
(negative, +), 2–3 (weak positive, +), 4–5 (moderate positive, ++)
and 6–7 (strong positive, +++). Optical density (OD) values of SET
expression were examined with Image ProPlus 6.0 software (Media
Cybernetics, Inc., Rockville, MD, USA).
Cell lines and culture conditions
Human glioblastoma cell lines, U87MG and U251
(American Type Culture Collection, Manassas, VA, USA), were
cultured in Dulbecco's Modified Eagle's medium (DMEM; Hyclone; GE
Healthcare Life Sciences, Logan, UT, USA) containing 10% fetal
bovine serum, penicillin (100 IU/ml) and streptomycin (100 µg/ml).
Cells were grown at 37°C in a humidified atmosphere with 5%
CO2. Experiments were performed using cells harvested
from exponentially growing cultures.
RNA interference (RNAi) of SET
Three groups were established as follows:
Non-treatment control (blank), negative control (NC; control siRNA)
and experimental groups. siRNA experiments were performed using 5
µl Lipofectamine 2000 (Invitrogen; Thermo Fisher Scientific, Inc.)
to transfect 50 nM siRNA (siRNA sequences, 5′-GGAGGAAGGAUUAGAAGA
UdT dT-3′; and 3′-dTd TGACCUUUCCUAAACUGCUU-5′) when cell density
reached 3×10⁵ cells/well in a 6-well plate (Corning Life
Sciences, Tewksbury, MA, USA). Negative experiments were performed
using 5 µl Lipofectamine 2000 to transfect 50 Nm negative control
RNA when the cell density reached 3×10⁵ cells/well in a
6-well plate, while in the blank group, only culture medium without
serum and antibiotics was used when the cell density reached
3×10⁵ cells/well in a 6-well plate. The transfection
medium was removed after 6 h and replaced with fresh growth medium.
Transfected cells were collected at 48 h to detect mRNA expression
levels by RT-qPCR and at 72 h to detect protein expression levels
by western blotting.
Cell proliferation assay
Cells in the logarithmic phase were cultured in
96-well culture plates at a cell density of 103
cells/well in medium with 10% fetal bovine serum (FBS; Gibco;
Thermo Fisher Scientific, Inc.). CCK-8 reagents (10 µl;
Sigma-Aldrich, St. Louis, MO, USA) were added at various time
points (12, 24, 36, 48 and 60 h). After cells were cultured for 2
h, the medium was removed, 150 µl dimethylsulfoxide was added into
each well and cells were incubated for 15 min. Plates were read at
an absorbance wavelength of 450 nm using a microplate reader (Model
680; Bio-Rad Laboratories, Hercules, CA USA). Each transfection
group had six replicates and the experiment was repeated three
times.
Flow cytometry
Cells in the logarithmic phase were collected and
cultured in 6-well culture plates. In the cell apoptosis
experiment, cells were collected at 24 h post-transfection, washed
twice using PBS and centrifuged at 370 × g (5 min at 4°C). Cell
pellets were suspended in 400 µl PBS, then 5 µl Annexin
V-fluorescein isothiocyanate (BD Biosciences, Franklin Lakes, NJ,
USA) was added. The mixture was gently agitated and placed in room
temperature for 10 min. Subsequently, 10 µl propidium iodide (20
µg/ml; BD Biosciences) was added and incubated for 30 min at 4°C.
The effect of SET siRNA on cell apoptosis was analyzed by flow
cytometry (FACSAria II Cell Sorter; BD Biosciences). Each
transfection group had three replicates and the experiment was
repeated three times.
Cell migration assay
A Transwell migration assay was performed to examine
cell proliferation. Cells in the logarithmic phase were cultured
and seeded into the upper chamber of a Transwell (EMD Millipore,
Billerica, MA, USA) at a density of 2×10⁵ cells/well in
medium without FBS. Medium containing 10% FBS was placed in the
lower chamber to act as a chemoattractant. After 48 h,
non-migratory cells that remained on the upper chambers were
removed by scraping them with a cotton swab. Cells that migrated to
the lower surface through the 8.0-µm polycarbonate membrane were
stained with 0.1% crystal violet for 15 min. Migrated cells were
quantified by counting stained cells under a microscope (×400
magnification). Five random fields were selected for each well to
determine the total number of migrated cells. The assay was
performed in triplicate and repeated three times.
RT-qPCR analysis
RT-qPCR was used to detect differences in mRNA
expression. After transfection for 24–36 h, RNA was extracted from
cells using TRIzol reagent (Invitrogen; Thermo Fisher Scientific,
Inc.), according to manufacturer's instructions. The RNA was
purified using a total of 10 µl reagent, including 2 µl 5X gDNA
Eraser Buffer, 1 µl gDNA Eraser, 1 µg RNA and RNase-Free
dH2O (amount determined by the concentration of RNA) at
42°C for 2 min. Total RNA (1 µg) was reverse transcribed using an
M-Mulv reverse transcriptase kit (Takara, Japan). qPCR was then
performed with 2 µl cDNA using SYBR Premix Ex Taq (Takara, Japan),
according to manufacturer's instructions and in accordance with
international standards (6–8). Primers are indicated in Table II and the amplification was performed
on a Bio-Rad C1000 Touch Thermal Cycler (Bio-Rad Laboratories). PCR
cycling conditions are stated in Table
III. The GAPDH gene was used as an endogenous control
and the ΔΔCq method was used to quantify the data (19) and the experiment was repeated three
times.
| Table II.Primer sequences for reverse
transcription-quantitative polymerase chain reaction. |
Table II.
Primer sequences for reverse
transcription-quantitative polymerase chain reaction.
| Gene | Primer
sequence | Location | Product length,
bp |
|---|
| SET |
5′-GCTCAACTCCAACCACGAC-3′ | 389–407 | 120 |
|
|
5′-TCCTCACTGGCTTGTTCATTA-3′ | 508–488 |
|
| Bax |
5′-AAGCTGAGCGAGTGTCTCAAG-3′ | 172–192 | 178 |
|
|
5′-CAAAGTAGAAAAGGGCGACAAC-3′ | 349–328 |
|
| Bcl-2 |
5′-GTTTGATTTCTCCTGGCTGTCTC-3′ | 1–23 | 133 |
|
|
5′-GAACCTTTTGCATATTTGTTTGG-3′ | 649–627 |
|
|
Caspase-3 |
5′-ATCACAGCAAAAGGAGCAGTTT-3′ | 583–604 | 214 |
|
|
5′-ACACCACTGTCTGTCTCAATGC-3′ | 796–775 |
|
| GAPDH |
5′-GGAAGGTGAAGGTCGGAGT-3′ | 107–125 | 117 |
|
|
5′-TGAGGTCAATGAAGGGGTC-3′ | 223–205 |
|
| Table III.Polymerase chain reaction cycling
conditions. |
Table III.
Polymerase chain reaction cycling
conditions.
| Gene | Conditions |
|---|
| Set | 95°C 30 sec; 95°C
10 sec; 62°C 30 sec; |
|
| 68°C 20 sec; for 40
cycles; |
| Bax | 95°C 30 sec; 95°C
10 sec; 60°C 30 sec; |
|
| 68°C 20 sec; for 40
cycles; |
| Bcl-2 | 95°C 30 sec; 95°C
10 sec; 57°C 30 sec; |
|
| 68°C 20 sec; for 40
cycles; |
|
Caspase-3 | 95°C 30 sec; 95°C
10 sec; 60°C 30 sec; |
|
| 68°C 20 sec; for 40
cycles |
| GAPDH | 95°C 30 sec; 95°C
10 sec; 58°C 30 sec; |
|
| 68°C 20 sec; for 40
cycles; |
Western blot analysis
Cells were lysed in ice-cold RIPA buffer (Beyotime
Institute of Biotechnology, Nantong, China). Total protein
concentration was determined using an Enhanced BCA Protein assay
kit (Beyotime Institute of Biotechnology). Equal amounts of
proteins were separated by 12% SDS-PAGE and transferred onto PVDF
membranes (EMD Millipore). After blocking in Tris-buffered saline
containing 5% non-fat milk, the membranes were incubated with
primary antibodies at 4°C overnight; followed by incubation with
horseradish peroxidase-conjugated anti-rabbit antibody (Santa Cruz
Biotechnologies, Inc.) at room temperature for 1 h. Signals were
detected on a gel imaging system using the electrochemiluminescent
western blotting substrate (Thermo Fisher Scientific, Inc.). The
expression of β-actin was used as the loading control. Quantity One
software (v.4.62; Bio-Rad Laboratories) was used for
quantification.
Statistical analysis
Data are presented in means ± standard deviation of
at least three separate experiments. Independent-samples t-test and
paired-samples t-test were used for comparison of normally
distributed data. SPSS statistical software package (version 18;
SPSS, Inc., Chicago, IL, USA) was used for statistical analysis.
P<0.05 was considered to indicate a statistically significant
difference.
Results
Expression of SET in glioma
tissues
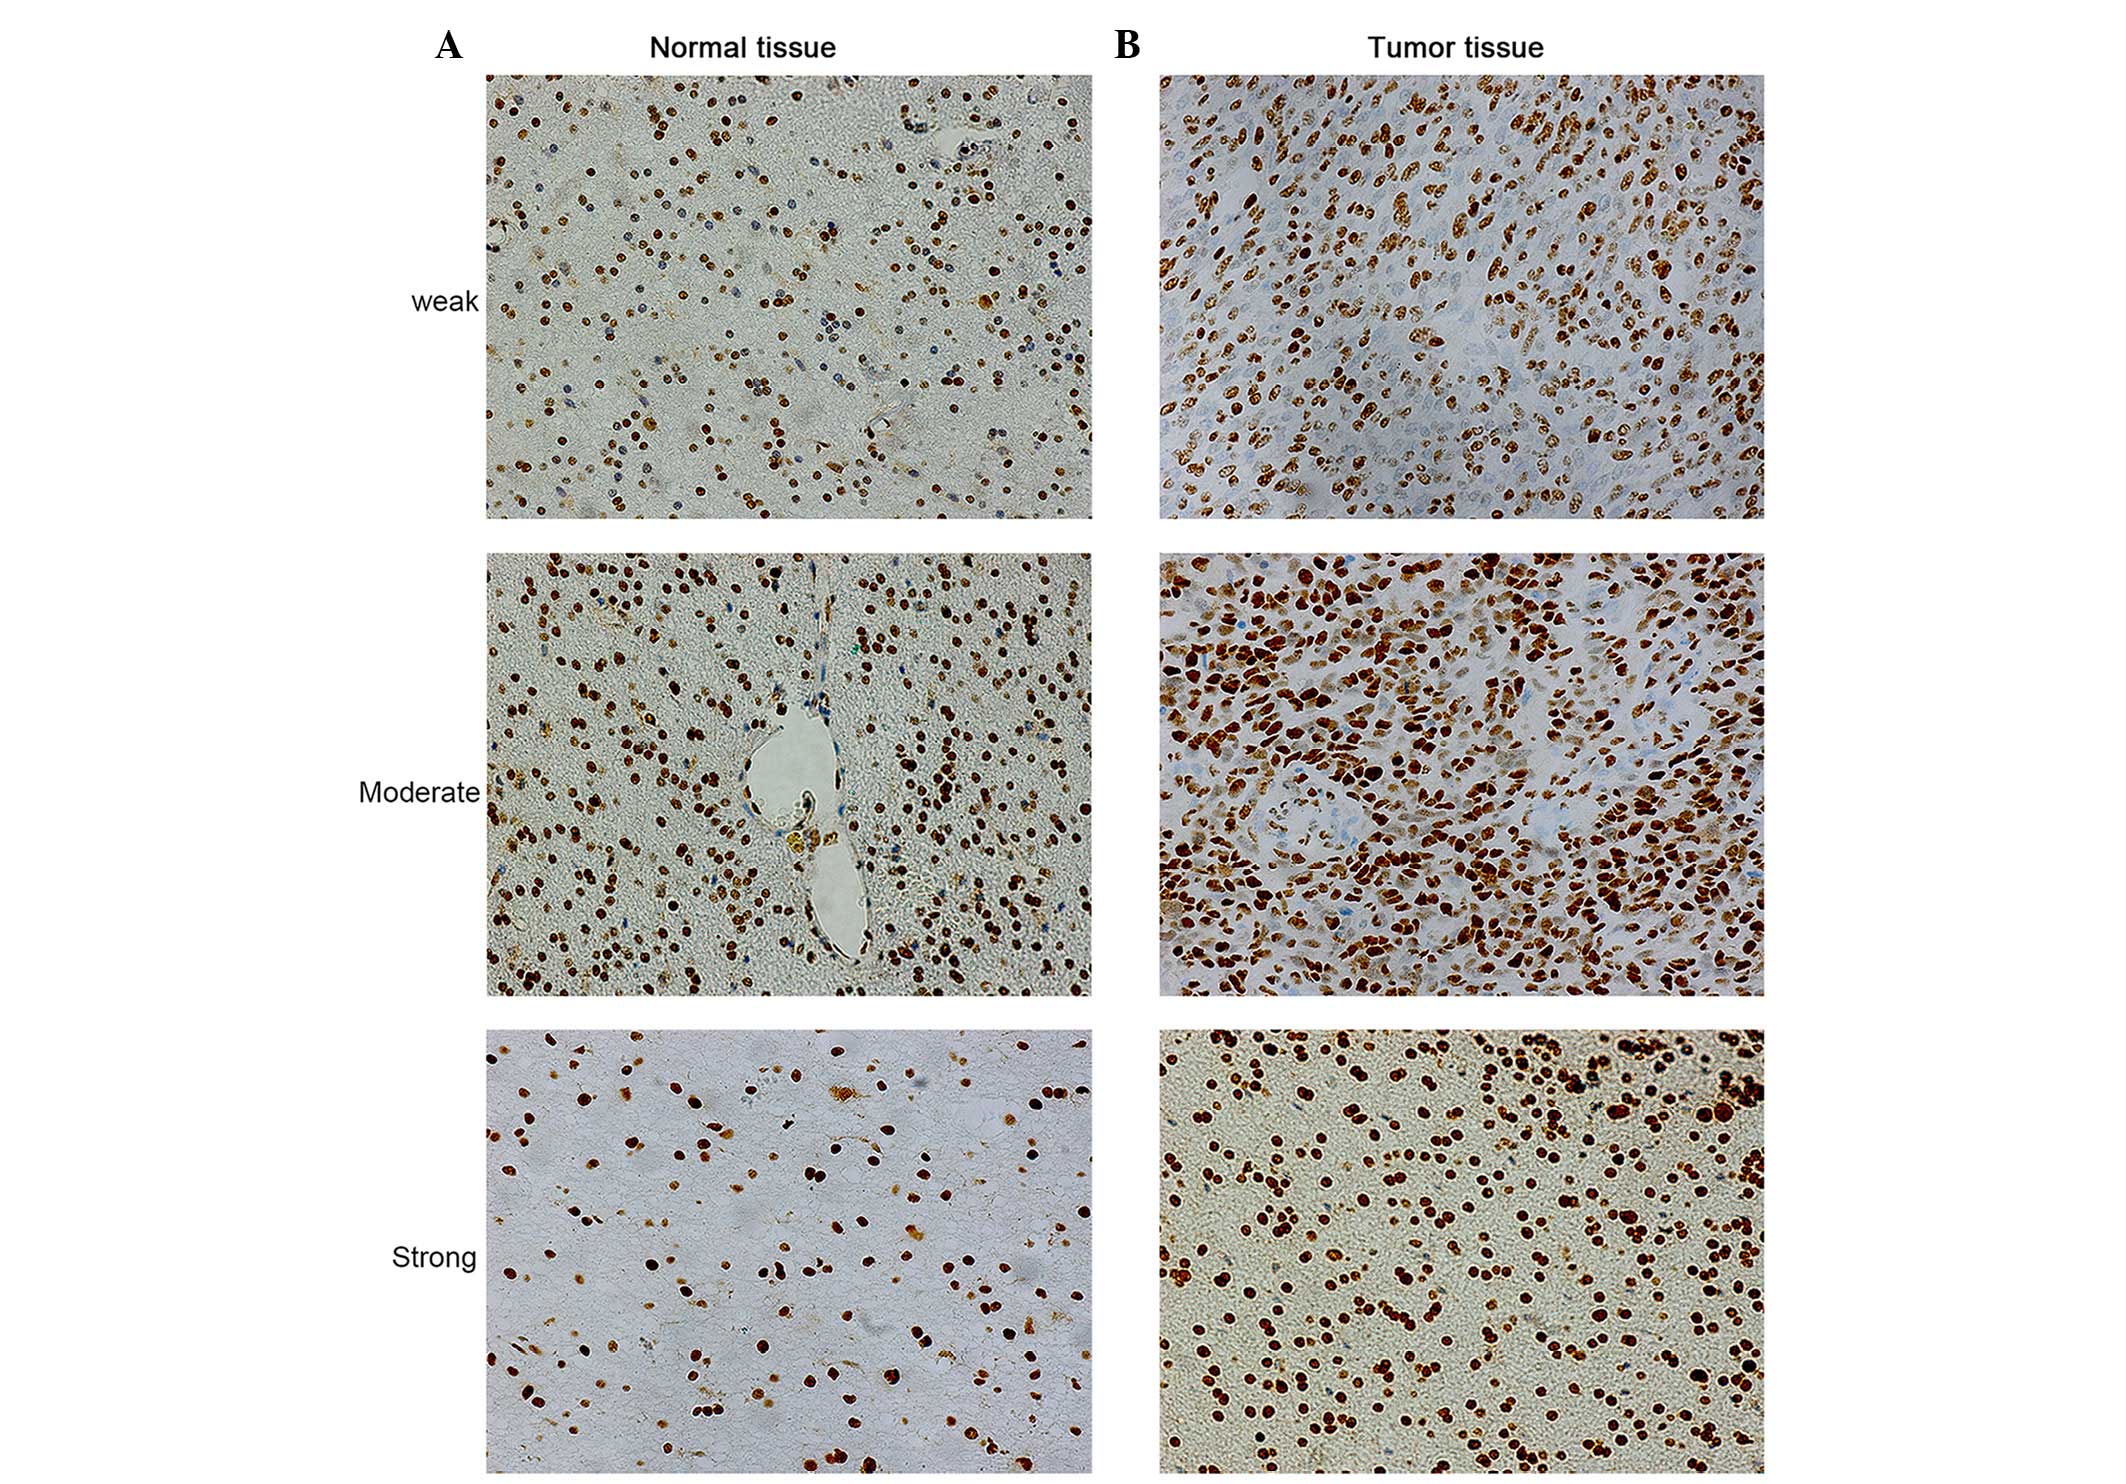
Representative staining of SET in glioma tissues is
shown in Fig. 1. Positive expression
of SET was observed in the cell nucleus. SET protein expression was
detected in 100% (20/20) of cancer samples. Among the 18 cases of
glioma and 2 cases of meningioma, 15% (3/20), 25% (5/20) and 60%
(12/20) of cases exhibited weak (+), moderate (++) and strong (+++)
SET protein staining, respectively. By contrast, among the 12
normal tissues, including 6 adjacent normal tissue and 6 other
patient samples, 83.33% (10/12), 8.33% (1/12) and 8.33% (1/12) of
normal brain specimens exhibited weak (+), moderate (++) and strong
(+++) SET protein staining, respectively. The OD of SET was
examined by Image ProPlus software. Results revealed that the
protein expression level of SET significantly increased in glioma
tissues compared with normal brain specimens (P=0.001). Thus, SET
appears to be frequently upregulated in glioma tissues at the
protein level. In addition, there were significant associations
between SET expression and gender (P=0.002), World Health
Organization grade II (18)
(P=0.031), III (P=0.003) and IV (P=0.001) cancer, and
moderately-differentiated (P=0.031) and poorly-differentiated
(P=0.001) cancer. However, the association between SET expression
and age (P=0.419), WHO grade I cancer (P=0.304) and
well-differentiated cancer (P=0.298) were not statistically
significant (Table IV).
| Table IV.OD values for SET expression in
association with clinicopathological parameters of cancer
samples. |
Table IV.
OD values for SET expression in
association with clinicopathological parameters of cancer
samples.
| Parameter | OD (mean ± SD) | P-value |
|---|
| Gender |
|
|
|
Female | 0.89±0.19 | 0.002 |
|
Male | 1.0±0.16 |
|
| Age, years |
|
|
|
≥50 | 0.99±0.17 | 0.419 |
|
<50 | 0.90±0.18 |
|
| WHO
classificationa |
|
|
| I | 0.58±0.14 | 0.304 |
| II | 0.90±0.11 | 0.031 |
|
III | 0.91±0.20 | 0.003 |
| IV | 1.11±0.12 | 0.001 |
| Differentiation
degreeb |
|
|
|
Well | 0.58±0.14 | 0.298 |
|
Moderate | 0.90±0.11 | 0.031 |
|
Low | 0.99±0.16 | 0.001 |
Inhibition of SET promotes cell
apoptosis
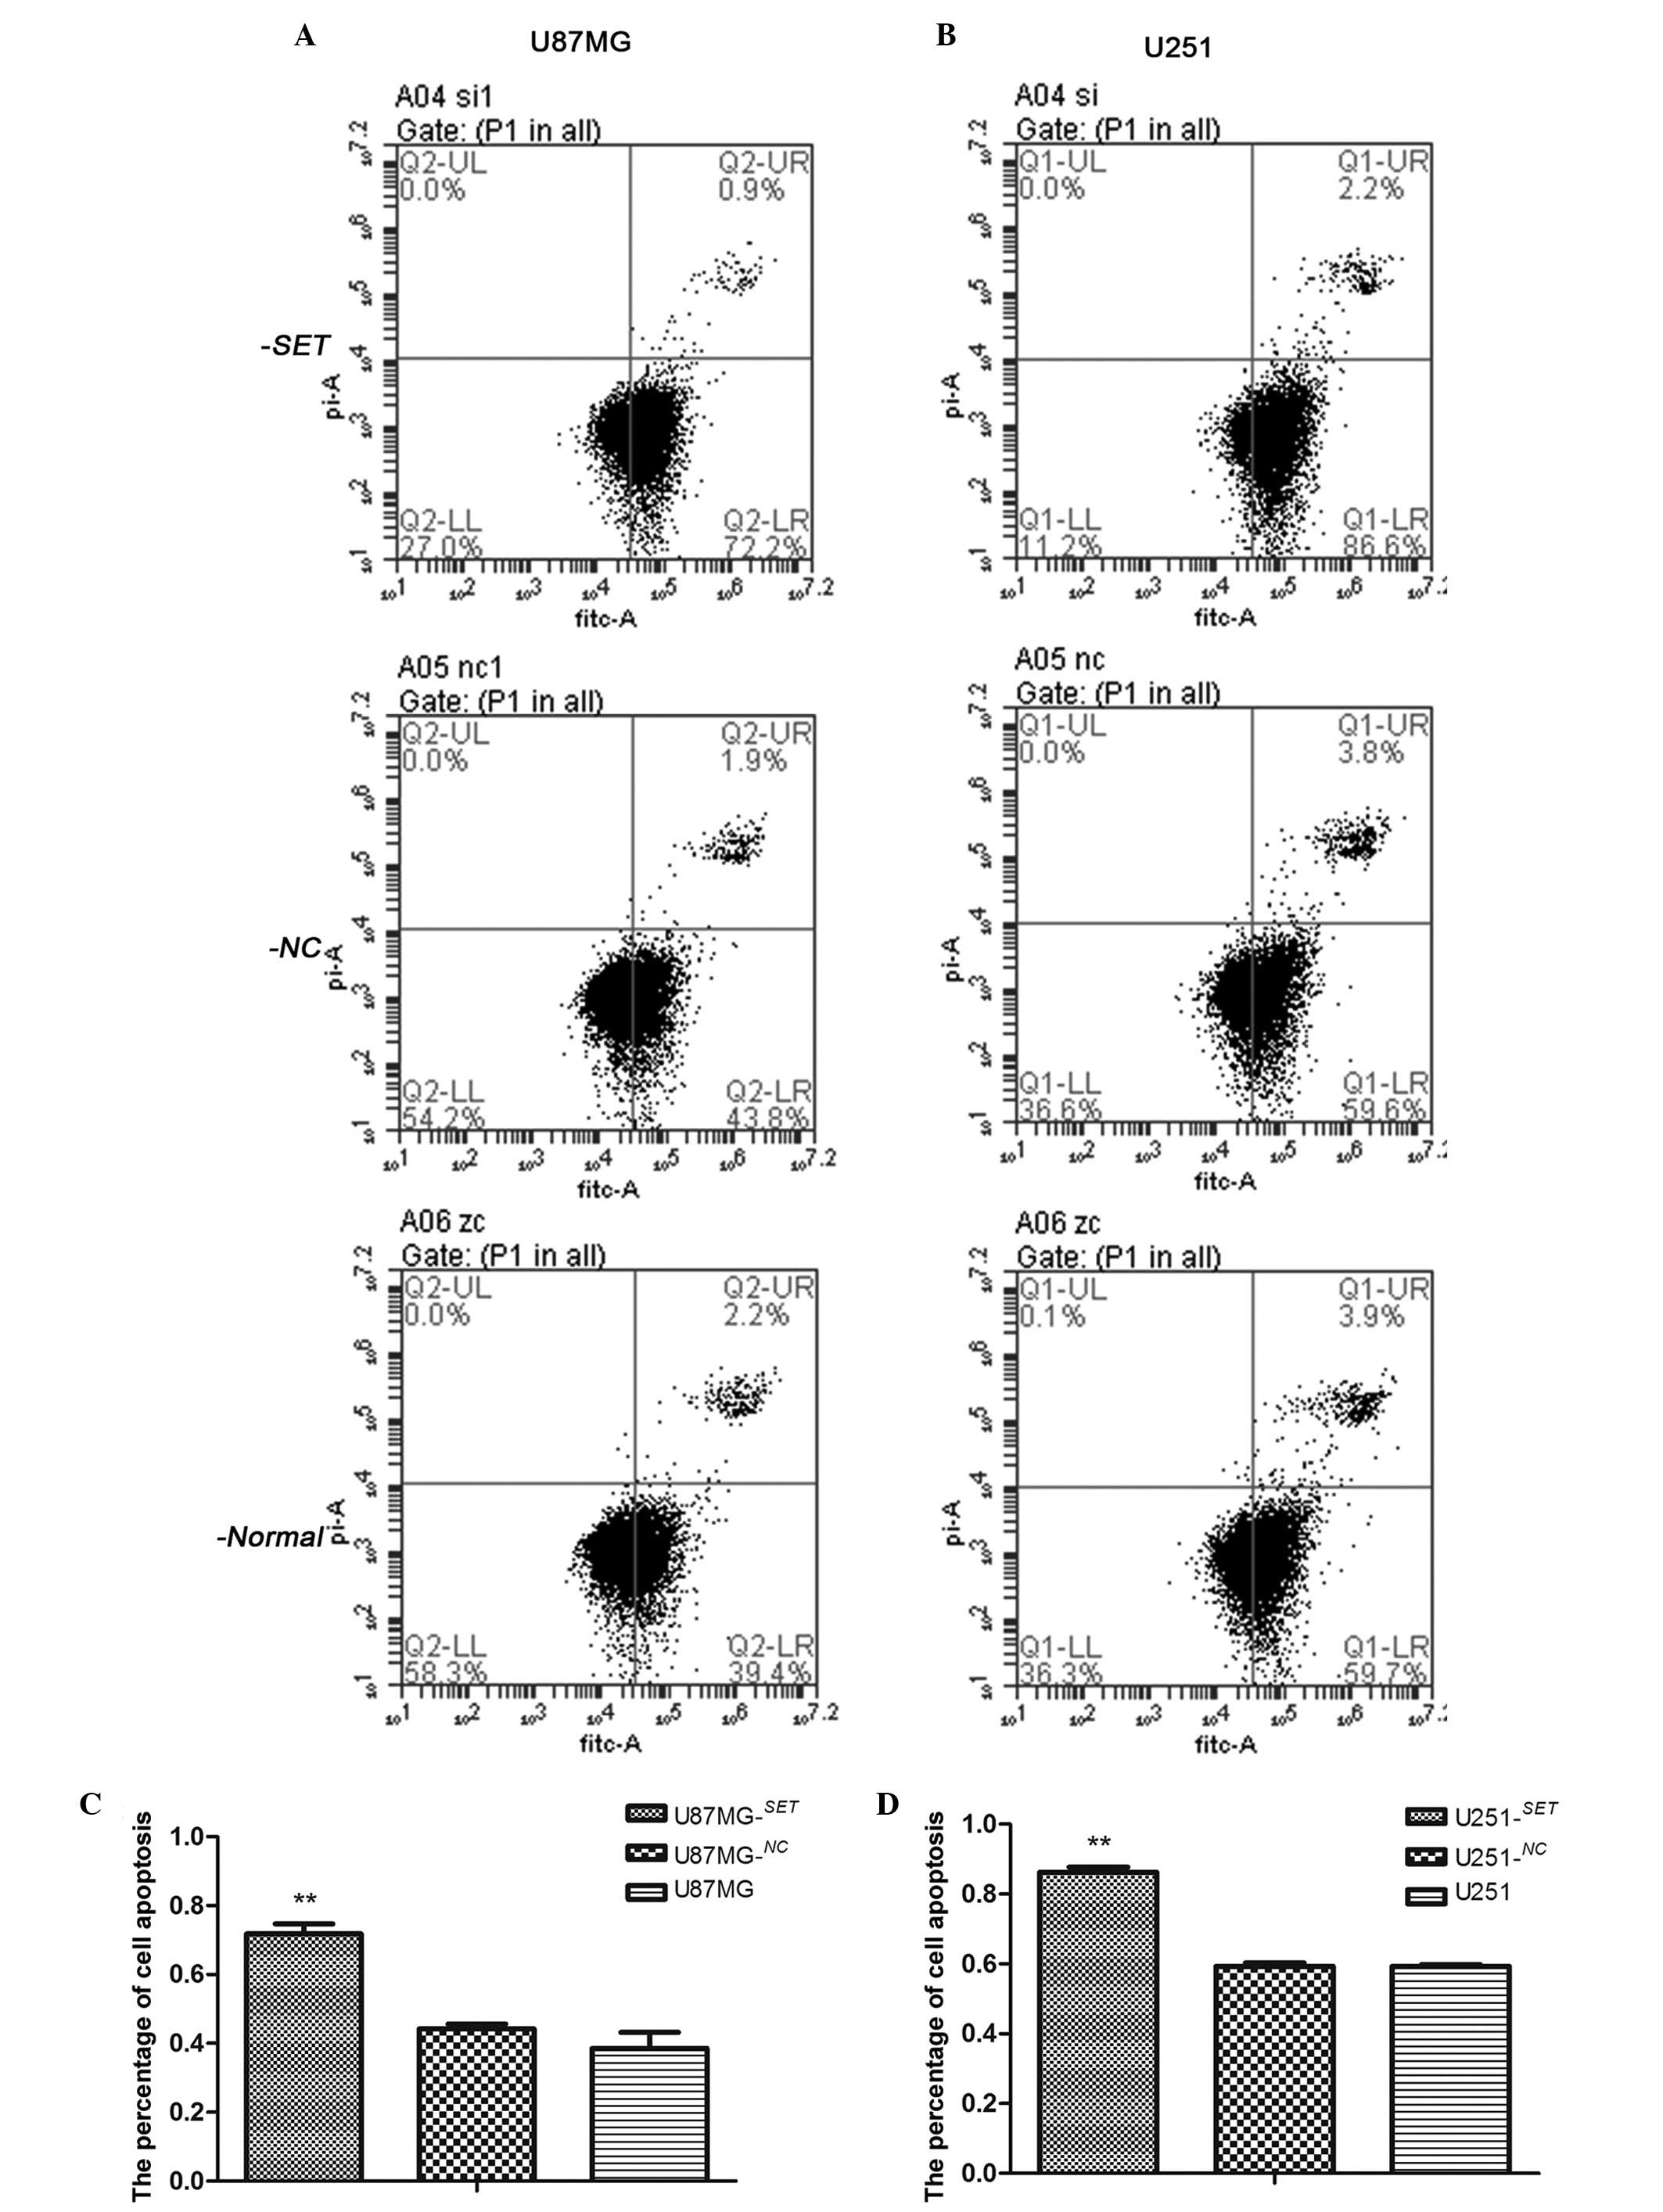
Following transfection for 48 h, the cell apoptosis
rates of U87MG−SET, U87MG−NC and U87MG cells
were 71.8±2.92, 44.17±1.48 and 38.56±4.61%, respectively. The cell
apoptosis rate of U87MG−SET cells was significantly
higher than that of U87MG−NC (P=0.001) and U87MG
(P=0.001) cells. There was no statistical significance noted
between U87MG−NC and U87MG cells (P=0.161). The
apoptosis rates of U251−SET, U251−NC and U251
cells were 86.2±1.54, 59.33±0.93 and 59.3±0.46%, respectively. The
U251−SET cell apoptosis rate was significantly higher
than that of U251−NC (P<0.01) and U251 (P<0.01)
cells. No statistically significant difference was found between
the U251−NC and U251 cells (P=0.479) (Fig. 2).
Inhibition of SET downregulates cell
proliferation
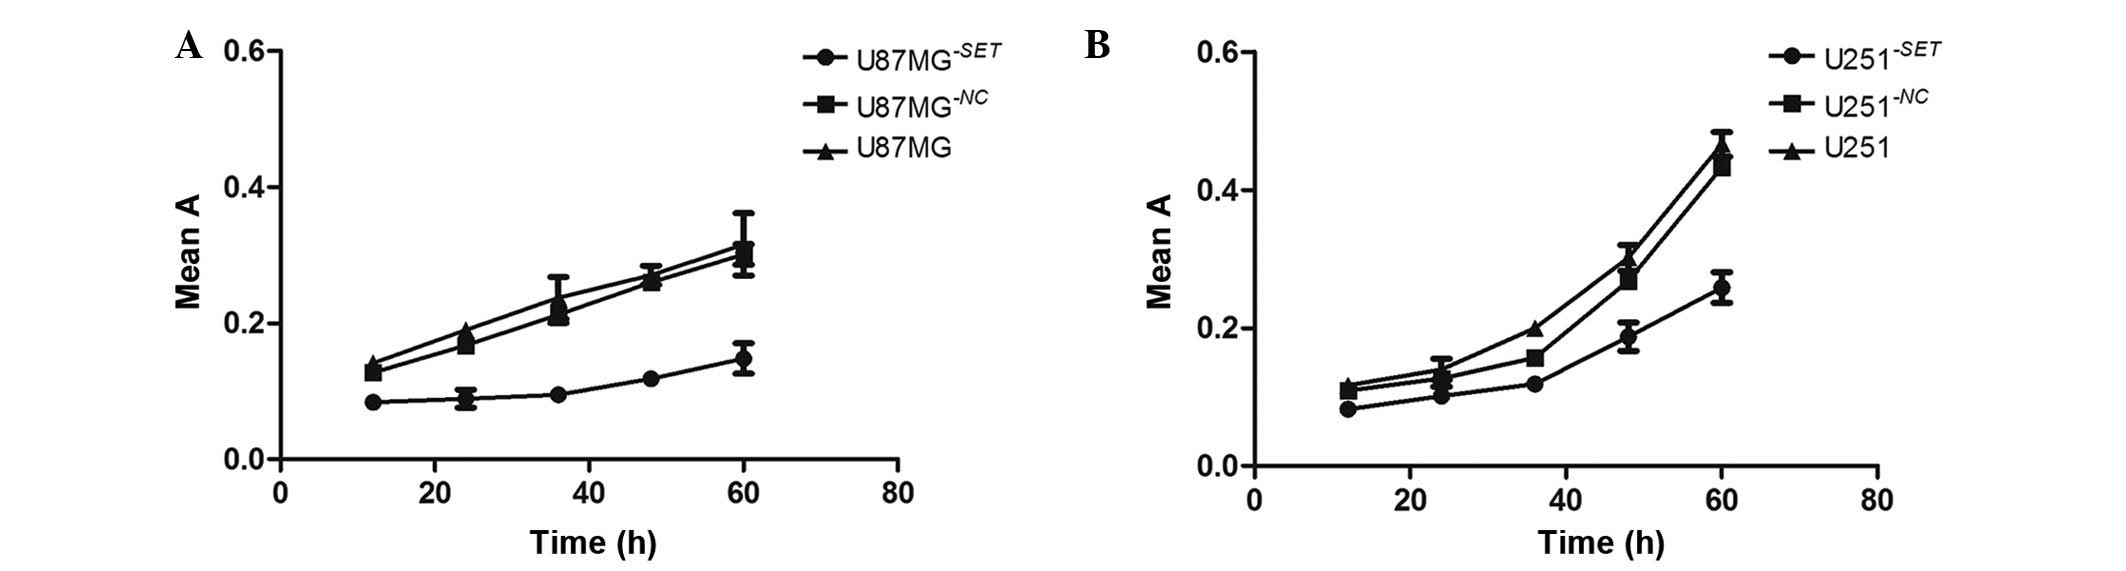
Compared with the blank group, cell proliferation
significantly declined in U87MG−SET (51.04±10.22%,
P=0.002) and U251−SET (32.45±6.99%, P=0.015) cells,
respectively, in a time-dependent manner (12, 24, 36, 48 and 60 h
after transfection). However, there was no statistically
significant difference in U87MG−NC (7.80±3.62%, P=0.057)
and U251−NC (10.79±6.04%, P=0.110) cells (Fig. 3).
Inhibition of SET reduces cell
migration
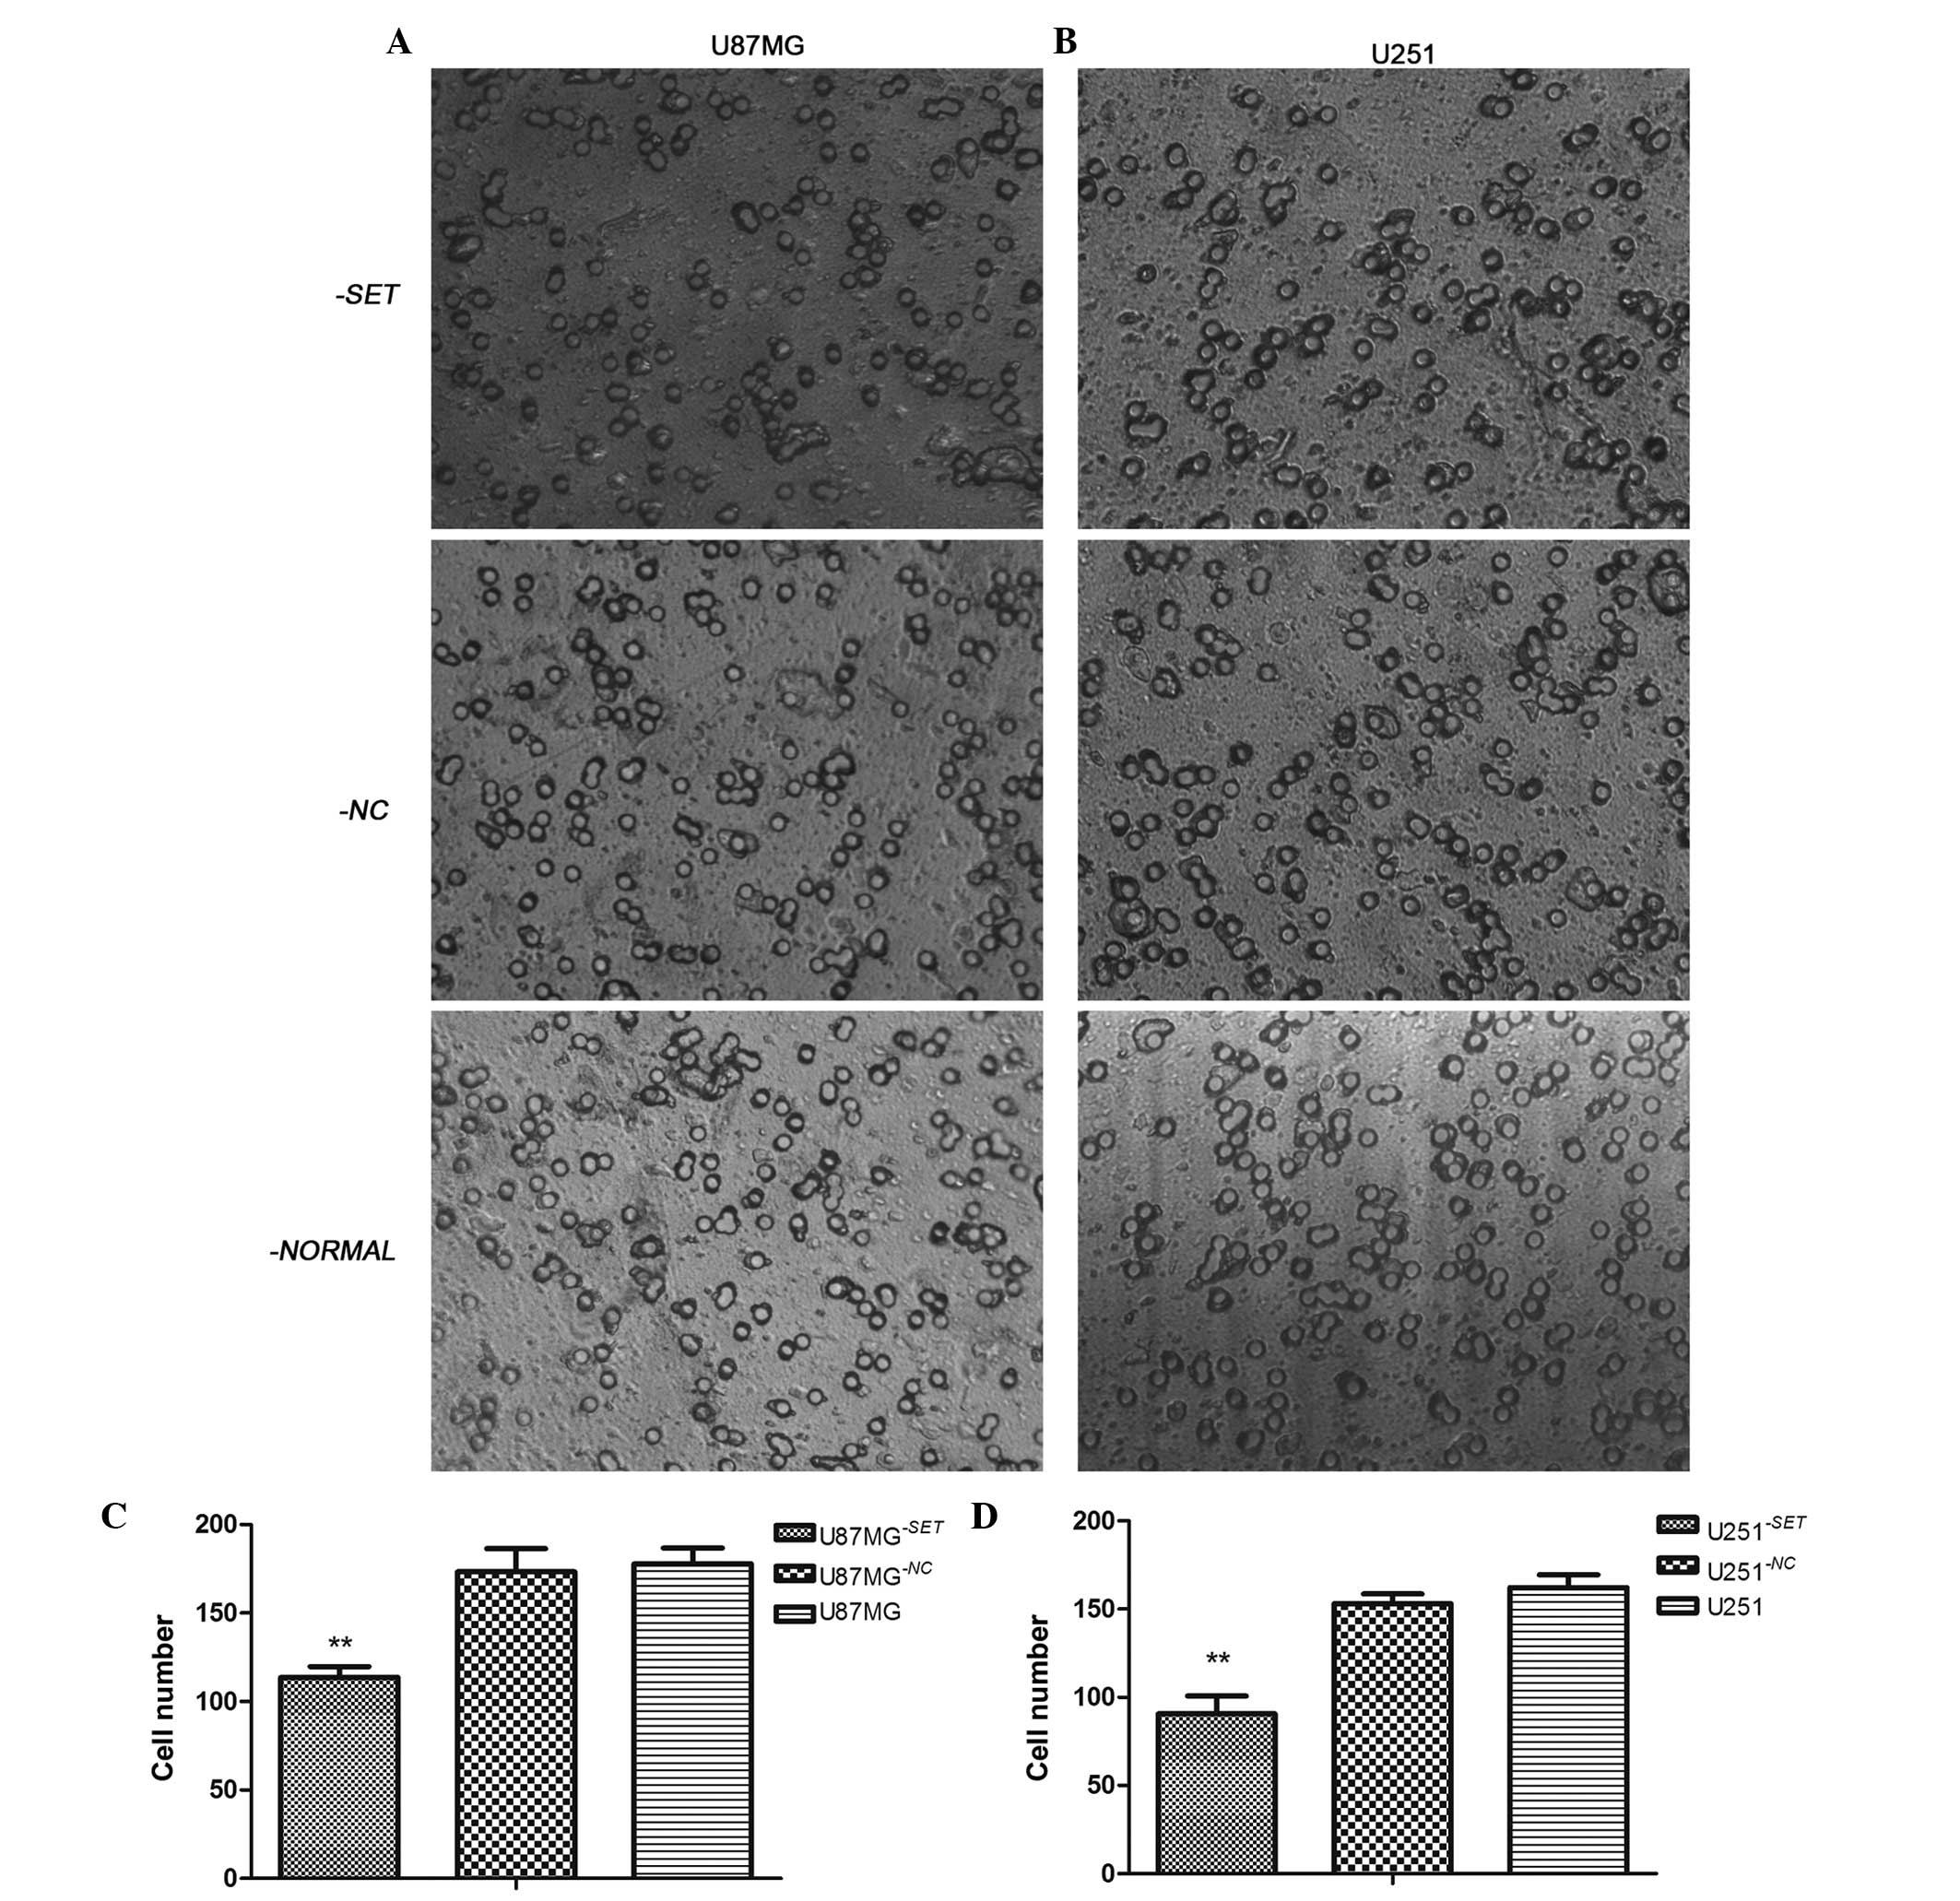
Following transfection for 24 h, the number of
U87MG−SET, U87MG−NC and U87MG cells that
migrated was 114±6, 170±8 and 177±9, respectively. Furthermore, the
number of migrated U251−SET, U251−NC and U251
cells was 79±2, 153±5 and 162±7, respectively, compared with the
blank group; and the number of cells in the experimental group was
significantly inhibited in U87MG−SET (35.60%, P=0.001)
and U251−SET (51.23%, P=0.001) cells. There was no
statistically significant difference between U87MG−NC
and U87MG cells (P=0.661) or between U251−NC and U251
cells (P=0.146) (Fig. 4).
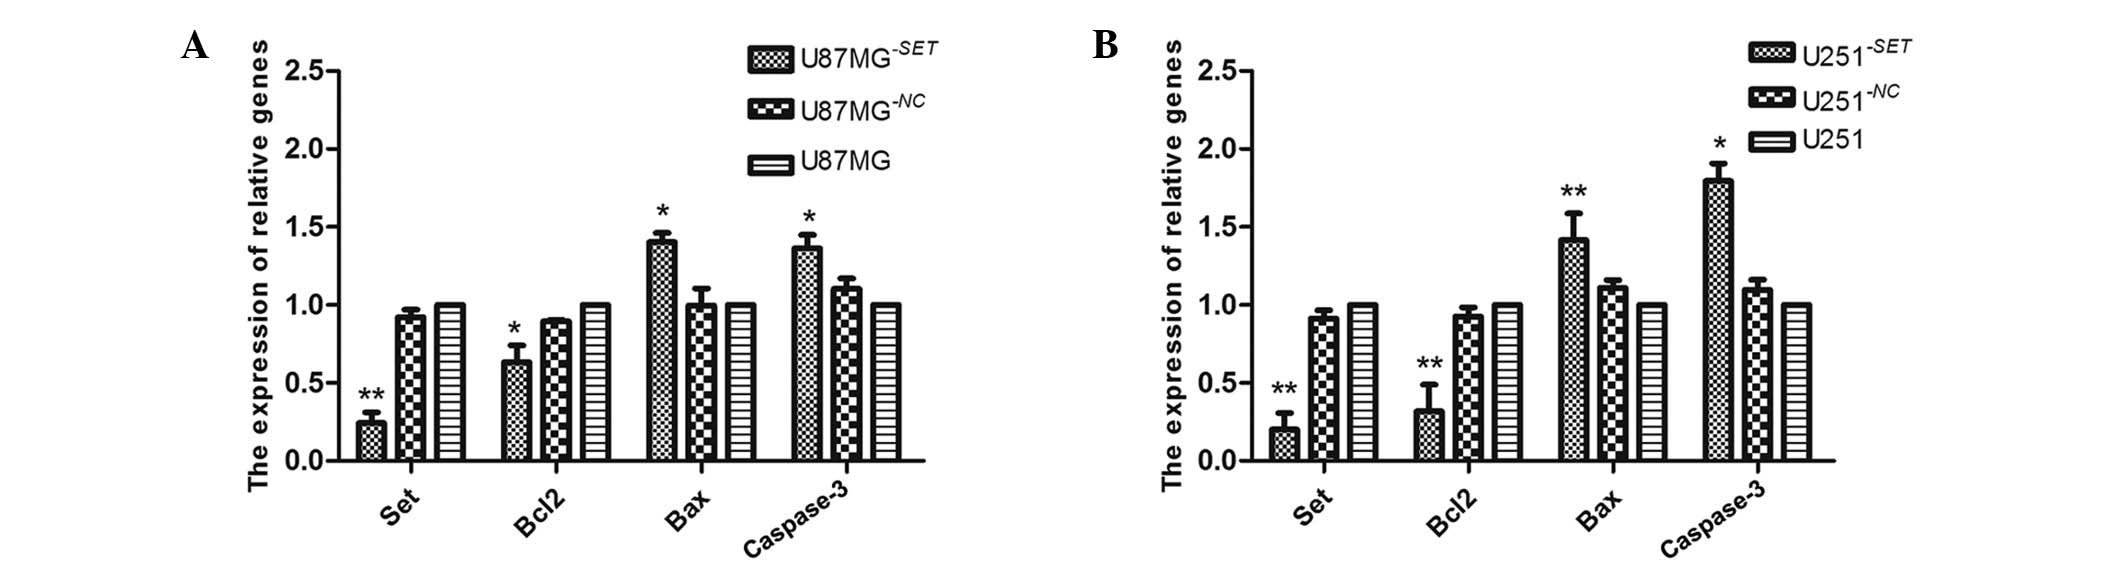
Bcl-2, Bax and caspase-3 mRNA
expression levels in U87MG−SET and U251−SET
cells
Following transfection for 48 h, SET gene expression
was inhibited in U87MG−SET (75.7±4.9%, P=0.006) and
U251−SET (79.92±8.77%, P<0.01) cells compared with
the blank groups, and in U87MG−NC cells (7.72±4.65%,
P=0.053) and U251−NC cells (8.61±5.1%, P=0.100).
Similarly, the Bcl-2 mRNA expression level was decreased in
U87MG−SET (63.31±10.81%, P=0.020) and
U251−SET (68.25±17.17%, P=0.001) cells. No statistically
significant difference was found in U87MG−NC cells
(10.59±1.18%, P=0.054) and U251−NC cells (7.36±5.83%,
P=0.160) cells compared with the blank groups. In contrast to
Bcl-2, the mRNA expression levels of Bax and caspase-3 increased in
U87MG−SET (40.40±5.65%, P=0.014 and 36.30±8.63%,
P=0.023, respectively), and U251−SET (41.58±17.13%,
P=0.005 and 79.54±11.15%, P=0.014, respectively); however, in the
U87MG−NC cells (0.36±10.79%, P=0.628; 10.85±6.60%,
P=0.059) and the U251−NC cells (10.30±6.60%, P=0.064;
9.69±6.40%, P=0.120), there was no statistical compared with the
blank group. (Fig. 5).
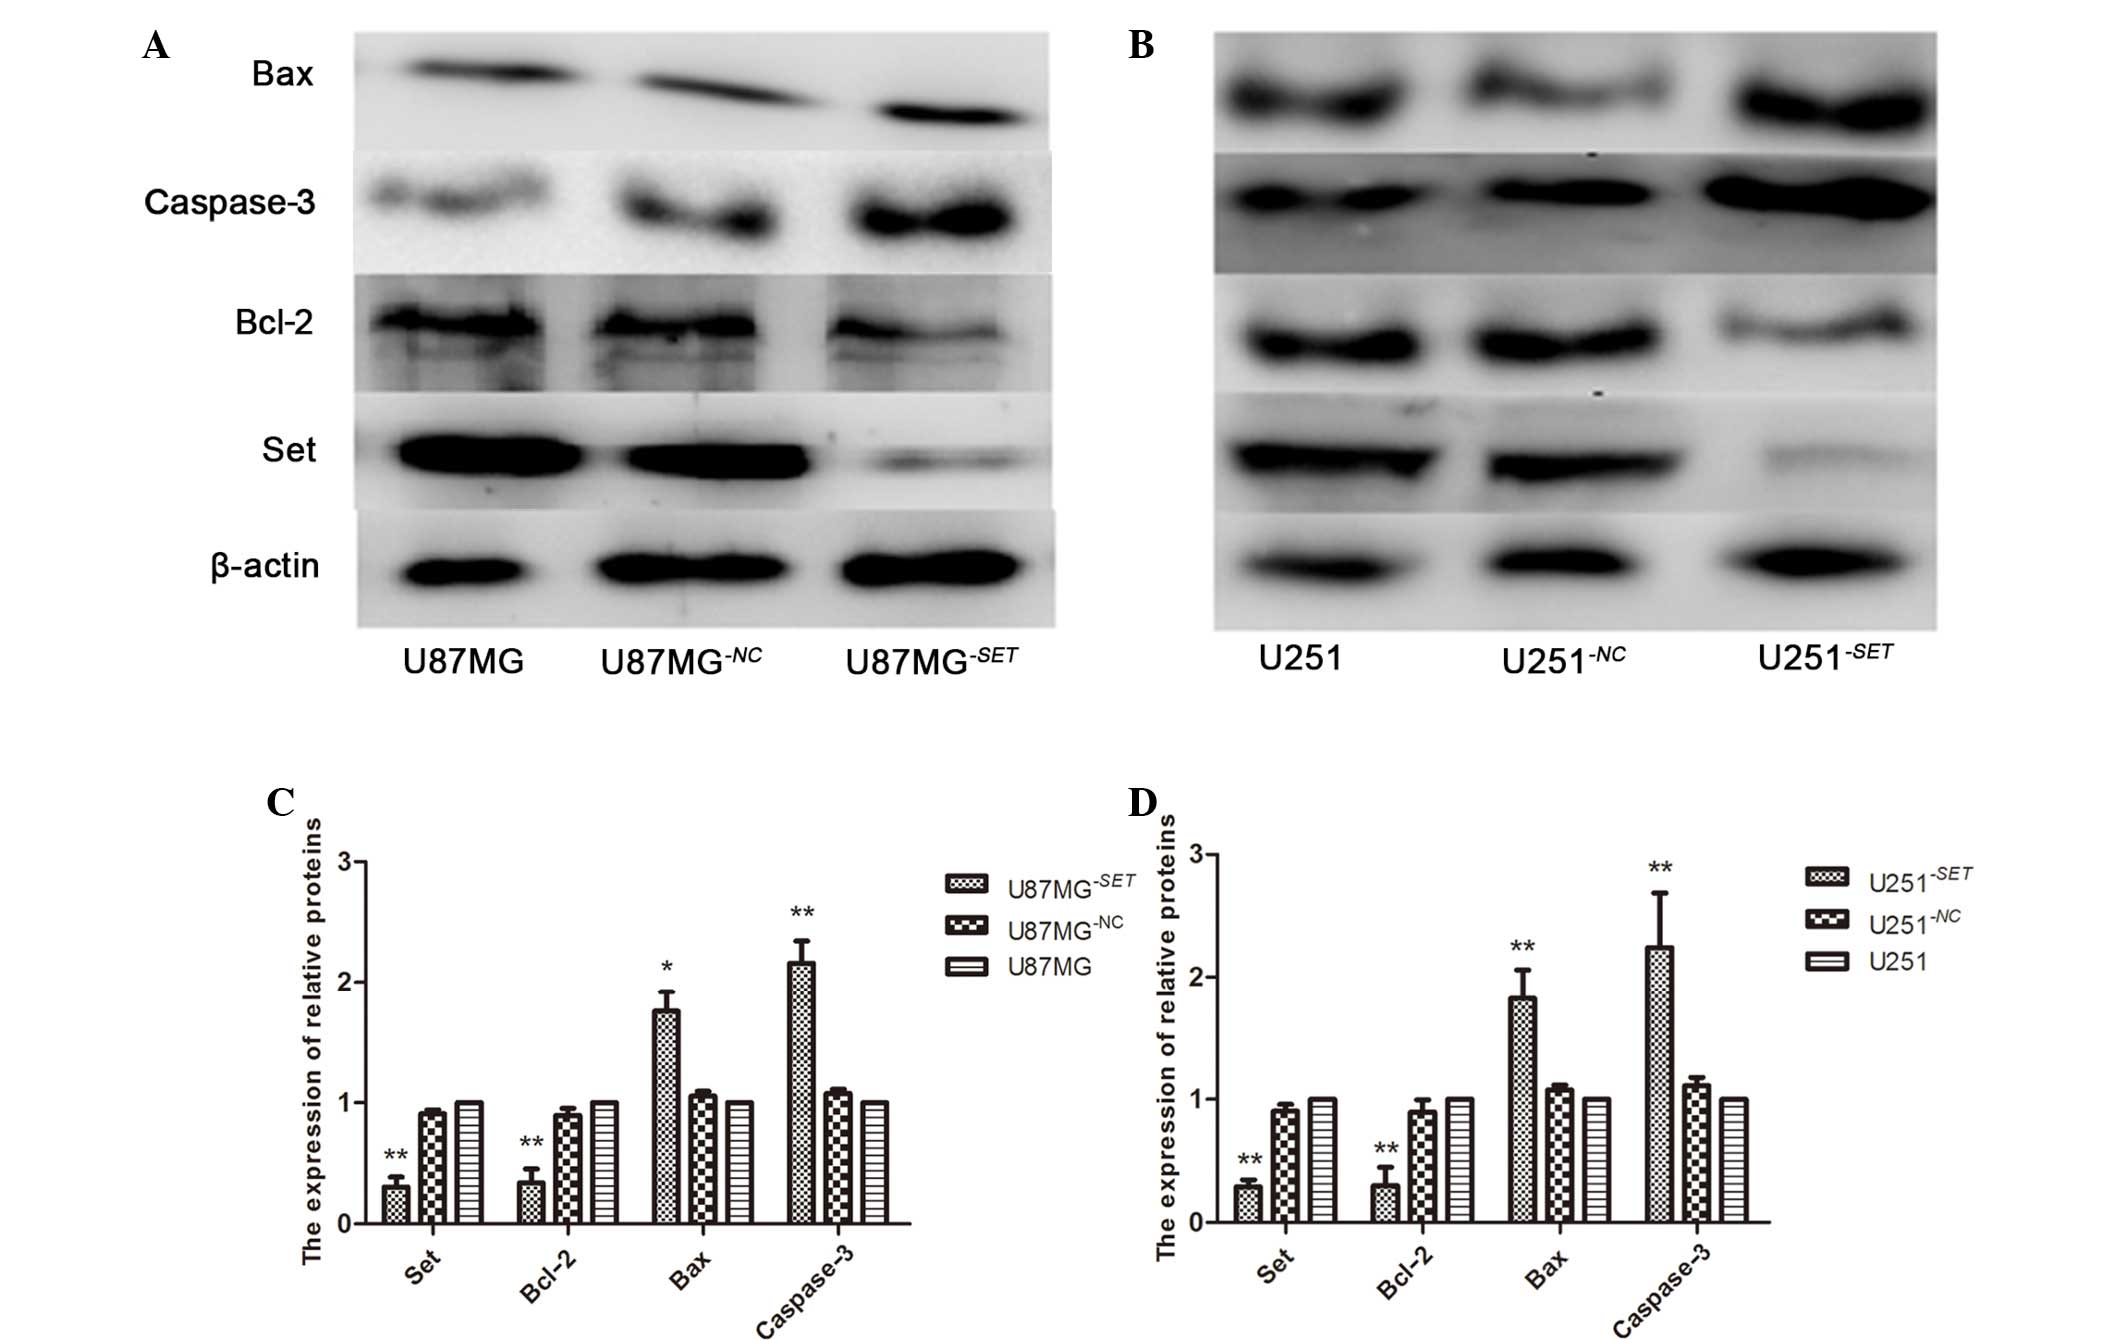
Bcl-2, Bax and caspase-3 protein
expression levels in U87MG−SET and U251−SET
cells
Following transfection for 48 h, SET protein was
inhibited in U87MG−SET (69.69±8.29%, P=0.005) and
U251−SET (70.52±5.67%, P<0.001) cells, while the
inhibition rate was 9.12±3.19% (P=0.054) and 9.51±5.31% (P=0.098)
in the U87MG−NC and U251−NC cells,
respectively, compared with the blank group. The protein expression
level of Bcl-2 was also inhibited in U87MG−SET
(66.03±11.33%, P=0.008) and U251−SET (61.09±6.41%,
P=0.001) cells, and in the U87MG−NC (10.32±10.04,
P=0.087) and the U251−NC (10.47±5.73, P=0.217) cells;
while Bax and caspase-3 were upregulated in U87MG−SET
(75.59±6.28%, P=0.015 and 115.76±15.18%, P<0.001, respectively)
and U251−SET (82.03±3.76%, P=0.004 and 124.01±8.91%,
P=0.008, respectively), and in U87MG−NC (7.67±3.88,
P=0.156; 11.07±6.80, P=0.063) and U251−NC (5.31±4.14,
P=0.076; 7.61±3.47, P=0.147) cells compared the control groups
(Fig. 6).
Discussion
In the present study, IHC determined that the
protein expression level of SET was significantly upregulated in
glioma tissues compared with normal brain tissues, indicating that
SET may have an effect on the occurrence of GBM. In addition, the
increased expression of SET was significantly correlated with a
variety of important clinicopathological parameters, including
gender, WHO grade II, III and IV classification, as well as
moderate and low differentiation. SET expression was higher in men
than that in women, suggesting that men may develop GBM more easily
compared with women. In agreement, a previous study showed that the
incidence rate of GBM is 1.6 times higher in men than in women
(2). Although there is no statistical
significance between SET expression and WHO grade I or
well-differentiated cancer, the high malignancy of GBM and high
expression of SET (Table IV)
indicate that the expression level of SET may be associated with
the malignant degree of cancer. In particular, SET expression may
be positively involved in the progression of glioma. The current
results suggest that the SET gene is associated with the
occurrence of GBM and may be a potential carcinogenic factor in
GBM. However, the detailed mechanism for SET upregulation in
glioma has yet to be clarified.
In the current study, the rate of cell proliferation
(Fig. 3) and migration (Fig. 4) significantly decreased after SET was
inhibited, while the rate of cell apoptosis (Fig. 2) was significantly upregulated. A
previous study revealed that SET is involved in regulating cell
apoptosis, the cell cycle and cell migration (14), indicating that it may be a potential
carcinogenic factor in GBM cells. Furthermore, the possible
mechanism of SET involves the promotion of cell proliferation and
migration, and the inhibition of GBM cell apoptosis.
In order to understand the detailed mechanism of SET
in the occurrence of GBM, the present study focused on the
correlation between SET, and Bcl-2, Bax and caspase-3 in U87MG and
U251 cell lines. Anti-apoptotic Bcl-2, pro-apoptotic Bax and
pro-apoptotic caspase-3 have important roles in the occurrence,
development and outcome of cancer. In particular, the relative
ratios of the pro- and anti-apoptotic BCL2 family protein levels
determine the sensitivity or resistance of cells to multiple
apoptotic stimuli (20). Generally,
there are two interconnected apoptotic pathways: Extrinsic and
intrinsic mechanisms mediated by death receptors on the cell
surface and mitochondria, respectively (21). This apoptotic mechanism is regulated
by several proteins that belong to the BCL2 family, including
anti-apoptotic (Bcl-2, Bcl-xl and Mcl-1) and pro-apoptotic (Bax,
Bak, Bcl-xs, Bad and Bid) mediators that differentially effect
mitochondrial homeostasis and cytochrome c release (22). Bcl-2, which belongs to the BCL2
family, was initially identified in B cell malignancies and encodes
an integral outer mitochondrial membrane protein that regulates the
intrinsic mitochondrial apoptosis pathway; thus, Bcl-2 serves as an
anti-apoptosis gene (23). Bax, a
pro-apoptotic member of the Bcl-2 family of proteins, has the
ability to form transmembrane pores large enough to allow
cytochrome c release, as well as the ability activate the
mitochondrial permeability transition pore (24). Caspases, a family of cysteinyl
aspartate-specific proteases, are best known as executioners of
apoptotic cell death, and their activation are considered to be
committed to inducing cell death (25); in particular, caspase-3, as one member
of cysteinyl aspartate-specific proteases family, is known as a
central effector of apoptosis (26).
Furthermore, mitochondria have an important role in the intrinsic
pathway of apoptosis, which is regulated by the Bcl-2 family of
proteins through the pro-apoptotic protein BAX and the
anti-apoptotic protein Bcl-2. Mitochondria are involved in the
production of reactive oxygen species production, the
downregulation of Bcl-2, the upregulation of Bax, the release of
cell death protein cytochrome c, and caspase-3 activation in
various cell lines (27). In the
present study, following inhibition of SET expression in two
glioblastoma cell lines (U87MG and U251), the mRNA and protein
expression level of SET were both significantly downregulated in
U87MG−SET and U251−SET cells. Subsequently,
mRNA and protein expression levels of Bcl-2, Bax and caspase-3 were
detected in these two cell lines, and it was found that the
expression of Bcl-2 significantly decreased, while the expression
of Bax and caspase-3 significantly increased compared with the two
control groups, resulting in a lower Bcl-2/Bax ratio at the mRNA
(Fig. 5) and protein (Fig. 6) expression level. Thus, the current
data suggests that SET may regulate cell proliferation and
apoptosis by upregulating Bcl-2 gene expression and
downregulating Bax and caspase-3 genes, resulting in
the development of cancer.
In conclusion, the current data suggests that SET
may be a potential carcinogenic factor in GBM, and may regulate
cell proliferation and apoptosis by upregulating Bcl-2 gene
expression, and downregulating Bax and caspase-3
expression. However, its detailed mechanism remains unknown.
Previous studies have indicated that SET may be a downstream
molecule that could be activated by the PI3K/Akt/mTOR signaling
pathway in colorectal adenocarcinoma (28). Further research is required to
determine whether SET regulates the expression of Bcl-2, Bax and
caspase-3 through a series of complex regulatory mechanisms in this
signaling pathway, resulting in the occurrence of GBM.
Acknowledgements
The current study was supported by a grant from the
Chengdu Science and Technology Board (for research into the
expression and mechanism of the SET gene in glioma).
References
|
1
|
Wu CX, Lin GS, Lin ZX, Zhang JD, Liu SY
and Zhou CF: Peritumoral edema shown by MRI predicts poor clinical
outcome in glioblastoma. World J Surg Oncol. 13:972015. View Article : Google Scholar : PubMed/NCBI
|
|
2
|
Thakkar JP, Dolecek TA, Horbinski C,
Ostrom QT, Lightner DD, BarnholtzSloan JS and Villano JL:
Epidemiologic and molecular prognostic review of glioblastoma.
Cancer Epidemiol Biomarkers Prev. 23:1985–1996. 2014. View Article : Google Scholar : PubMed/NCBI
|
|
3
|
Zhang L, Wang H, Ding K and Xu J: FTY720
induces autophagy-related apoptosis and necroptosis in human
glioblastoma cells. Toxicol Lett. 236:43–59. 2015. View Article : Google Scholar : PubMed/NCBI
|
|
4
|
Koo S, Martin G and Toussaint LG:
MicroRNA-145 promotes the phenotype of human glioblastoma cells
selected for invasion. Anticancer Res. 35:3209–3215.
2015.PubMed/NCBI
|
|
5
|
Chakrabarti M and Ray SK: Direct
transfection of miR-137 mimics is more effective than DNA
demethylation of miR-137 promoter to augment anti-tumor mechanisms
of delphinidin in human glioblastoma U87MG and LN18 cells. Gene.
573:141–152. 2015. View Article : Google Scholar : PubMed/NCBI
|
|
6
|
Wang G, Wang J, Zhao H, Wang J and Tony To
SS: The role of Myc and let-7a in glioblastoma, glucose metabolism
and response to therapy. Arch Biochem Biophys. 580:84–92. 2015.
View Article : Google Scholar : PubMed/NCBI
|
|
7
|
Cimino PJ, Bredemeyer A, Abel HJ and
Duncavage EJ: A wide spectrum of EGFR mutations in glioblastoma is
detected by a single clinical oncology targeted next-generation
sequencing panel. Exp Mol Pathol. 98:568–573. 2015. View Article : Google Scholar : PubMed/NCBI
|
|
8
|
Yan J, Kong LY, Hu J, Gabrusiewicz K,
Dibra D, Xia X, Heimberger AB and Li S: FGL2 as a multimodality
regulator of Tumor-mediated immune suppression and therapeutic
target in gliomas. J Natl Cancer Inst. 107:pii.djv1372015.
View Article : Google Scholar
|
|
9
|
Karetsou Z, Emmanouilidou A, Sanidas I,
Liokatis S, Nikolakaki E, Politou AS and Papamarcaki T:
Identification of distinct SET/TAF-Ibeta domains required for core
histone binding and quantitative characterisation of the
interaction. BMC Biochem. 10:102009. View Article : Google Scholar : PubMed/NCBI
|
|
10
|
Irie A, Harada K, Araki N and Nishimura Y:
Phosphorylation of SET protein at Ser171 by protein kinase D2
diminishes its inhibitory effect on protein phosphatase 2A. PLoS
One. 7:e512422012. View Article : Google Scholar : PubMed/NCBI
|
|
11
|
Li M, Makkinje A and Damuni Z: The myeloid
leukemia-associated protein SET Is a potent inhibitor of protein
phosphatase 2A. J Biol Chem. 271:11059–11062. 1996. View Article : Google Scholar : PubMed/NCBI
|
|
12
|
Almeida LO, Garcia CB, MatosSilva FA,
Curti C and Leopoldino AM: Accumulated SET protein up-regulates and
interacts with hnRNPK, increasing its binding to nucleic acids, the
Bcl-xS repression, and cellular proliferation. Biochem Biophys Res
Commun. 445:196–202. 2014. View Article : Google Scholar : PubMed/NCBI
|
|
13
|
Xu Z, Yang W, Shi N, Gao Y, Teng M and Niu
L: Cloning, purification, crystallization and preliminary X-ray
crystallographic analysis of SET/TAF-Iß δN from Homo sapiens. Acta
Crystallogr Sect F Struct Biol Cryst Commun. 66:926–928. 2010.
View Article : Google Scholar : PubMed/NCBI
|
|
14
|
Lam BD, Anthony EC and Hordijk PL:
Cytoplasmic targeting of the proto-oncogene SET promotes cell
spreading and migration. FEBS Lett. 587:111–119. 2013. View Article : Google Scholar : PubMed/NCBI
|
|
15
|
Cristóbal I, Garcia-Orti L, Cirauqui C,
Cortes-Lavaud X, García-Sánchez MA, Calasanz MJ and Odero MD:
Overexpression of SET is a recurrent event associated with poor
outcome and contributes to protein phosphatase 2A inhibition in
acute myeloid leukemia. Haematologica. 97:543–550. 2012. View Article : Google Scholar : PubMed/NCBI
|
|
16
|
Mukhopadhyay A, Tabanor K, Chaguturu R and
Aldrich JV: Targeting inhibitor 2 of protein phosphatase 2A as a
therapeutic strategy for prostate cancer treatment. Cancer Biol
Ther. 14:962–972. 2013. View Article : Google Scholar : PubMed/NCBI
|
|
17
|
Louis DN, Ohgaki H, Wiestler OD, Cavenee
WK, Burger PC, Jouvet A, Scheithauer BW and Kleihues P: The 2007
WHO classification of tumours of the central nervous system. Acta
Neuropathol. 114:97–109. 2007. View Article : Google Scholar : PubMed/NCBI
|
|
18
|
Gonzales MF: Grading of gliomas. J Clin
Neurosci. 4:16–18. 1997. View Article : Google Scholar : PubMed/NCBI
|
|
19
|
Livak KJ and Schmittgen TD: Analysis of
relative gene expression data using real-time quantitative PCR and
the 2(−Delta Delta C(T)) method. Methods. 25:402–408. 2001.
View Article : Google Scholar : PubMed/NCBI
|
|
20
|
Kontos CK, Fendri A, Khabir A,
MokdadGargouri R and Scorilas A: Quantitative expression analysis
and prognostic significance of the BCL2-associated X gene in
nasopharyngeal carcinoma: A retrospective cohort study. BMC Cancer.
13:2932013. View Article : Google Scholar : PubMed/NCBI
|
|
21
|
Manoochehri M, Karbasi A, Bandehpour M and
Kazemi B: Down-regulation of BAX gene during carcinogenesis and
acquisition of resistance to 5-FU in colorectal cancer. Pathol
Oncol Res. 20:301–307. 2014. View Article : Google Scholar : PubMed/NCBI
|
|
22
|
Croci DO, Cogno IS, Vittar NB, Salvatierra
E, Trajtenberg F, Podhajcer OL, Osinaga E, Rabinovich GA and
Rivarola VA: Silencing survivin gene expression promotes apoptosis
of human breast cancer cells through a caspase-independent pathway.
J Cell Biochem. 105:381–390. 2008. View Article : Google Scholar : PubMed/NCBI
|
|
23
|
Choi JE, Kang SH, Lee SJ and Bae YK:
Prognostic significance of Bcl-2 expression in non-basal
triple-negative breast cancer patients treated with
anthracycline-based chemotherapy. Tumour Biol. 35:12255–12263.
2014. View Article : Google Scholar : PubMed/NCBI
|
|
24
|
Gómez-Crisóstomo NP, López-Marure R,
Zapata E, Zazueta C and Martinez-Abundis E: Bax induces cytochrome
c release by multiple mechanisms in mitochondria from MCF7 cells. J
Bioenerg Biomembr. 45:441–448. 2013. View Article : Google Scholar : PubMed/NCBI
|
|
25
|
Kavanagh E, Rodhe J, Burguillos MA, Venero
JL and Joseph B: Regulation of caspase-3 processing by cIAP2
controls the switch between pro-inflammatory activation and cell
death in microglia. Cell Death Dis. 5:e15652014. View Article : Google Scholar : PubMed/NCBI
|
|
26
|
Liu X, He Y, Li F, Huang Q, Kato TA, Hall
RP and Li CY: caspase-3 promotes genetic instability and
carcinogenesis. Mol Cell. 58:284–296. 2015. View Article : Google Scholar : PubMed/NCBI
|
|
27
|
Amar SK, Goyal S, Mujtaba SF, Dwivedi A,
Kushwaha HN, Verma A, Chopra D, Chaturvedi RK and Ray RS: Role of
type I & type II reactions in DNA damage and activation of
caspase 3 via mitochondrial pathway induced by photosensitized
benzophenone. Toxicol Lett. 235:84–95. 2015. View Article : Google Scholar : PubMed/NCBI
|
|
28
|
Wen X, Zhu J, Dong L and Chen Y: The role
of c2orf68 and PI3K/Akt/mTOR pathway in human colorectal cancer.
Med Oncol. 31:922014. View Article : Google Scholar : PubMed/NCBI
|