Introduction
Hepatocellular carcinoma (HCC) is the fifth most
common cancer worldwide and the third leading cause of
cancer-associated mortality (1),
which explains the importance of identifying novel early diagnostic
markers and therapeutic targets (2).
HCC primarily develops from cirrhosis caused by chronic infection
with hepatitis B virus or hepatitis C virus (HCV), alcoholic
injury, and, to a lesser extent, from genetically determined
disorders (3). However, the
heterogeneity of HCC presents unique challenges in identifying
biomarkers and exploring molecular pathogenesis in this disease
(4).
Identifying genes that are differentially expressed
(DE), exhibit similar expression profiles to known disease genes,
are ‘central’ or ‘reachable’ in disease molecular networks, or
display disease associations according to the literature is the
main method to evaluate biomarkers (5). In addition, a crucial distinguishing
factor of cancer genes is their involvement in core mechanisms
responsible for genome stability and cell proliferation (such as
DNA damage repair and cell cycle), and the fact that these genes
function as highly synergetic or coordinated groups (6). Therefore, critical to implicating genes
in cancer is the identification of core modules, including pathways
and complexes, that are dysregulated in cancer.
Beyond straightforward scoring genes in a gene
regulatory network, it is crucial to study the behavior of modules
across specific conditions in a controlled manner in order to
understand the disease mechanisms and to identify biomarkers
(7). For example, Zhang et al
(8) have identified tightly connected
gene co-expression sub-networks across 30 cancer networks in
various cell lines, and have tracked aberrant modules as frequent
sub-networks appearing across these cancers. However, studying
multiple cancers simultaneously makes it challenging to discern
clearly the intricate underlying mechanisms.
Furthermore, it is important to effectively
integrate omics data into such an analysis. For example, Magger
et al (9) combined
protein-protein interaction (PPI) and gene expression data to
construct tissue-specific PPI networks for 60 tissues, and used
them to prioritize disease genes. A few significant genes may not
be identifiable through their own behavior, but their changes are
quantifiable when considered in conjunction with other genes (which
is known as modules) (10).
Therefore, a systematic tracking of gene and module behavior across
specific conditions in a controlled manner is required. Besides,
since a number of human genes have not yet been assigned to
definitive pathways, scoring pathways based on module analysis has
become a more reliable analyzing approach compared to individual
gene analysis.
Therefore, the present study systematically tracked
the disrupted modules of re-weighted PPI networks to identify
significant DE genes and pathways between normal controls and HCC
patients, in order to reveal potential biomarkers for HCC. To
achieve this, normal and HCC PPI networks were firstly inferred
based on Pearson correlation coefficient (PCC). Next the modules in
the PPI networks were explored based on a clique-merging algorithm,
and disrupted modules were identified by matching normal and HCC
modules. Subsequently, the gene compositions of the disrupted
modules were studied and compared with DE genes, and pathway
enrichment analysis was performed for these genes. Finally,
dysregulated genes of HCC were validated utilizing reverse
transcription-quantitative polymerase chain reaction (RT-qPCR)
analysis.
Materials and methods
Inferring normal and HCC PPI
networks
Human PPI network construction
A dataset of literature-curated human PPIs from the
Search Tool for the Retrieval of Interacting Genes/Proteins
(STRING; string-db.org/), comprising 16,730 genes
and 1,048,576 interactions, was utilized (11). For STRING analysis, self-loops and
proteins without expression value were removed. The remaining
largest connected component with score >0.75 was kept as the
selected PPI network, which consisting of 9,273 genes and 58,617
interactions.
Gene expression dataset and dataset
preprocess
The microarray expression profiles of E-GEOD-14520
(12,13) from the ArrayExpress database
(www.ebi.ac.uk/arrayexpress/) were
selected for the study. In E-GEOD-14520, there were a total of 488
samples, which were processed on two platformed. To eliminate the
batch effects, only samples processed on the GeneChip®
Human Genome U133A 2.0 Array (Affymetrix, Inc., Santa Clara, CA,
USA), were recruited in the present study, which consisted of 123
samples. The gene expression profiles were preprocessed with
standard methods, including background correction via ‘robust
multiarray average (rma)’ (14),
‘quantiles’ (15), ‘mas’ (16) and ‘medianpolish’ (14), and were subsequently screened with a
feature filter method.
Briefly, in order to eliminate the influence of
nonspecific hybridization, background correction was applied by the
‘rma’ method (14). The observed
perfect match (PM) probes were modeled as the sum of a normal noise
component N (normal with mean µ and variance σ2)
and an exponential signal component S (exponential with mean
α). To avoid negative values, the normal was truncated at zero. An
adjustment was performed based on the observed intensity O as
follows:
E(s|O=o)=a+bϕ(ab)–ϕ(o–ab)Φ(ab)+Φ(o–ab)–1
where a=s-µ-σ2α and
b=σ. Of note, Ø and Φ were the standard normal distribution
density and distribution function, respectively. Mismatch (MM)
probe intensities were corrected by ‘mas’.
Normalization was performed through a
quantiles-based algorithm (15).
Specifically, the transformation
x'i=F-1[G(xi)]was used, where
G was estimated by the empirical distribution of each array
and F was estimated using the empirical distribution of the
averaged sample quantiles. Using the ‘mas’ method to conduct PM/MM
correction (16), an ideal mismatch
was subtracted from PM. The ideal MM would always be less than the
corresponding PM, and thus, it could be safely subtracted without
the risk of achieving negative values.
The summarization method was ‘medianpolish’
(14). A multichip linear model was
fit to the data from each probe set. In particular, for a probe set
k with I=1, …, Ik probes and data from
j=1, …, J arrays, the following model was fitted:
log2(PMijk)=αik+βjk+εijk
where αi was a probe effect and βj was
the log2 expression value.
Next, the data were screened by the feature filter
method of the genefilter package version 1.54.2 (bioconductor.org/packages/release/bioc/html/genefilter.html).
The gene expression value for each gene was obtained, and the
number of genes with multiple probes was determined to be
12,493.
Re-weighting gene interactions by PCC
In the present study, PCC was selected to re-weight
gene interactions in HCC and normal networks. PCC was a measure of
the correlation between two variables, assigning a value between −1
and +1 inclusive, and evaluated the probability of two co-expressed
gene pairs (17). The PCC of a pair
of genes (X and Y), which encoded the corresponding paired proteins
(u and v) interacting in the PPI network, was defined
as:
PCC(X,Y)=1s–1∑i=1s(g(X,i)–g¯(X)σ(X))·(g(Y,i)–g¯(Y)σ(Y))
where s was the number of samples of the gene
expression data; g(X,i) or
g(Y,i) was the expression level of the gene
X or Y in the sample i under a specific
condition; ḡ(X) or ḡ(Y) represented the mean expression level of
gene X or Y, and s(X) or s(Y)
represented the standard deviation of the expression level of the
gene X or Y.
If the PCC for X and Y had a positive
value, there was a positive linear correlation between u and
v. In addition, the PCC of each gene-gene interaction was
defined as the weight value of the interaction. By re-weighting the
interactions in the generic PPI network of normal and HCC samples,
two conditional PPI networks were inferred.
Identifying modules from the PPI networks
The present study applied a clique-merging algorithm
to identify modules of HCC and normal controls (18,19).
Finding all the maximal cliques from the weighted PPI and merging
highly overlapped cliques were the two steps in the algorithm. The
score of a clique C was defined as its weighted interaction
density dW(C) (20):
dW(C)=∑u∈C,v∈Cw(u,v)|C|·(|C|–1)
where w(u,v) was the weight of
the interaction between u and v. The cliques were
ranked according to their scores, and the maximal cliques were
obtained. A depth-first algorithm was utilized to enumerate all
maximal cliques, and non-maximal cliques were effectively
removed.
Next, a set of cliques {C1, C2, …,
Ck} was ranked in descending order of their scores, and
their ordered list was assessed by repeatedly merging highly
overlapping cliques to constructed modules. For a clique Ci,
it was estimated whether Cj (j>i) existed, such
that the overlap |Ci∩Cj|/|Cj| was ≥t.
If Cj existed, weighted inter-connectivity Iw was
used to determine whether Cj should be removed or merged
with Ci. If Iw(Ci, Cj) was ≥m,
Cj was merged with Ci; otherwise, it was
removed. In this setting, t=0.5 and m=0.25 were
predefined thresholds for merging (6). The Iw between the non-overlapping
genes of Ci and Cj was calculated as follows:
Iw(Ci,Cj)=∑u∈(Ci–Cj)∑v∈Cjw(u,v)|Ci–Cj|·|Cj|·∑u∈(Cj–Cj)∑v∈Ciw(u,v)|Cj–Ci|·|Ci|
Comparing modules between HCC and normal
control
To identify altered modules, normal and HCC modules
were matched by setting a high tJ, which ensured that the
module pairs either had the same gene composition or had lost or
gained only a few genes. The module sets of normal and HCC were
denoted as S={S1, S2, …, Sm} and
T={T1, T2, …, Tn}, respectively. The
module correlation density dc(Si) or dc(Ti) for each Si ε
S or Ti ε T was calculated as follows:
dc(Si)=∑X,Y∈SiPCC((X,Y),M)|Si|·(|Si|–1)
The disrupted modules γ(S,T) were
identified based on a maximum weight bipartite matching (21). The matching worked in three steps. For
the first step, a similarity graph M=(VM,EM)
was built, where VM={S∩T},
EM=∩{Si,Tj):J(Si,Tj)≥tJ
and ∆C(Si,Tj)≥δ, whereby
J(Si,Tj)=|Si∩Tj|/|SiUTj|
weighted every edge (Si,Tj) and was the Jaccard
similarity, while ∆C(Si,Tj) = |dc(Si)-dc(Ti)|
was the differential correlation density between Si and
Tj, being tJ and δ thresholds with 2/3 and 0.1,
respectively (6). In the second step,
the disrupted module pairs were identified and ordered in
descending sequence of their differential density ∆C. In the
last step, genes involved in HCC were inferred as
Γ={g:g ε Si∩Tj, (Si,Tj) ε
γ (S,T)} ranked in non-increasing order of
∆C(Si,Tj).
Pathway enrichment analysis
The Database for Annotation, Visualization and
Integrated Discovery (DAVID; david.ncifcrf.gov/) for Kyoto Encyclopedia of Genes
and Genomes (KEGG; www.genome.jp/kegg/) pathway enrichment analysis was
evaluated to further investigate the biological functions of the
genes in the modules that were altered between the normal controls
and the HCC patients (22). KEGG
pathways with P<0.001 were selected based on the Expression
Analysis Systematic Explorer (EASE; david.ncifcrf.gov/ease/ease.jsp) test applied in
DAVID. EASE analysis of the regulated genes indicated molecular
functions and biological processes unique to each category
(23). The EASE score was used to
detected the significant categories. In both the functional and
pathway enrichment analysis, the threshold of minimum number of
genes for the corresponding term >2 was considered significant
for a category:
P=(a+ba)(c+dc)(na+c)
where n=a'+b+c+d
was the number of background genes; a' was the gene number
of one gene set in the gene lists; a'+b was the
number of genes in the gene list including ≥1 gene set;
a'+c was the gene number of one gene list in the
background genes; and a' was replaced with
a=a'−1 in EASE.
Identification of DE genes
The Linear Models for Microarray Data (www.bioconductor.org/packages/release/bioc/html/limma.html)
method was used to detect DE genes between HCC patients and normal
controls based on 12,493 filtered genes. The P-values for all genes
were converted into the form of -log10 upon being manipulated with
t and F tests. Linear fit, empirical Bayes statistics
and false discovery rate correction were applied to the data by
using the Fit function (bioconductor.org/packages/release/bioc/manuals/limma/man/limma.pdf)
(24). DE genes were identified for
further research with a threshold of P<0.05 and |log2
fold-change|>2.
RT-qPCR analysis
RT-qPCR was used to validate the common genes of DE
genes and dysregulated genes, which was explored by the gene
compositions of modules and DE genes. Total RNA was prepared from
24 HCC patients using TRIzol reagent (Invitrogen; Thermo Fisher
Scientific, Inc., Waltham, MA, USA). Complementary DNA was
synthesized using SuperScript® Reverse Transcriptase and
oligo(dT) primers (Invitrogen; Thermo Fisher Scientific, Inc.). The
data were normalized to housekeeping gene β-actin, which was used
as an internal reference, and relative gene expression levels were
determined using the ΔΔCq method (25). A total of 8 common genes [including
cytochrome P450 (CYP)2E1, CYP2C9, glutathione
S-transferase Z1, CYP3A4, CYP1A2,
phospholipase C beta 1 (PLCB1), CYP2C8 and
CYP2B6] were analyzed, whose primer sequences are listed in
Table I.
 | Table I.Primer sequences for the genes
validated by reverse transcription-quantitative polymerase chain
reaction. |
Table I.
Primer sequences for the genes
validated by reverse transcription-quantitative polymerase chain
reaction.
|
| Primers
(5′-3′) |
|
|---|
|
|
|
|
|---|
| Genes | Forward | Reverse | Size, bp |
|---|
| PLCB1 |
AGTCCGCCAAAAAGGACAGT |
TACAAGAAAGTTGGGCACAGAG | 763 |
| CYP2C8 |
TCTTTCACCAATTTCTCAAAAGTCT |
CCAAAATTCCGCAAGGTTGTGA | 248 |
| CYP2B6 |
AACCAGACGCCTTCAATCCT |
GGGGAGTCAGAGCCATTGTC | 345 |
| CYP3A43 |
CAAGGGATGGCACCGTAAGT |
CCCCACGCCAACAGTGATTA | 586 |
| CYP2E1 |
CTCCTCGTCATATCCATCTG |
GCAGCCAATCAGAAATGTGG | 473 |
| GMNN |
AAAAACGGAGAAAGGCGCTG |
GTACAAGAAAGTTGGGCATATACA | 335 |
| β-actin |
AAGTACTCCGTGTGGATCGG |
TCAAGTTGGGGGACAAAAAG | 615 |
For PCR amplification, each 4 µl reaction contained
10 µl of 10X PCR Buffer I (Invitrogen; Thermo Fisher Scientific,
Inc.), 1 µl of Taq DNA Polymerase (Invitrogen; Thermo Fisher
Scientific, Inc.), 3 µl of each forward and reverse primer, and 8
µl of deoxynucleotides. The conditions were as follows: 2 min at
94°C for pre-denaturation, followed by 35 cycles of 10 sec at 94°C,
15 sec at 59°C and 30 sec at 72°C, and a final 7-min extension at
72°C. In total, 10 replicates of the assay within or between runs
were performed to assess its reproducibility. Gene expression was
examined with an iCycler iQ™ Real Time PCR Detection System
(Bio-Rad Laboratories, Inc., Hercules, CA, USA) using an iQ™ SYBR
Green PCR kit (Bio-Rad Laboratories, Inc.).
Results
Analyzing disruptions in HCC PPI
networks
A total of DE 12,493 genes between normal and HCC
individuals were obtained after preprocessing the gene expression
profiles. The intersections between these gene interactions and the
STRING PPI network were investigated, and PPI networks of normal
and HCC individuals were identified. These networks displayed equal
numbers of nodes (7,264) and interactions (45,286), but the
interaction score or weight between two genes was different.
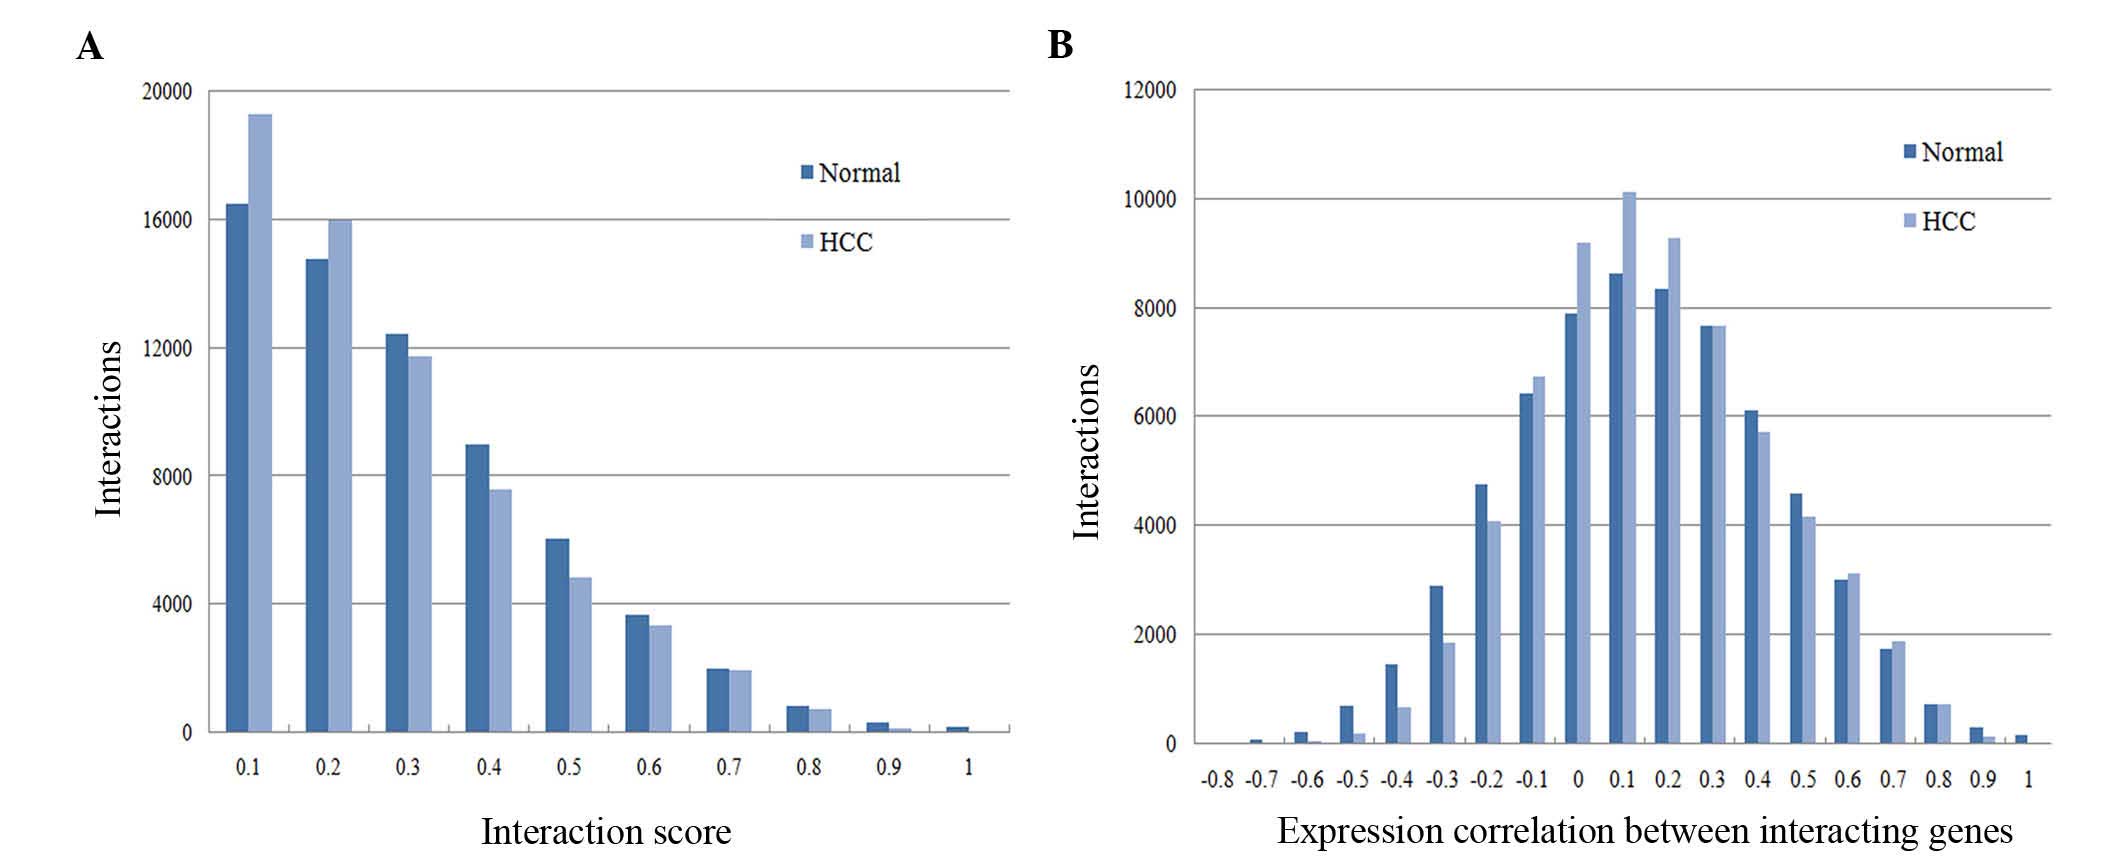
Fig. 1 reveals that there were
significant differences in the score distribution of the two
networks (Fig. 1A), while the overall
distribution of expression correlations between interacting genes
of normal and HCC PPI networks was similar (Fig. 1B). When the correlation ranged from 0
to 0.1, the number of interactions reached its maximum value and
the interaction numbers of HCC were more than that of normal
controls.
Analyzing disruptions in HCC
modules
In the present study, a clique-merging algorithm
was selected to evaluate disrupted modules between normal and HCC
networks. A comparative analysis between normal S and HCC
T modules was performed to understand these disruptions at
the module level. As indicated in Table
II, 1,810 and 785 modules from normal and HCC PPI networks were
explored, respectively. The average module size (gene number) was
20.175 for normal and 28.851 for HCC. The maximal module
correlation density among HCC modules was larger than that of
normal modules, and the average correlation density of HCC modules
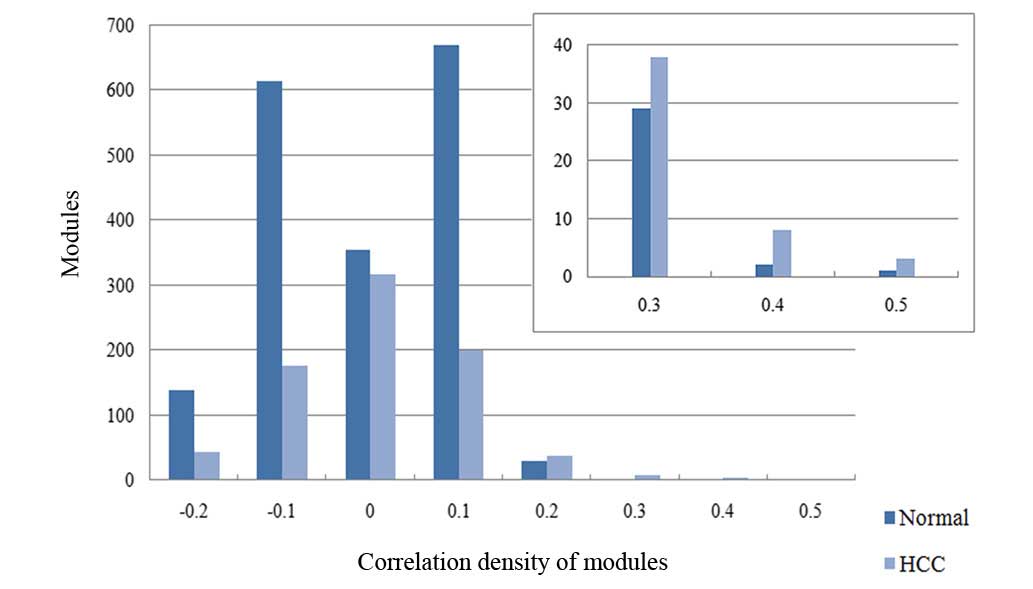
was also larger than that of normal modules. Furthermore, the
distributions of correlation density in normal and HCC modules were
studied (Fig. 2). There were
significant differences between normal and HCC module distribution
when the correlation density ranged from −0.2 to 0.1, and the
amount of normal modules was higher than that of HCC in this range.
When the correlation density was >0.2, the number of HCC modules
was higher than that of normal modules. In addition, Table II also indicated an overall decrease
in correlation in the HCC modules. Furthermore, this decrease had
affected mainly the highly correlated modules (Fig. 2).
With the thresholds tJ=2/3
and δ=0.1, 394 disrupted module pairs [γ(S,T)], were
evaluated. Subsequently, γ(S,T) were divided into
γ'(S,T) of module pairs exhibiting higher correlation
density in HCC than in normal patients, γ"(S,T) of
module pairs with lower correlation in HCC than in normal controls,
and computed γ'(S,T)=332 and
γ"(S,T)=62. The absolute differential correlation
density ∆C of these subsets was calculated, as presented in
Table III. Notably, the maximal and
minimum absolute differential correlation density ∆C was
similar, and the difference between the average ∆C of two
subsets was only 0.09. Besides, pathway-based analysis revealed
enrichment for similar terms in both γ'(S,T) and
γ"(S,T), which was not sufficiently specific to
differentiate the roles of the two subsets and, therefore, whether
compensatory or HCC-driving mechanisms are involved This prompted
further in-depth analysis of the modules.
| Table II.Properties of normal and HCC
modules. |
Table II.
Properties of normal and HCC
modules.
|
|
|
| Module correlation
density |
|---|
|
|
|
|
|
|---|
| Module set | Number of
modules | Average module
sizea | Maximal | Average | Minimum |
|---|
| Normal
S | 1810 | 20.175 | 0.512 | 0.142 | −0.175 |
| HCC T | 785 | 28.851 | 0.525 | 0.156 | −0.145 |
| Table III.Correlations of matched normal and
hepatocellular carcinoma module pairs. |
Table III.
Correlations of matched normal and
hepatocellular carcinoma module pairs.
|
|
| ∆C |
|---|
|
|
|
|
|---|
| Module pair
subseta | No. of pairs | Maximal | Average | Minimum |
|---|
| γ'(S,T) | 332 | 0.215 | 0.114 | 0.100 |
| γ"(S,T) | 62 | 0.211 | 0.123 | 0.101 |
In-depth analysis of disrupted
modules
Of the 394 disrupted module pairs in
γ(S,T), gene compositions were studied, as
represented in Fig. 3. Gene
compositions between two disrupted modules may be the same
(Fig. 3A and B) or different
(Fig. 3C and D). For the same gene
compositions modules, the interaction score between two identical
genes was different. For the different gene compositions modules,
the genes and interaction scores were all different.
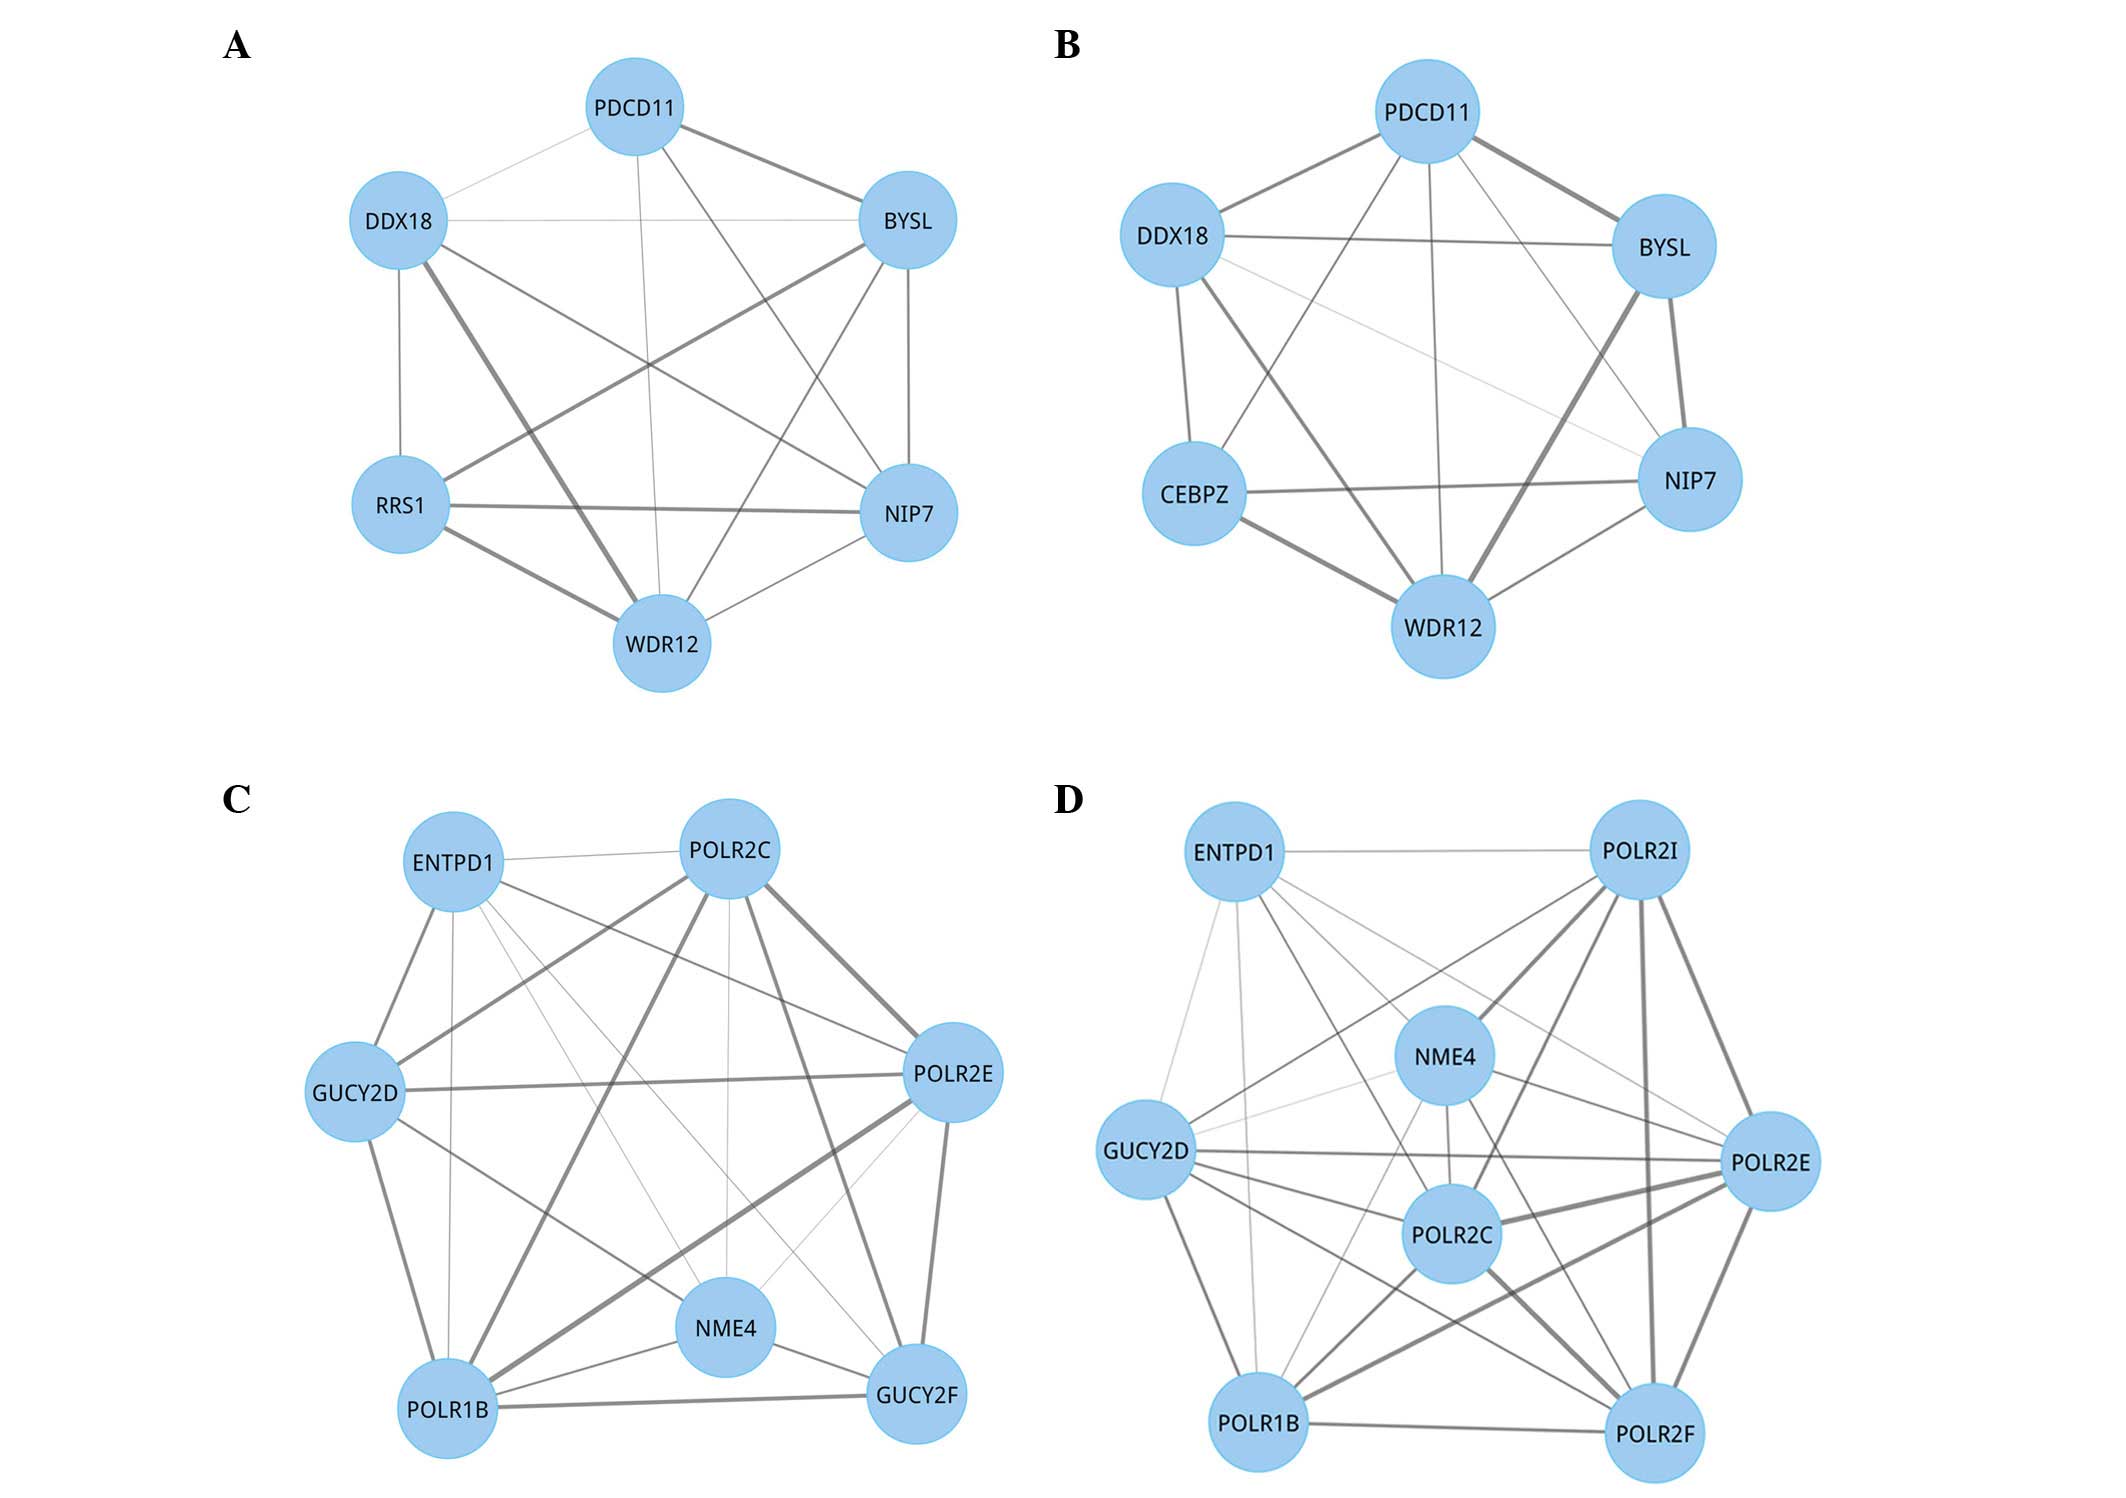 | Figure 3.Swapping behavior of disrupted
modules. A swapping phenomenon means that novel genes replace
existing genes, forming physical interactions with the remaining
ones in these modules within a tumor. (A) A module in normal
condition. (B) The paired disrupted module of (A) in hepatocellular
carcinoma. (C) A normal module. (D) The paired disrupted module of
(C). Relative to normal conditions, a novel gene CEBPZ in
module (B) replaced the existing gene RRS1, and in module
(D) a novel gene POLR2F replaced the existing gene
GUCY2F. Furthermore, a new POLR2I gene was added. In
addition, the interaction score changed. Nodes represent genes,
while lines represent the interactions between these genes. The
thickness of the lines represents the interaction score between two
genes. PDCD11, programmed cell death 11; BYSL,
bystin-like; NIP7, nucleolar pre-rRNA processing protein;
WDR12, WD repeat domain 12; RRS1, ribosome biogenesis
regulator homolog; DDX18, DEAD box protein 18; CEBPZ,
CCAAT/enhancer binding protein (C/EBP), zeta; ENTPD1,
ectonucleoside triphosphate diphosphohydrolase 1; POLR2C,
polymerase (RNA) II (DNA directed) polypeptide C; NME4,
NME/NM23 nucleoside diphosphate kinase 4; GUCY2D, guanylate
cyclase 2D; POLR1B, polymerase (RNA) I polypeptide B;
GUCY2F, guanylate cyclase 2F; POLR2F, polymerase
(RNA) II (DNA directed) polypeptide F; POLR2E, polymerase
(RNA) II (DNA directed) polypeptide E; POLR2I, polymerase
(RNA) II (DNA directed) polypeptide I. |
Furthermore, a total of 236 dysregulated genes were
evaluated in all the disrupted modules, and pathway enrichment
analysis was conducted for these genes (Table IV). There were 38 pathways within the
threshold P<0.001. Neuroactive ligand-receptor interaction
(P=1.38×10⁻²²), chemokine signaling pathway (P=8.22×10⁻¹³),
metabolism of xenobiotics by CYP (P=8.66×10⁻¹²), purine metabolism
(P=5.39×10⁻¹¹) and linoleic acid metabolism (P=9.10×10⁻¹⁰) were the
five most significant pathways.
| Table IV.Pathways based on dysregulated genes
in disrupted normal and hepatocellular carcinoma modules. |
Table IV.
Pathways based on dysregulated genes
in disrupted normal and hepatocellular carcinoma modules.
| Term | P-value | Count |
|---|
| Neuroactive
ligand-receptor interaction |
1.38×10⁻²² | 48 |
| Chemokine signaling
pathway |
8.22×10⁻¹³ | 31 |
| Metabolism of
xenobiotics by cytochrome P450 |
8.66×10⁻¹² | 18 |
| Purine
metabolism |
5.39×10⁻¹¹ | 26 |
| Linoleic acid
metabolism |
9.10×10⁻¹⁰ | 12 |
| Drug
metabolism |
1.78×10−09 | 16 |
| Pyrimidine
metabolism |
2.80×10−09 | 19 |
| GnRH signaling
pathway |
4.74×10−09 | 19 |
|
Phosphatidylinositol signaling system |
1.81×10−07 | 15 |
| VEGF signaling
pathway |
2.16×10−07 | 15 |
| Arachidonic acid
metabolism |
3.40×10−07 | 13 |
|
Progesterone-mediated oocyte
maturation |
1.24×10−06 | 15 |
| Vascular smooth
muscle contraction |
1.31×10−06 | 17 |
| Inositol phosphate
metabolism |
1.83×10−06 | 12 |
| Gap junction |
1.91×10−06 | 15 |
| Fc epsilon RI
signaling pathway |
2.31×10−06 | 14 |
| Long-term
depression |
3.61×10−06 | 13 |
| Pancreatic
cancer |
5.73×10−06 | 13 |
| Glioma |
8.95×10−06 | 12 |
| Non-small cell lung
cancer |
1.35×10−05 | 11 |
| Renal cell
carcinoma |
2.54×10−05 | 12 |
| Melanogenesis |
3.40×10−05 | 14 |
| RNA polymerase |
3.63×10−05 | 8 |
| Fc gamma R-mediated
phagocytosis |
1.01×10−04 | 13 |
| Cell cycle |
1.02×10−04 | 15 |
| Type II diabetes
mellitus |
1.88×10−04 | 9 |
| Focal adhesion |
1.99×10−04 | 19 |
| DNA
replication |
2.02×10−04 | 8 |
| Prostate
cancer |
2.40×10−04 | 12 |
| Chronic myeloid
leukemia |
2.47×10−04 | 11 |
| Glutathione
metabolism |
2.93×10−04 | 9 |
| Endometrial
cancer |
3.88×10−04 | 9 |
|
Aldosterone-regulated sodium
reabsorption |
4.69×10−04 | 8 |
| Colorectal
cancer |
6.26×10−04 | 11 |
| Small cell lung
cancer |
6.26×10−04 | 11 |
| Melanoma |
7.38×10−04 | 10 |
| ErbB signaling
pathway |
8.28×10−04 | 11 |
| Pathways in
cancer |
9.62×10−04 | 24 |
If a gene existed in a normal module but not in a
disrupted HCC module, it was called ‘miss’ gene; on the contrary,
if a gene existed in a disrupted HCC module but not in a normal
module, it was called ‘add’ gene. The present study evaluated 58
‘add’ genes and 87 ‘miss’ genes among 236 dysregulated genes of
disrupted HCC modules, and collectively referred to them as
dysregulated genes. The ‘add’ genes were enriched in two pathways
(neuroactive ligand-receptor interaction and purine metabolism),
while the ‘miss’ genes were enriched in six terms (neuroactive
ligand-receptor interaction, purine metabolism, pyrimidine
metabolism, chemokine signaling pathway, gap junction and RNA
polymerase). Neuroactive ligand-receptor interaction and purine
metabolism were common pathways of total, ‘add’ and ‘miss’
dysregulated genes enrichment analysis; thus, it was inferred that
the two pathways may be significant terms in HCC development.
To explore the significant genes of HCC in depth,
211 DE genes between normal controls and HCC patients were
identified, and the intersection of DE genes and dysregulated genes
was obtained. The 26 common genes are listed in Table V. PLCB1 participated in 10
pathways, of which, 7 were the same as pathways based on
dysregulated genes. Platelet-derived growth factor receptor,
alpha polypeptide was involved in 9 pathways, whereas 11 common
genes were not enriched in any pathway. Among these common genes,
PLCB1, CYP2C8, CYP2B6, alcohol dehydrogenase
(ADH) 1B, ADH6, CYP3A43, CYP2E1, aurora
kinase A, decorin, lipoprotein(A), geminin (GMNN) and alpha-
fetoprotein (AFP), were also ‘add’ or ‘miss’ genes. The
pathways of metabolism of xenobiotics mediated by CYP and drug
metabolism both contained 9 common genes.
| Table V.Common genes between differentially
expressed genes and dysregulated genes of hepatocellular
carcinoma. |
Table V.
Common genes between differentially
expressed genes and dysregulated genes of hepatocellular
carcinoma.
| Symbol | Sum. pathway | ‘Add’ gene | ‘Miss’ gene | Pathways |
|---|
| PLCB1 | 10 | No | Yes | Long-term
depression, GnRH signaling pathway, gap junction,
phosphatidylinositol signaling system, vascular smooth muscle
contraction, melanogenesis, Wnt signaling pathway, inositol
phosphate, chemokine signaling pathway, long-term potentiation |
| PDGFRA | 9 | No | No | Focal adhesion,
colorectal cancer, glioma, melanoma, pathways in cancer, prostate
cancer, gap junction, MAPK signaling pathway, regulation of
actin |
| CYP2C9 | 5 | No | No | Metabolism of
xenobiotics by CYP, drug metabolism, linoleic acid metabolism,
arachidonic acid metabolism, retinol metabolism |
| CYP2C8 | 5 | Yes | No | Metabolism of
xenobiotics by CYP, drug metabolism, linoleic acid metabolism,
arachidonic acid metabolism, retinol metabolism |
| CYP1A2 | 4 | No | No | Metabolism of
xenobiotics by CYP, drug metabolism, linoleic acid metabolism,
retinol metabolism |
| CYP2B6 | 4 | Yes | Yes | Metabolism of
xenobiotics by CYP, drug metabolism, linoleic acid metabolism,
retinol metabolism |
| GSTZ1 | 4 | No | No | Metabolism of
xenobiotics by CYP, drug metabolism, glutathione metabolism,
metabolism |
| ADH1B | 4 | Yes | No | Metabolism of
xenobiotics by CYP, drug metabolism, retinol metabolism, tyrosine
metabolism |
| ADH6 | 4 | No | Yes | Metabolism of
xenobiotics by CYP, drug metabolism, retinol metabolism, tyrosine
metabolism |
| CYP3A4 | 4 | Yes | No | Metabolism of
xenobiotics by CYP, drug metabolism, linoleic acid metabolism,
retinol metabolism |
| CYP2E1 | 4 | Yes | No | Metabolism of
xenobiotics by CYP, drug metabolism, linoleic acid metabolism,
arachidonic acid metabolism |
| ADH1A | 4 | No | No | Metabolism of
xenobiotics by CYP, drug metabolism, retinol metabolism, tyrosine
metabolism |
| CCNB1 | 3 | No | No | Cell cycle,
progesterone-mediated oocyte maturation, oocyte meiosis |
| AURKA | 1 | No | Yes | Tyrosine
metabolism |
| DCN | 1 | Yes | No | TGF-beta signaling
pathway |
| ASPM | 0 | No | No | – |
| RACGAP1 | 0 | No | No | – |
| LPA | 0 | No | Yes | – |
| TOP2A | 0 | No | No | – |
| CENPF | 0 | No | No | – |
| GMNN | 0 | Yes | Yes | – |
| CDKN3 | 0 | No | No | – |
| NUSAP1 | 0 | No | No | – |
| ECT2 | 0 | No | No | – |
| CTH | 0 | No | No | – |
| AFP | 0 | No | Yes | – |
Validation of common genes based on
RT-qPCR analysis
Among the common genes, PLCB1,
CYP2C8, CYP2B6, CYP3A43, CYP2E19 and
GMNN were selected as examples to validate the results of
the present module-based analysis and to examine the changes in
their expression profiles by RT-qPCR in HCC patients (Fig. 4). These genes were also ‘add’ or
‘miss’ genes; among them, PLCB1, CYP2C8,
CYP2B6, CYP2E19 and GMNN were upregulated DE
genes, whereas CYP3A43 was a downregulated DE gene. The
results revealed that PLCB1, CYP2C8, CYP2B6,
CYP3A43, CYP2E19 and GMNN in HCC patients were
significantly DE (P<0.001) compared with normal controls. Apart
from CYP3A43, the other genes possessed higher relative
expression levels in HCC patients than in normal controls, which
confirmed the regulation of DE genes.
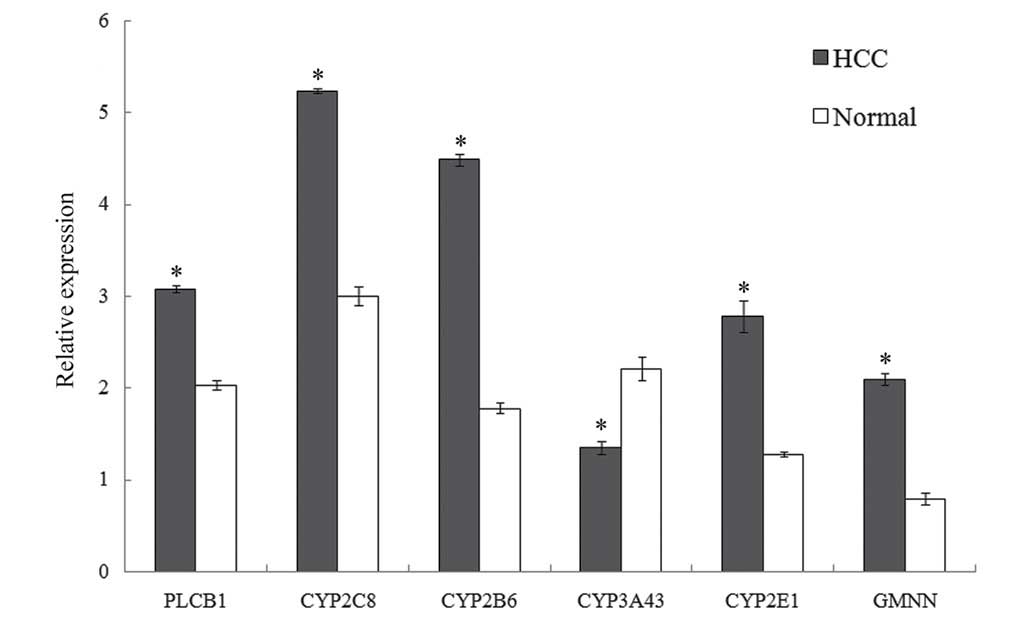 | Figure 4.Relative expression of PLCB1,
CYP2C8, CYP2B6, CYP3A43, CYP2E19 and GMNN. The
expression of one gene in HCC compared with normal controls was
indicated by its P-value. All the six genes analyzed were
significantly differently expressed in HCC (*P<0.001 vs.
control). If a gene exhibited a P>0.05, it would be not
significantly differently expressed; by contrast, a gene with
P<0.05 was considered to be significantly differently expressed.
PLCB1, phospholipase C beta 1; CYP, cytochrome P450; GMNN, geminin;
HCC, hepatocellular carcinoma. |
Discussion
The objective of the present study is to identify
dysregulated genes and pathways in HCC based on systematically
tracking the disrupted modules of re-weighted PPI networks. Normal
and HCC PPI networks were evaluated by PCC; modules from the
networks were then identified, and 394 disrupted module pairs were
obtained. The gene compositions of the disrupted modules were
studied, and 236 dysregulated genes of these modules were
identified. When comparing these dysregulated genes with 211 DE
genes, a total of 26 common genes (including PLCB1,
CYP2C8 and CYP2B6) were identified. Pathway
enrichment analysis of dysregulated genes demonstrated that
neuroactive ligand-receptor interaction, purine metabolism,
metabolism of xenobiotics by CYP and drug metabolism were
significantly disrupted pathways. In addition, the expression of
various common genes was validated by RT-qPCR.
PLCB1 encodes an enzyme that generates the
intracellular second messenger diacylglycerol inositol
1,4,5-trisphosphate from phosphatidylinositol 4,5-bisphosphate
(26). PLCB1 has been validated as a
carcinogen of HCC (27,28). Jia et al (27) suggested that PLCB1 was a
critical driver gene with causal roles in carcinogenesis, and may
have an important role in HCC pathogenesis. HCC with recurrence
exhibited enrichment of upregulated genes mapping to signaling or
disease pathways associated with cell cycle regulators, including
genes that encode proteins involved in the molecular mechanisms of
cancer control such as PLCB1 (28). The present study identified
PLCB1 as an upregulated DE gene, and then validated it by
RT-qPCR, which was consistent with the literature (28).
CYP2C8 and CYP2B6 both encode a
member of the CYP family of enzymes (29). These enzymes are known to metabolize
certain xenobiotics, including the anticonvulsive drug mephenytoin
and the anticancer drugs cyclophosphamide and ifosphamide (30). The members of the CYP family,
which are involved in a myriad of biological processes, were
noticed to be frequently dysregulated in numerous diseases,
including liver, prostate and breast cancer as well as leukemia
(31,32). Furthermore, a numbers of studies have
revealed that CYP2C8 correlated with several cancers,
including breast cancer (32),
ovarian cancer (33) and colorectal
cancer (34). Therefore, it could be
inferred that CYP2C8 was closely associated with cancer. In
addition, CYP2C8 was primarily distributed in the liver, and
is the second most abundant member of the CYP2C family expressed in
this organ (35). Zhang et al
(36) suggested that CYP2C8
was post-transcriptionally regulated by microRNAs in human liver.
CYP2C8 was identified as a major CYP responsible for
morphine N-demethylation in liver microsomes (37). In the present study, CYP2C8 was
demonstrated to be an upregulated DE gene, and its expression was
validated by RT-qPCR. The results were consistent with those from
previous studies, which confirmed the feasibility and veracity of
the present analysis. Therefore. it was concluded that
CYP2C8 played a carcinogenic role in HCC.
CYP2B6 was an ‘overlooked’ P450 isozyme,
which has now been recognized to be important for xenobiotic
metabolism (38). The expression of
CYP2B6 has been investigated in a few carcinomas, including
breast cancer and HCC (39). Lee
et al (40) demonstrated that
several single-nucleotide polymorphisms in the vascular endothelial
growth factor, insulin-like growth factor 2 and CYP2B6
genes, which are relevant to tumor angiogenesis or drug metabolism,
predisposed to the development of treatment-associated toxicity in
Korean HCC patients. Furthermore, CYP2B6 expression was
decreased with liver diseases progressed to the end-stage (41). Genome-wide transcriptome analysis in
three pairs of non-tumorous livers/HCCs clarified that
CYP2B6 messenger RNA displayed the lowest expression level
in group G3 with G1-G6 classification (42). In the present study, it was observed
that CYP2B6 was an upregulated DE gene, and when validated
by RT-qPCR, its relative expression level in HCC was higher than
that in normal controls. Therefore, CYP2B6 had a close
association with HCC.
Pathway enrichment analysis revealed the most
significant pathways in the disrupted modules, including
neuroactive ligand-receptor interaction, purine metabolism,
metabolism of xenobiotics by CYP and drug metabolism. It has been
demonstrated by Liu et al (43) that neuroactive ligand-receptor
interaction and purine metabolism were both associated with HCC,
since genes expressed in human liver were involved in neuroactive
ligand-receptor interaction pathways (31). AFP secreted cluster of HCC was
involved in disease mutation without neuroactive ligand-receptor
interaction and in cell surface receptor-linked signal transduction
(44). In addition, Zhao et al
(45) revealed that neuroactive
ligand-receptor interaction was present in the early-, middle- and
late-stages of HCC. Therefore, this pathway (neuroactive
ligand-receptor interaction) appears to be important in HCC
progression.
Understanding the mechanism involved in metabolic
regulation has important implications in both biotechnology and
medicine. It has been estimated that ≥1/3 of all serious health
problems are caused by metabolic disorders (46). The present study revealed that HCC was
correlated with several metabolic pathways, including purine
metabolism and metabolism of xenobiotics by CYP. Purine metabolism
may serve as the salvage pathway in HCC, as suggested by the
upregulation of hypoxanthine, and the results reflected metabolic
responses to surgical operation in HCC patients (47). In addition, the altered purine
metabolism pathway provided a promising methodology to distinguish
cirrhotic HCV patients who were at high risk of developing HCC from
those who had already progressed to HCC (48). The metabolism of xenobiotics by CYP is
a typical liver-function-specific pathway and is important in HCC
(49,50). Apart from genes involved in metabolic
pathways, the present study has explored common genes, including
CYP2C8, CYP2B6, CYP3A43 and CYP2E1,
which encode members of the CYP family. CYPs are
estimated to be involved in the metabolism of drugs, chemicals and
endogenous substrates, and hepatic CYPs may participate in
the pathogenesis of liver diseases (51). Thus, the present results were in
accordance with those from previous studies (47,51).
In conclusion, the present study successfully
identified significant genes (such as PLCB1, CYP2C8
and CYP2B6) and pathways (including neuroactive
ligand-receptor interaction, purine metabolism and metabolism of
xenobiotics mediated by CYP), which may be potential biomarkers
associated with HCC. The current study greatly improved the
understanding of HCC in a systematic manner and provided potential
biomarkers for early detection and novel therapeutic methods.
Acknowledgements
The authors would like to express their gratitude
to all the collaborators that assisted during the writing of the
present manuscript. The authors gratefully acknowledge the Jinan
Evidence Based Medicine Science-Technology Center (Jinan, China)
for their valuable instructions and suggestions on the selection of
the microarray expression profiles and the analytical methods
employed in the present study.
References
|
1
|
Kaseb AO, Xiao L, Hassan MM, Chae YK, Lee
JS, Vauthey JN, Krishnan S, Cheung S, Hassabo HM, Aloia T, et al:
Development and validation of a scoring system using insulin-like
growth factor to assess hepatic reserve in hepatocellular
carcinoma. J Natl Cancer Inst. 106:pii: dju088. 2014. View Article : Google Scholar : PubMed/NCBI
|
|
2
|
Arzumanyan A, Reis HM and Feitelson MA:
Pathogenic mechanisms in HBV- and HCV-associated hepatocellular
carcinoma. Nat Rev Cancer. 13:123–135. 2013. View Article : Google Scholar : PubMed/NCBI
|
|
3
|
Aoki T, Kokudo N, Matsuyama Y, Izumi N,
Ichida T, Kudo M, Ku Y, Sakamoto M, Nakashima O, Matsui O, et al:
Prognostic impact of spontaneous tumor rupture in patients with
hepatocellular carcinoma: An analysis of 1160 cases from a
nationwide survey. Ann Surg. 259:532–542. 2014. View Article : Google Scholar : PubMed/NCBI
|
|
4
|
Llovet JM, Peña CE, Lathia CD, Shan M,
Meinhardt G and Bruix J: SHARP Investigators Study Group: Plasma
biomarkers as predictors of outcome in patients with advanced
hepatocellular carcinoma. Clin Cancer Res. 18:2290–2300. 2012.
View Article : Google Scholar : PubMed/NCBI
|
|
5
|
Doncheva NT, Kacprowski T and Albrecht M:
Recent approaches to the prioritization of candidate disease genes.
Wiley Interdiscip Rev Syst Biol Med. 4:429–442. 2012. View Article : Google Scholar : PubMed/NCBI
|
|
6
|
Srihari S and Ragan MA: Systematic
tracking of dysregulated modules identifies novel genes in cancer.
Bioinformatics. 29:1553–1561. 2013. View Article : Google Scholar : PubMed/NCBI
|
|
7
|
Liu KQ, Liu ZP, Hao JK, Chen L and Zhao
XM: Identifying dysregulated pathways in cancers from pathway
interaction networks. BMC Bioinformatics. 13:1262012. View Article : Google Scholar : PubMed/NCBI
|
|
8
|
Zhang J, Lu K, Xiang Y, Islam M, Kotian S,
Kais Z, Lee C, Arora M, Liu HW, Parvin JD and Huang K: Weighted
frequent gene co-expression network mining to identify genes
involved in genome stability. PLoS Comput Biol. 8:e10026562012.
View Article : Google Scholar : PubMed/NCBI
|
|
9
|
Magger O, Waldman YY, Ruppin E and Sharan
R: Enhancing the prioritization of disease-causing genes through
tissue specific protein interaction networks. PLoS Comput Biol.
8:e10026902012. View Article : Google Scholar : PubMed/NCBI
|
|
10
|
Liu Y, Koyutürk M, Barnholtz-Sloan JS and
Chance MR: Gene interaction enrichment and network analysis to
identify dysregulated pathways and their interactions in complex
diseases. BMC Syst Biol. 6:652012. View Article : Google Scholar : PubMed/NCBI
|
|
11
|
Jensen LJ, Kuhn M, Stark M, Chaffron S,
Creevey C, Muller J, Doerks T, Julien P, Roth A, Simonovic M, et
al: STRING 8-a global view on proteins and their functional
interactions in 630 organisms. Nucleic Acids Res. 37:(Database
issue). D412–D416. 2009. View Article : Google Scholar : PubMed/NCBI
|
|
12
|
Roessler S, Jia HL, Budhu A, Forgues M, Ye
QH, Lee JS, Thorgeirsson SS, Sun Z, Tang ZY, Qin LX and Wang XW: A
unique metastasis gene signature enables prediction of tumor
relapse in early-stage hepatocellular carcinoma patients. Cancer
Res. 70:10202–10212. 2010. View Article : Google Scholar : PubMed/NCBI
|
|
13
|
Roessler S, Long EL, Budhu A, Chen Y, Zhao
X, Ji J, Walker R, Jia HL, Ye QH, Qin LX, et al: Integrative
genomic identification of genes on 8p associated with
hepatocellular carcinoma progression and patient survival.
Gastroenterology. 142:957–966, e12. 2012. View Article : Google Scholar : PubMed/NCBI
|
|
14
|
Irizarry RA, Bolstad BM, Collin F, Cope
LM, Hobbs B and Speed TP: Summaries of Affymetrix GeneChip probe
level data. Nucleic Acids Res. 31:e152003. View Article : Google Scholar : PubMed/NCBI
|
|
15
|
Bolstad BM, Irizarry RA, Astrand M and
Speed TP: A comparison of normalization methods for high density
oligonucleotide array data based on variance and bias.
Bioinformatics. 19:185–193. 2003. View Article : Google Scholar : PubMed/NCBI
|
|
16
|
Bolstad B: affy: Built-in processing
methods. http://www.bioconductor.org/packages/release/bioc/vignettes/affy/inst/doc/builtinMethods.pdfMarch
26–2014
|
|
17
|
Williams S: Pearson's correlation
coefficient. N Z Med J. 109:381996.PubMed/NCBI
|
|
18
|
Liu G, Wong L and Chua HN: Complex
discovery from weighted PPI networks. Bioinformatics. 25:1891–1897.
2009. View Article : Google Scholar : PubMed/NCBI
|
|
19
|
Srihari S and Leong HW: A survey of
computational methods for protein complex prediction from protein
interaction networks. J Bioinform Comput Biol. 11:12300022013.
View Article : Google Scholar : PubMed/NCBI
|
|
20
|
Tomita E, Tanaka A and Takahashi H: The
worst-case time complexity for generating all maximal cliques and
computational experiments. Theor Comput Sci. 363:28–42. 2006.
View Article : Google Scholar
|
|
21
|
Gabow HN: An efficient implementation of
Edmonds' algorithm for maximum matching on graphs. JACM.
23:221–234. 1976. View Article : Google Scholar
|
|
22
|
da W Huang, Sherman BT and Lempicki RA:
Systematic and integrative analysis of large gene lists using DAVID
bioinformatics resources. Nat Protoc. 4:44–57. 2009.PubMed/NCBI
|
|
23
|
Ford G, Xu Z, Gates A, Jiang J and Ford
BD: Expression analysis systematic explorer (EASE) analysis reveals
differential gene expression in permanent and transient focal
stroke rat models. Brain Res. 1071:226–236. 2006. View Article : Google Scholar : PubMed/NCBI
|
|
24
|
Diboun I, Wernisch L, Orengo CA and
Koltzenburg M: Microarray analysis after RNA amplification can
detect pronounced differences in gene expression using limma. BMC
genomics. 7:2522006. View Article : Google Scholar : PubMed/NCBI
|
|
25
|
Schmittgen TD and Livak KJ: Analyzing
real-time PCR data by the comparative C(T) method. Nat Protoc.
3:1101–1108. 2008. View Article : Google Scholar : PubMed/NCBI
|
|
26
|
Poduri A, Chopra SS, Neilan EG, Elhosary
PC, Kurian MA, Meyer E, Barry BJ, Khwaja OS, Salih MA, Stödberg T,
et al: Homozygous PLCB1 deletion associated with malignant
migrating partial seizures in infancy. Epilepsia. 53:e146–e150.
2012. View Article : Google Scholar : PubMed/NCBI
|
|
27
|
Jia D, Wei L, Guo W, Zha R, Bao M, Chen Z,
Zhao Y, Ge C, Zhao F, Chen T, et al: Genome-wide copy number
analyses identified novel cancer genes in hepatocellular carcinoma.
Hepatology. 54:1227–1236. 2011. View Article : Google Scholar : PubMed/NCBI
|
|
28
|
Das T, Diamond DL, Yeh M, Hassan S, Bryan
JT, Reyes JD and Perkins JD: Molecular signatures of recurrent
hepatocellular carcinoma secondary to hepatitis C virus following
liver transplantation. J Transplant. 2013:8782972013. View Article : Google Scholar : PubMed/NCBI
|
|
29
|
Danielson PB: The cytochrome P450
superfamily: biochemistry, evolution and drug metabolism in humans.
Curr Drug Metab. 3:561–597. 2002. View Article : Google Scholar : PubMed/NCBI
|
|
30
|
Depaz IM Booth, Toselli F, Wilce PA and
Gillam EM: Differential expression of cytochrome P450 enzymes from
the CYP2C subfamily in the human brain. Drug Metab Dispos.
43:353–357. 2015. View Article : Google Scholar : PubMed/NCBI
|
|
31
|
Yu Y, Ping J, Chen H, Jiao L, Zheng S, Han
ZG, Hao P and Huang J: A comparative analysis of liver
transcriptome suggests divergent liver function among human, mouse
and rat. Genomics. 96:281–289. 2010. View Article : Google Scholar : PubMed/NCBI
|
|
32
|
Hertz DL, Roy S, Jack J, Motsinger-Reif
AA, Drobish A, Clark LS, Carey LA, Dees EC and McLeod HL: Genetic
heterogeneity beyond CYP2C8*3 does not explain differential
sensitivity to paclitaxel-induced neuropathy. Breast Cancer Res
Treat. 145:245–254. 2014. View Article : Google Scholar : PubMed/NCBI
|
|
33
|
Bergmann TK, Brasch-Andersen C, Gréen H,
Mirza MR, Skougaard K, Wihl J, Keldsen N, Damkier P, Peterson C,
Vach W and BrØsen K: Impact of ABCB1 variants on neutrophil
depression: A pharmacogenomic study of paclitaxel in 92 women with
ovarian cancer. Basic Clin Pharmacol Toxicol. 110:199–204. 2012.
View Article : Google Scholar : PubMed/NCBI
|
|
34
|
Bergmann TK, Brasch-Andersen C, Gréen H,
Mirza M, Pedersen RS, Nielsen F, Skougaard K, Wihl J, Keldsen N,
Damkier P, et al: Impact of CYP2C8x3 on paclitaxel
clearance: A population pharmacokinetic and pharmacogenomic study
in 93 patients with ovarian cancer. Pharmacogenomics J. 11:113–120.
2011. View Article : Google Scholar : PubMed/NCBI
|
|
35
|
Läpple F, von Richter O, Fromm MF, Richter
T, Thon KP, Wisser H, Griese EU, Eichelbaum M and Kivistö KT:
Differential expression and function of CYP2C isoforms in human
intestine and liver. Pharmacogenetics. 13:565–575. 2003. View Article : Google Scholar : PubMed/NCBI
|
|
36
|
Zhang SY, Surapureddi S, Coulter S,
Ferguson SS and Goldstein JA: Human CYP2C8 is
post-transcriptionally regulated by microRNAs 103 and 107 in human
liver. Mol Pharmacol. 82:529–540. 2012. View Article : Google Scholar : PubMed/NCBI
|
|
37
|
Naraharisetti SB, Lin YS, Rieder MJ,
Marciante KD, Psaty BM, Thummel KE and Totah RA: Human liver
expression of CYP2C8: gender, age, and genotype effects. Drug Metab
Dispos. 38:889–893. 2010. View Article : Google Scholar : PubMed/NCBI
|
|
38
|
Ekins S and Wrighton SA: The role of
CYP2B6 in human xenobiotic metabolism. Drug Metab Rev. 31:719–754.
1999. View Article : Google Scholar : PubMed/NCBI
|
|
39
|
Kumagai J, Fujimura T, Takahashi S, Urano
T, Ogushi T, Horie-Inoue K, Ouchi Y, Kitamura T, Muramatsu M,
Blumberg B and Inoue S: Cytochrome P450 2B6 is a growth-inhibitory
and prognostic factor for prostate cancer. Prostate. 67:1029–1037.
2007. View Article : Google Scholar : PubMed/NCBI
|
|
40
|
Lee JH, Shim JH, Chung YH, Lee D, Lee HC
and Shin ES: Genetic polymorphisms associated with treatment
toxicity after sorafenib combination therapy in Korean patients
with hepatocellular carcinoma. Clin Mol Hepatol. 17:362011.
|
|
41
|
Chen H, Shen ZY, Xu W, Fan TY, Li J, Lu
YF, Cheng ML and Liu J: Expression of P450 and nuclear receptors in
normal and end-stage Chinese livers. World J Gastroenterol.
20:8681–8690. 2014. View Article : Google Scholar : PubMed/NCBI
|
|
42
|
Cillo C, Schiavo G, Cantile M, Bihl MP,
Sorrentino P, Carafa V, D'Armiento M, Roncalli M, Sansano S,
Vecchione R, et al: The HOX gene network in hepatocellular
carcinoma. Int J Cancer. 129:2577–2587. 2011. View Article : Google Scholar : PubMed/NCBI
|
|
43
|
Liu Z, Gartenhaus RB, Tan M, Jiang F and
Jiao X: Gene and pathway identification with Lp penalized Bayesian
logistic regression. BMC Bioinformatics. 9:4122008. View Article : Google Scholar : PubMed/NCBI
|
|
44
|
Wang L, Huang J, Jiang M and Zheng X: AFP
computational secreted network construction and analysis between
human hepatocellular carcinoma (HCC) and no-tumor
hepatitis/cirrhotic liver tissues. Tumor Biol. 31:417–425. 2010.
View Article : Google Scholar
|
|
45
|
Zhao Y, Xue F, Sun J, Guo S, Zhang H, Qiu
B, Geng J, Gu J, Zhou X, Wang W, et al: Genome-wide methylation
profiling of the different stages of hepatitis B virus-related
hepatocellular carcinoma development in plasma cell-free DNA
reveals potential biomarkers for early detection and high-risk
monitoring of hepatocellular carcinoma. Clin Epigenetics. 6:302014.
View Article : Google Scholar : PubMed/NCBI
|
|
46
|
Liao KC, Pu SJ, Lin CH, Chang HJ, Chen YJ
and Liu MS: Association between the metabolic syndrome and its
components with falls in community-dwelling older adults. Metab
Syndr Relat Disord. 10:447–451. 2012. View Article : Google Scholar : PubMed/NCBI
|
|
47
|
Chan W, Lin S, Sun S, Liu H, Luk JM and
Cai Z: Metabolomics analysis of the responses to partial
hepatectomy in hepatocellular carcinoma patients. Am J Analyt Chem.
2:142–151. 2011. View Article : Google Scholar
|
|
48
|
Baniasadi H, Gowda GA, Gu H, Zeng A,
Zhuang S, Skill N, Maluccio M and Raftery D: Targeted metabolic
profiling of hepatocellular carcinoma and hepatitis C using
LC-MS/MS. Electrophoresis. 34:2910–2917. 2013.PubMed/NCBI
|
|
49
|
Cheng S, Prot JM, Leclerc E and Bois FY:
Zonation related function and ubiquitination regulation in human
hepatocellular carcinoma cells in dynamic vs. static culture
conditions. BMC Genomics. 13:542012. View Article : Google Scholar : PubMed/NCBI
|
|
50
|
Lv J, Zhu B, Zhang L, Xie Q and Zhuo W:
Detection and screening of small molecule agents for overcoming
Sorafenib resistance of hepatocellular carcinoma: A bioinformatics
study. Int J Clin Exp Med. 8:2317–2325. 2015.PubMed/NCBI
|
|
51
|
Villeneuve JP and Pichette V: Cytochrome
P450 and liver diseases. Curr Drug Metab. 5:273–282. 2004.
View Article : Google Scholar : PubMed/NCBI
|