Introduction
During the past 30 years, the annual incidence of
melanoma has increased by >60% in the USA (1). Globally, according to estimates for
2008, there were almost 200,000 novel cases of invasive cutaneous
malignant melanoma, and an estimated 46,000 mortalities from the
disease (2). Although melanoma
accounts for only 4% of all cutaneous malignancies, it is
responsible for 80% of mortalities from skin cancer (3). Malignant melanoma is one of the most
aggressive malignancies, due to its effective capacity to grow,
invade and metastasise (4). Despite
recent successes of targeted therapies, there are limited treatment
options for metastatic melanoma (5).
It is therefore of high priority to increase the understanding of
disease progression, to predict response to specific therapeutic
regimes (6) and to identify novel
therapeutic targets (7). Significant
advances have been made in the area of proteomics over the last two
decades, undoubtedly improving our understanding of human biology
at the cellular level, and identifying novel diagnostic molecules
and potential therapeutic targets, all of which contribute to the
current personalized medicine era (8–10). Various
techniques, including mass spectrometry (MS), liquid chromatography
(LC), fractionation and multiplex assays, have contributed to build
protein expression knowledge and global protein analysis (11).
Possibly one of the most recent advances has been
the application of proteomics technologies to the analysis of
formalin-fixed, paraffin-embedded (FFPE) tissues (12). Due to the stability of these tissues
following fixation, numerous hospitals have acquired vast archives
of FFPE tissue with associated information regarding patient
diagnosis and outcome (12). In
particular, the filter-aided sample preparation (FASP) method has
been demonstrated to be better, both qualitatively and
quantitatively, than alternative methods for processing FFPE tissue
for proteomics analysis (13,14).
The goal of the present study was to gain a more
in-depth understanding of the differences in protein expression
levels between in situ and invasive melanoma FFPE tissue
biopsies. For that purpose, a FASP-FFPE tissue preparation
protocol, LC-tandem MS (MS/MS), label-free quantification and
pathway mapping were utilized to explore specific signalling
network modulation. The present findings may facilitate a more
comprehensive understanding of the adaptive processes activated
during the in situ-to-invasive transition of melanoma, thus
facilitating the identification of novel therapeutic targets and
biomarkers of aggressive disease.
Materials and methods
FFPE tissue samples
The present research protocol was approved by the
St. James's Hospital Ethics Committee (Dublin, Ireland) and
informed consent was obtained from all participating patients.
Tissue specimens were processed using standard procedures for
formalin fixation, and were embedded in paraffin as normally
performed for routine clinical analysis (Table I) (15).
Upon completion of the histopathological diagnosis, additional
10-µm-thick sections were placed on glass slides, and were compared
with haematoxylin and eosin (H&E)-stained slides from the same
block to identify histologically distinct (tumour-rich) tissue
regions. Tissue blocks from 14 patients diagnosed with melanoma
in situ or invasive melanoma were selected from the biobank
of clinical material at St James's Hospital; the samples were
originally obtained at biopsy between January and December 2013.
Table I describes the clinical
information of the patients included.
 | Table I.Clinical data. |
Table I.
Clinical data.
| A, Melanoma in
situ |
|---|
|
|---|
| No. naevi |
| Age, years |
| Gender |
|---|
| 100 |
| 44 |
| 1 |
| 20 |
| 48 |
| 0 |
| 100 |
| 60 |
| 0 |
| 10 |
| 74 |
| 1 |
| 0 |
| 77 |
| 0 |
|
| B, Invasive
melanoma |
|
| No. naevi | Age, years | Gender | Stage | Breslow depth,
mm |
|
| 100 | 58 | 1 | 1a | 0.59 |
| 8 | 44 | 1 | 1a | 0.36 |
| 0 | 69 | 0 | 1a | 0.16 |
| 50 | 52 | 0 | 1a | 0.93 |
| 50 | 65 | 0 | 3 | 1.90 |
| 50 | 61 | 1 | 1a | 0.40 |
| 100 | 46 | 0 | 1b | 0.76 |
| 50 | 18 | 0 | 3 | 0.77 |
| 0 | 51 | 1 | 1b | 0.78 |
FASP
Melanoma in situ or invasive melanoma tissue
was identified by comparing the sections to those stained with
H&E. These specific areas from the tissue sections were removed
from the glass slides with a scalpel and placed in microtubes.
Paraffin was removed from the tissue slices by successive
incubations in xylene (2X) and absolute ethanol (2X), and the
samples were then rehydrated in a series of 97, 80, 70 and 50%
ethanol solutions in water. Following vacuum-drying, 10 mg of dried
tissue was weighed out and resuspended in 200 µl of UPX Universal
Protein Extraction Buffer, which was provided in the FFPE-FASP
Protein Digestion kit (Expedeon, Swavesey, UK), and protein
concentrations of the FFPE-FASP-treated samples were determined
using the RC DC Protein Assay kit (Bio-Rad Laboratories, Inc.,
Hercules, CA, USA).
Next, detergent was depleted from the lysates (50
µl), and proteins were digested with trypsin. Briefly, to YM-30
filter units (Merck Millipore, Carrigtwohill, Ireland) containing
protein concentrates, 200 µl of 8 M urea in 0.1 M Tris/HCl (pH 8.5)
was added, and the samples were centrifuged at 14,000 × g at 20°C
for 15 min. This step was repeated once. Then, 50 µl of 0.05 M
iodoacetamide in 8 M urea was added to the filters, and the samples
were incubated in the darkness for 20 min. The filters were washed
twice with 100 µl of 8 M UA, followed by two washes with 100 µl of
50 mM NH4HCO3. Finally, trypsin (Promega Corporation, Madison, WI,
USA) was added in 40 µl of 50 mM NH4HCO3 to each filter at an
enzyme:protein ratio of 1:50. The samples were incubated overnight
at 37°C, and peptides were collected by centrifugation (14,000 × g,
10 min at 4°C), followed by an additional wash with an elution
solution [70% acetonitrile (ACN) and 1% formic acid]. Finally, the
peptide mixture was brought to dryness and reconstituted in sample
buffer (2% ACN and 0.1% formic acid). To ensure an even suspension
of peptide populations, samples were briefly vortexed and sonicated
(16).
LC-MS/MS analysis
LC-MS/MS analysis of in situ vs. invasive
FFPE tissue was performed using an UltiMate® 3000 Nano
LC system (Dionex Corporation; Thermo Fisher Scientific, Inc.,
Waltham, MA, USA) coupled to a an LTQ Orbitrap XL™ mass
spectrometre (Thermo Fisher Scientific, Inc.) in the Proteomics
Facility of the National Institute for Cellular Biotechnology,
Dublin City University (Dublin, Ireland). The optimized methodology
has been previously described in detail (17). Peptide mixtures (5-µl volume) were
loaded onto a C18 trap column [Acclaim™ PepMap™ 100 C18 LC column;
300 mm internal diameter (id) × 5 mm, 5 mm particle size, 100 Å
pore size; Dionex Corporation; Thermo Fisher Scientific, Inc.).
Desalting was achieved at a flow rate of 25 µl/min in 0.1%
trifluoroacetic acid for 3 min. The trap column was switched online
with an analytical Acclaim™ PepMap™ 100 C18 LC column (75 mm id ×
500 mm, 3 mm particle size and 100 Å pore size; Dionex Corporation;
Thermo Fisher Scientific, Inc.). The peptides generated from the
digestion were eluted with the following binary gradients: Solvent
A (2% ACN and 0.1% formic acid in LC-MS-grade water) and 0–25%
solvent B (80% ACN and 0.08% formic acid in LC-MS-grade water) for
160 mins, followed by 25–50% solvent B for additional 20 min. The
column flow rate was set to 350 nl/min. Data was acquired with
Xcalibur™ software version 2.0.7 (Thermo Fisher Scientific, Inc.).
The mass spectrometre was operated in data-dependent mode and
externally calibrated. Survey MS scans were acquired in the LTQ
Orbitrap XL™ in the 400–1,800 mass/charge (m/z) range, with the
resolution set to a value of 30,000 at m/z=400 and
the lock mass set to 445.120025 m/z. Collision-induced dissociation
fragmentation was conducted in the linear ion trap with the three
most intense ions per scan. Within 40 sec, a dynamic exclusion
window was applied. A normalised collision energy of 35%, an
isolation window of 2 m/z and one microscan were used
to collect suitable MS/MS spectra.
Data analysis and quantitative
profiling
Processing of the raw data generated from LC-MS/MS
analysis was performed with Progenesis label-free LC-MS software
version 3.1 (Nonlinear Dynamics, Newcastle upon Tyne, UK). Data
alignment was based on the LC retention time of each sample
(17). A reference sample was
established, the retention times of all other replicates were
aligned to this reference and peak intensities were then
normalised. Prior to exporting the MS/MS output files to Mascot
software (www.matrixscience.com) for protein identification, a
number of criteria were employed to filter the data, including: i)
Peptide features with analysis of variance (ANOVA) score of
<0.05 between experimental groups, ii) mass peaks (features)
with charge states +1, +2 and +3; and iii) data with >1
isotope/peptide. A Mascot generic file was generated from all the
exported MS/MS spectra from the aforementioned Progenesis software,
which was used for peptide identification with Mascot software
version 2.2, and searched against the UniProtKB-SwissProt database
(www.uniprot.org) with 16,638 proteins (taxonomy,
Homo sapiens). The following search parameters were used for
protein identification: i) MS/MS mass tolerance set at 0.5 Da; ii)
peptide mass tolerance set to 20 ppm; iii) carbamidomethylation set
as a fixed modification; iv) ≤2 missed cleavages were allowed; and
v) methionine oxidation set as a variable modification. For further
consideration and re-importation back into Progenesis label-free
LC-MS software for further analysis, only peptides with ion scores
≥40 were selected. Importantly, the following criteria were applied
to assign a plasma associated protein as properly identified: i) An
ANOVA score between experimental groups of ≤0.05, ii) proteins with
≥2 peptides matched; and iii) a Mascot score of >40.
Immunohistochemistry (IHC)
Two proteins that were observed to be highly
expressed in invasive melanoma vs. in situ melanoma were
selected for validation by IHC analysis using commercially
available melanoma cancer tissue microarrays (TMAs; ME208; US
Biomax, Inc., Rockville, MD, USA), which comprised triplicate
tissue cores from primary (n=30) and metastatic (n=30) melanoma.
TMAs were stained for 14-3-3ε and fatty acid synthase (FASN)
expression using specific anti-14-3-3ε (NBP1-32695; Novus
Biologicals, Ltd., Cambridge, UK) and anti-FASN (C20G5; Cell
Signalling Technology, Inc., Danvers, MA, USA) polyclonal
antibodies. Deparaffinisation and antigen retrieval was performed
using Dako Target Retrieval Solution, pH 6 (Dako, Glostrup,
Denmark) and the PT Link system (Dako). Slides were heated to 97°C
for 20 min and then cooled to 65°C. IHC analyses were performed
using the Dako Autostainer Plus staining system according to the
manufacturer's protocol. Dual Endogenous Enzyme Block (S2003; Dako)
was applied to the TMAs to block endogenous peroxidase,
pseudoperoxidase and alkaline phosphatase activities. The EnVision
G|2 System/AP (K5355; Dako) was used for amplification and
visualisation of bound anti-FASN and anti-14-3-3ε antibodies using
an automated IHC staining apparatus (Autostainer Plus; Dako)
according to the manufacturer's protocol. Briefly, primary
antibodies were optimally diluted in REAL™ Antibody Diluent
(14–3-3ε; 1:800; Dako) or SignalStain® Antibody Diluent
(FASN; 1:50; Cell Signalling Technology, Inc.). Optimum primary
antibody dilutions were predetermined using full-face sections of
known positive-control tissues (invasive ductal breast carcinoma,
FASN; and placenta, 14-3-3ε). Primary antibodies were applied for
30 min at room temperature, and then all the immunostained slides
were counterstained with haematoxylin (Dako), rinsed in deionised
water, washed in buffer and glass-mounted using Faramount mounting
solution (Dako). Negative-control (where the primary antibody was
omitted and replaced instead by antibody diluent) and appropriate
positive-control slides were processed at the same time.
IHC scoring
Scores were assigned based on the staining intensity
of 14-3-3ε and FASN. Stained cores were deemed negative (no
staining), weakly positive, moderately positive or strongly
positive. If a core was uninformative (lost during the procedure or
very highly pigmented), the overall score was that of the remaining
core(s). A consensus score was assigned where discordant scoring
results (cores from same tumour with different scores) were
obtained (for example, scores of positive, positive and weak
assigned an overall score of positive).
Bioinformatics analysis of potential
protein interactions
Standard bioinformatics software programmes
(string-db.org/) were applied to catalog the
clustering of molecular functions and to identify potential protein
interactions of the MS-identified statistically significant
proteins when comparing in situ vs. invasive melanoma FFPE
tissues. Analyses were performed using STRING version 9.1
(http://string-db.org/), a database of known and
predicted protein interactions that include direct physical and
indirect functional protein associations (18).
Results
MS analysis
Label-free LC-MS/MS analysis revealed significant
changes in 184 FFPE tissue-associated proteins from in situ
vs. invasive melanoma. This number included identification based on
only one matched peptide (data not shown). For the final
establishment of the list of altered components, only proteins with
≥2 matched peptides and a Mascot score >40 were assigned as
properly identified FFPE-tissue proteins. Excluding protein hits
with only one matched peptide, 80 altered proteins were clearly
identified when comparing FFPE tissue from in situ vs.
invasive melanoma (Table II). As
listed in Table II, 64 proteins
exhibited an increased abundance, while 16 proteins exhibited a
decreased abundance when comparing invasive vs. in situ
melanoma. The most statistically significant protein observed to be
increased in invasive melanoma was phosphatidylethanolamine-binding
protein 1 (4.04-fold, P≤0.001), and the most significant decreased
protein was hornerin (7.24-fold, P≤0.001).
| Table II.List of differentially expressed
proteins in in situ vs. invasive melanoma formalin-fixed,
paraffin-embedded tissues. |
Table II.
List of differentially expressed
proteins in in situ vs. invasive melanoma formalin-fixed,
paraffin-embedded tissues.
| A, Upregulated
proteins in invasive melanoma vs. in situ melanoma |
|---|
|
|---|
| Gene name | Protein
identification | Peptide count | Confidence
scorea | ANOVA
(P-value) | Fold-change |
|---|
| PEBP1 |
Phosphatidylethanolamine-binding protein
1 | 2 | 118.45 | 0.0000 | 4.04 |
| HNRNPK | Heterogeneous
nuclear ribonucleoprotein K | 4 | 273.85 | 0.0002 | 4.63 |
| EEF2 | Elongation factor
2 | 7 | 418.22 | 0.0002 | 5.50 |
| HSP90B1 | Endoplasmin | 3 | 221.46 | 0.0003 | 2.57 |
| PSAP | Proactivator
polypeptide | 2 | 92.05 | 0.0005 | 5.83 |
| HSP90AB1 | Heat shock protein
HSP 90-beta | 4 | 300.79 | 0.0006 | 2.58 |
| HSPA5 | 78 kDa
glucose-regulated protein | 3 | 176.94 | 0.0007 | 2.45 |
| PPIA | Peptidyl-prolyl
cis-trans isomerase A | 3 | 258.37 | 0.0008 | 2.91 |
| FLNA | Filamin-A | 5 | 260.43 | 0.0010 | 5.75 |
| PGK1 | Phosphoglycerate
kinase 1 | 4 | 328.39 | 0.0012 | 2.80 |
| TPI1 | Triosephosphate
isomerase | 2 | 185.99 | 0.0014 | 3.98 |
| GSTP1 | Glutathione
S-transferase P | 4 | 301.10 | 0.0014 | 2.61 |
| VCP | Transitional
endoplasmic reticulum ATPase | 3 | 238.53 | 0.0015 | 2.53 |
| KRT31 | Keratin, type I
cuticular Ha1 | 3 | 150.13 | 0.0015 | 22.11 |
| YWHAB | 14-3-3 protein
beta/alpha | 3 | 278.01 | 0.0016 | 1.65 |
| PKM | Pyruvate kinase
isozymes M1/M2 | 6 | 405.02 | 0.0024 | 3.78 |
| FBN1 | Fibrillin-1 | 4 | 245.97 | 0.0030 | 9.02 |
| FABP5 | Fatty acid-binding
protein, epidermal | 3 | 179.44 | 0.0047 | 4.03 |
| PLEC | Plectin | 3 | 175.04 | 0.0050 | 2.85 |
| MDH2 | Malate
dehydrogenase, mitochondrial | 3 | 181.57 | 0.0053 | 2.52 |
| COL6A1 | Collagen
alpha-1(VI) chain | 6 | 444.60 | 0.0053 | 3.83 |
| PDIA3 | Protein
disulfide-isomerase A3 | 2 | 116.05 | 0.0054 | 3.27 |
| RPS12 | 40S ribosomal
protein S12 | 2 | 99.78 | 0.0061 | 2.98 |
| ACTB | Actin, cytoplasmic
1 | 9 | 640.45 | 0.0066 | 3.14 |
| PCBP1 | Poly(rC)-binding
protein 1 | 3 | 183.71 | 0.0067 | 2.54 |
| TUBB2B | Tubulin beta-2B
chain | 7 | 487.19 | 0.0073 | 6.87 |
| GAPDH |
Glyceraldehyde-3-phosphate
dehydrogenase | 3 | 290.29 | 0.0075 | 2.64 |
| OLFML1 | Olfactomedin-like
protein 1 | 3 | 180.42 | 0.0078 | 2.86 |
| PRDX6 |
Peroxiredoxin-6 | 2 | 125.87 | 0.0086 | 3.32 |
| LGALS1 | Galectin-1 | 2 | 122.70 | 0.0088 | 5.05 |
| VIM | Vimentin | 4 | 257.04 | 0.0097 | 2.16 |
| TUBA1A | Tubulin alpha-1A
chain | 2 | 152.25 | 0.0098 | 2.77 |
| TUBA4A | Tubulin alpha-4A
chain | 3 | 232.50 | 0.0103 | 2.58 |
| ENO1 | Alpha-enolase | 4 | 352.14 | 0.0105 | 1.46 |
| COL6A2 | Collagen
alpha-2(VI) chain | 4 | 330.08 | 0.0111 | 2.23 |
| DPYSL2 |
Dihydropyrimidinase-related protein 2 | 3 | 284.36 | 0.0113 | 2.06 |
| FASN | Fatty acid
synthase | 6 | 441.55 | 0.0134 | 3.19 |
| YWHAE | 14-3-3 protein
epsilon | 2 | 135.71 | 0.0135 | 8.98 |
| PLIN3 | Perilipin-3 | 2 | 115.71 | 0.0150 | 1.66 |
| ACTC1 | Actin, alpha
cardiac muscle 1 | 5 | 258.90 | 0.0150 | 1.91 |
| TUBB | Tubulin beta
chain | 7 | 505.61 | 0.0151 | 1.81 |
| AMBP | Protein AMBP | 2 | 123.71 | 0.0155 | 2.56 |
| ALDOA |
Fructose-bisphosphate aldolase A | 2 | 223.37 | 0.0161 | 1.85 |
| ALB | Serum albumin | 20 | 1632.42 | 0.0162 | 3.94 |
| PDIA6 | Protein
disulfide-isomerase A6 | 2 | 125.31 | 0.0162 | 2.29 |
| HSPD1 | 60 kDa heat shock
protein, mitochondrial | 2 | 197.72 | 0.0166 | 2.66 |
| YWHAZ | 14-3-3 protein
zeta/delta | 3 | 166.90 | 0.0171 | 2.95 |
| HLA-A | Human leukocyte
antigen class I | 2 | 150.32 | 0.0195 | 7.68 |
| ACTN1 |
Alpha-actinin-1 | 3 | 167.03 | 0.0197 | 4.05 |
| UBA1 | Ubiquitin-like
modifier-activating enzyme 1 | 2 | 106.53 | 0.0200 | 1.81 |
| ACTN4 |
Alpha-actinin-4 | 4 | 284.64 | 0.0226 | 4.13 |
| SERPINF1 | Pigment
epithelium-derived factor | 2 | 130.19 | 0.0247 | 2.24 |
| CALM1 | Calmodulin | 3 | 286.87 | 0.0255 | 1.55 |
| NPM1 | Nucleophosmin | 2 | 154.40 | 0.0278 | 2.32 |
| YWHAQ | 14-3-3 protein
theta | 2 | 125.98 | 0.0287 | 7.12 |
| TUBB4A | Tubulin beta-4A
chain | 7 | 497.08 | 0.0307 | 3.63 |
| CLEC3B | Tetranectin | 2 | 114.64 | 0.0319 | 4.37 |
| ACSL1 |
Long-chain-fatty-acid-CoA ligase 1 | 2 | 120.91 | 0.0327 | 3.10 |
| HNRNPA2B1 | Heterogeneous
nuclear ribonucleoproteins A2/B1 | 2 | 204.90 | 0.0350 | 2.17 |
| COL14A1 | Collagen
alpha-1(XIV) chain | 2 | 147.41 | 0.0375 | 2.20 |
| IGHG3 | Ig gamma-3 chain C
region | 2 | 128.39 | 0.0402 | 1.54 |
| TF |
Serotransferrin | 7 | 626.01 | 0.0405 | 3.70 |
| BGN | Biglycan | 2 | 119.89 | 0.0433 | 2.49 |
| EZR | Ezrin | 2 | 111.07 | 0.0458 | 12.78 |
|
| B, Downregulated
proteins in invasive melanoma vs. in situ melanoma |
|
| Gene name | Protein
identification | Peptide count | Confidence
scorea | ANOVA
(P-value) | Fold-change |
|
| HRNR | Hornerin | 2 | 144.28 | 0.0003 | 7.24 |
| ITIH1 | Inter-alpha-trypsin
inhibitor heavy chain H1 | 3 | 219.20 | 0.0021 | 1.78 |
| DSP | Desmoplakin | 16 | 956.60 | 0.0030 | 6.70 |
| KRT9 | Keratin, type I
cytoskeletal 9 | 31 | 3005.85 | 0.0030 | 4.25 |
| KRT1 | Keratin, type II
cytoskeletal 1 | 34 | 2801.68 | 0.0042 | 3.04 |
| DCD | Dermcidin | 2 | 136.27 | 0.0047 | 4.12 |
| LGALS7 | Galectin-7 | 3 | 395.32 | 0.0058 | 1.78 |
| CAT | Catalase | 3 | 223.78 | 0.0089 | 1.62 |
| ATP5A1 | ATP synthase
subunit alpha, mitochondrial | 3 | 258.83 | 0.0101 | 2.11 |
| IGHA1 | Ig alpha-1 chain C
region | 2 | 188.63 | 0.0108 | 2.24 |
| CALML5 | Calmodulin-like
protein 5 | 2 | 175.25 | 0.0113 | 3.72 |
| KRT2 | Keratin, type II
cytoskeletal 2 epidermal | 24 | 2034.24 | 0.0113 | 3.23 |
| KRT10 | Keratin, type I
cytoskeletal 10 | 19 | 1719.86 | 0.0147 | 2.54 |
| FLG2 | Filaggrin-2 | 2 | 129.72 | 0.0229 | 2.75 |
| HSPB1 | Heat shock protein
beta-1 | 2 | 125.22 | 0.0242 | 1.61 |
| MSN | Moesin | 2 | 109.96 | 0.0479 | 2.09 |
Protein-protein interactions
The existence of potential interactions between
proteins with a changed abundance in in situ vs. invasive
FFPE melanoma tissue, as identified by the proteomics survey
presented in the current study, was evaluated using the STRING
database of direct physical and indirect functional protein
interactions. The bioinformatic analysis resulted in a complex
interaction map (Fig. 1). Main
interaction nodes included proteins involved in metabolism
(triosephosphate isomerase, peroxiredoxin-6, fructose-bisphosphate
aldolase A, long-chain-fatty-acid-CoA ligase 1, malate
dehydrogenase, mitochondrial, glyceraldehyde-3-phosphate
dehydrogenase, phosphoglycerate kinase 1, pyruvate kinase isozymes
M1/M2 and FASN), which were discovered to be elevated in invasive
melanoma compared with in situ melanoma. In addition,
proteins associated with the phosphoinositide 3-kinase (PI3K)-Akt
signalling pathway were also increased in invasive melanoma FFPE
tissues compared with in situ melanoma FFPE tissues,
including 14-3-3ε, 14-3-3ζ, endoplasmin, 14-3-3α/β, 14-3-3ζ/δ, heat
shock protein HSP 90-β, collagen α-2(VI) chain and collagen α-1(VI)
chain).
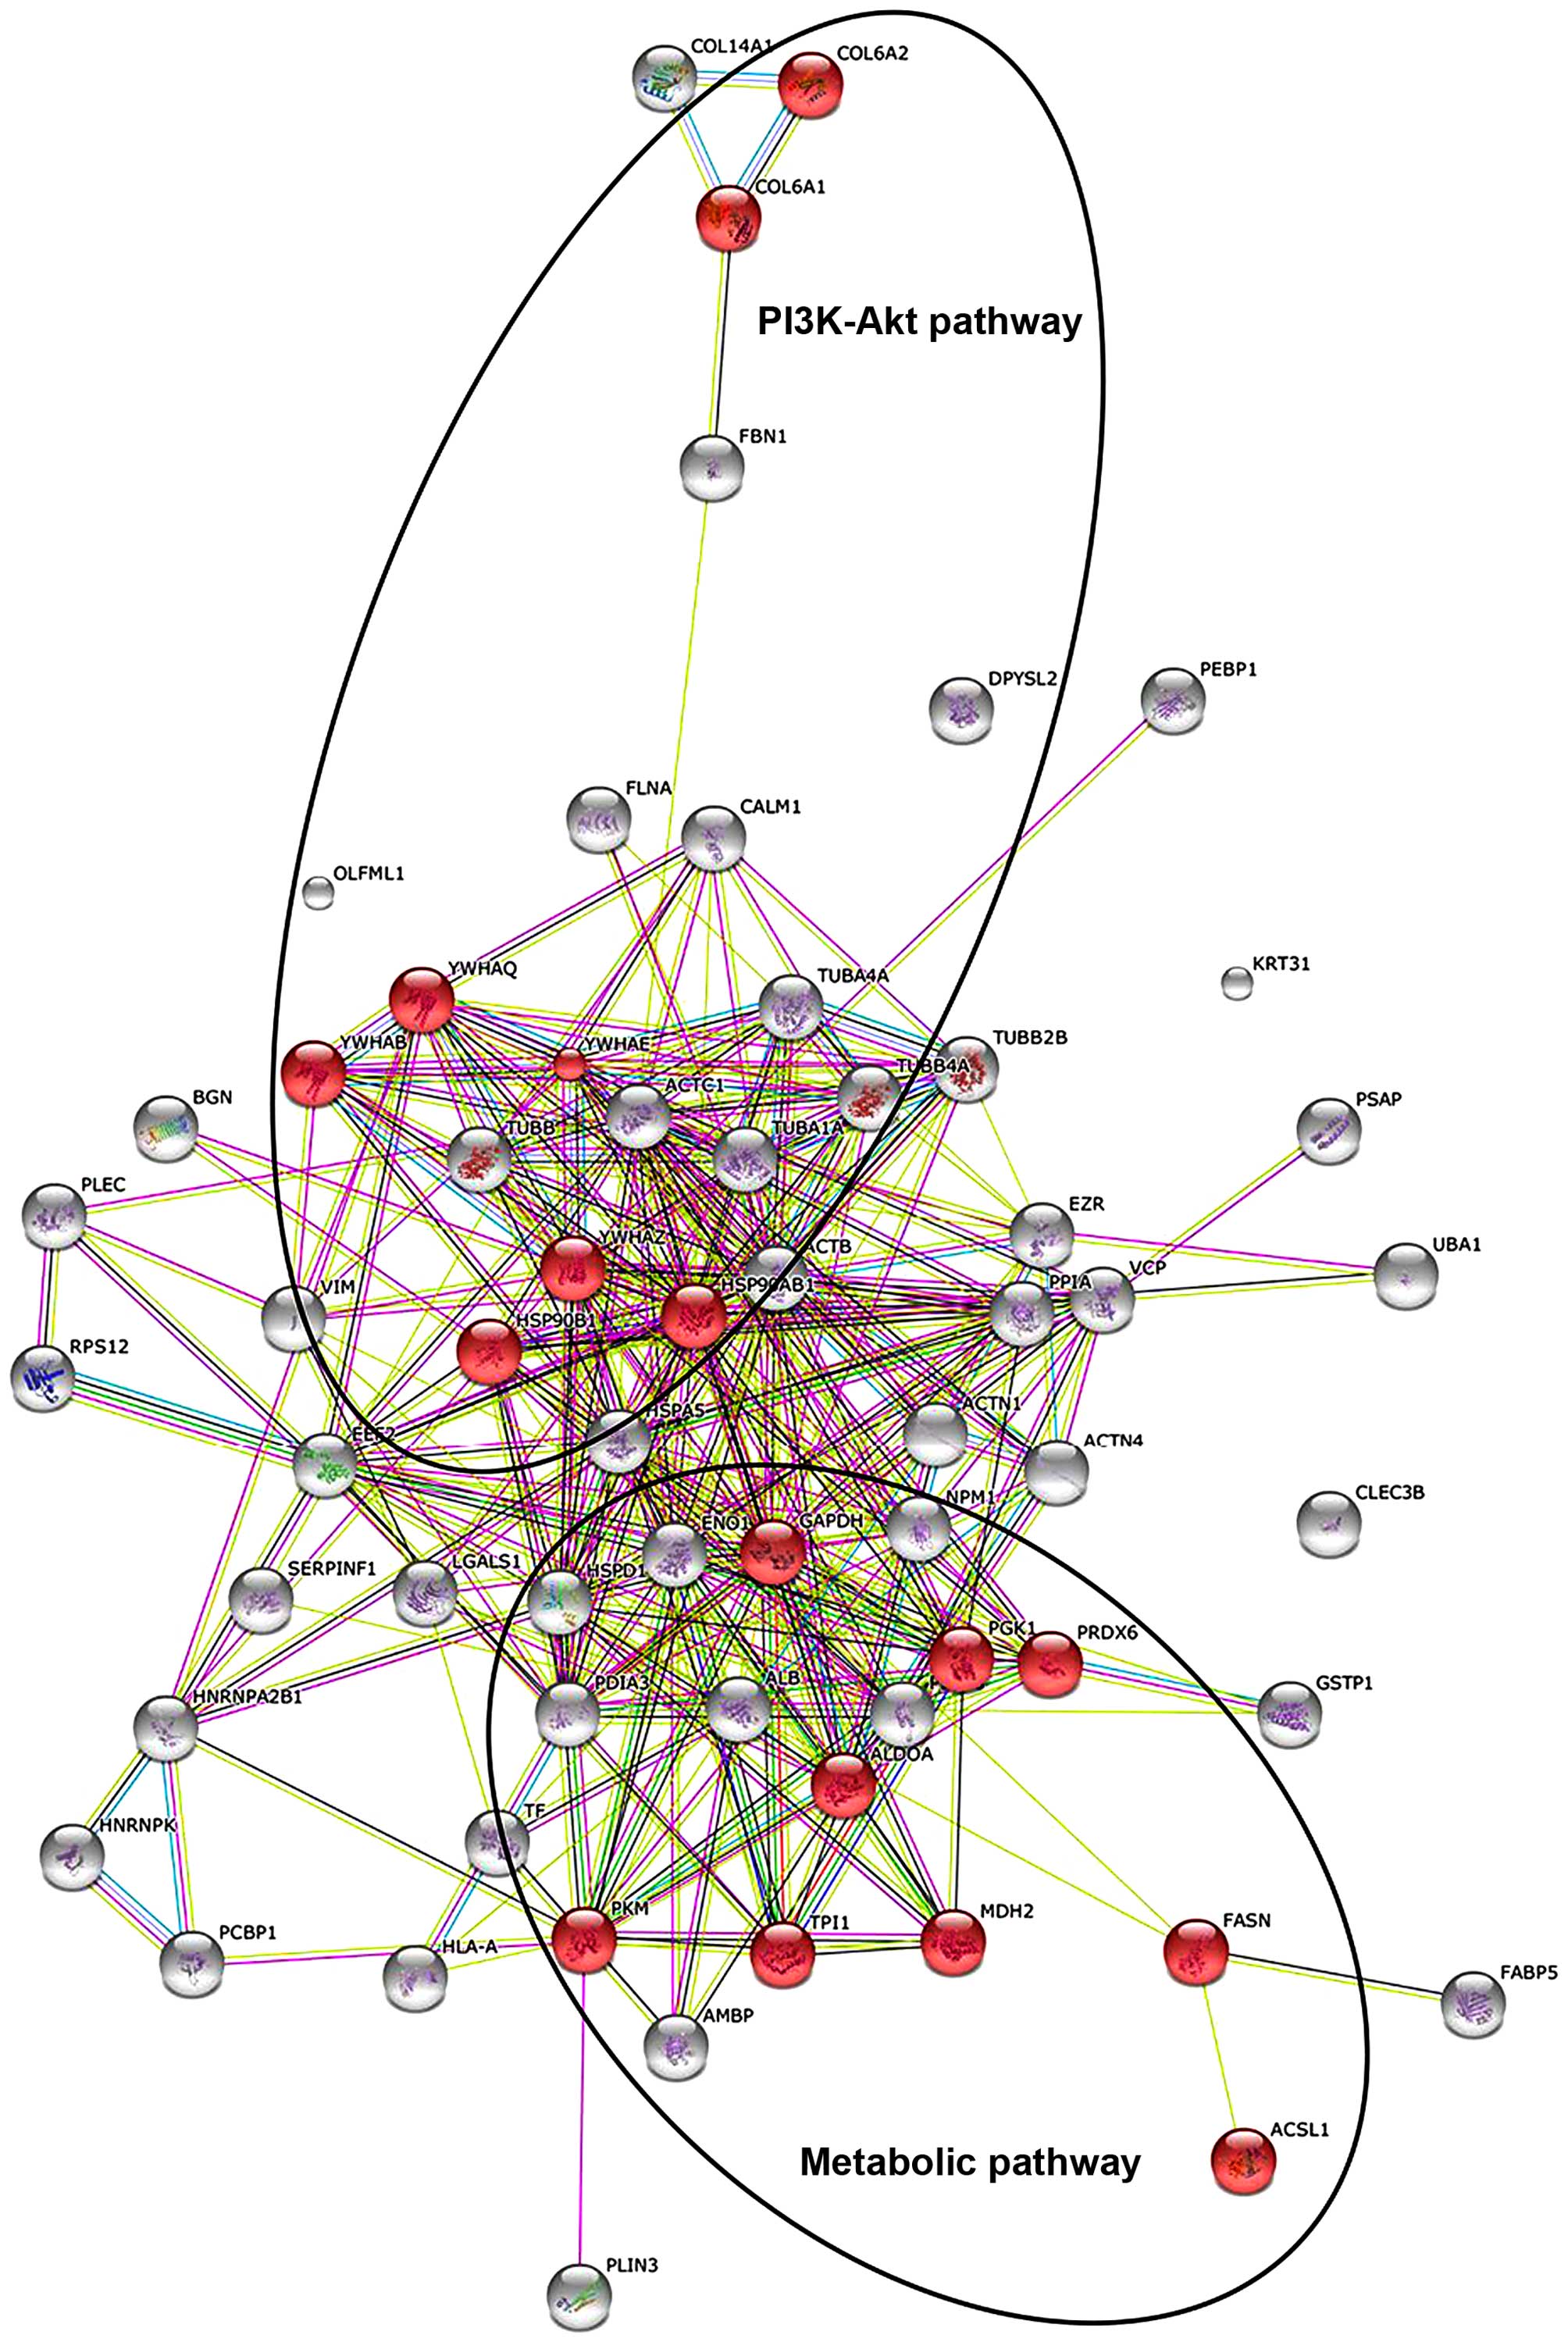 | Figure 1.STRING analysis of metabolic and
PI3K-Akt signalling pathways. STRING analysis, generating
functional protein association networks, displays 64 proteins
discovered to be upregulated in invasive melanoma compared with
in situ melanoma, as listed in Table II. Highlighted in red are nine
proteins that participate in metabolism (TPI1, PRDX6, ALDOA, ACSL1,
MDH2, GAPDH, PGK1, PKM and FASN) and eight proteins that
participate in the PI3K-Akt signalling pathway (YWHAE, YWHAQ,
HSP90B1, YWHAB, YWHAZ, HSP90AB1, COL6A2 and COL6A1). PI3K,
phosphoinositide 3-kinase; TPI1, triosephosphate isomerase; PRDX6,
peroxiredoxin-6; ALDOA, fructose-bisphosphate aldolase A; ACSL1,
acyl-CoA synthetase long-chain family member 1; MDH2, malate
dehydrogenase, mitochondrial; GAPDH, glyceraldehyde-3-phosphate
dehydrogenase; PGK1, phosphoglycerate kinase 1; PKM, pyruvate
kinase isozymes M1/M2; FASN, fatty acid synthase; YWHAE, 14-3-3ε;
YWHAQ, 14-3-3ζ; HSP90B1, endoplasmin; YWHAB, 14-3-3α/β; YWHAZ,
14-3-3ζ/δ; HSP90AB1, heat shock protein HSP 90-β; COL6A2, collagen
α-2(VI) chain; COL6A1, collagen α-1(VI) chain. |
IHC
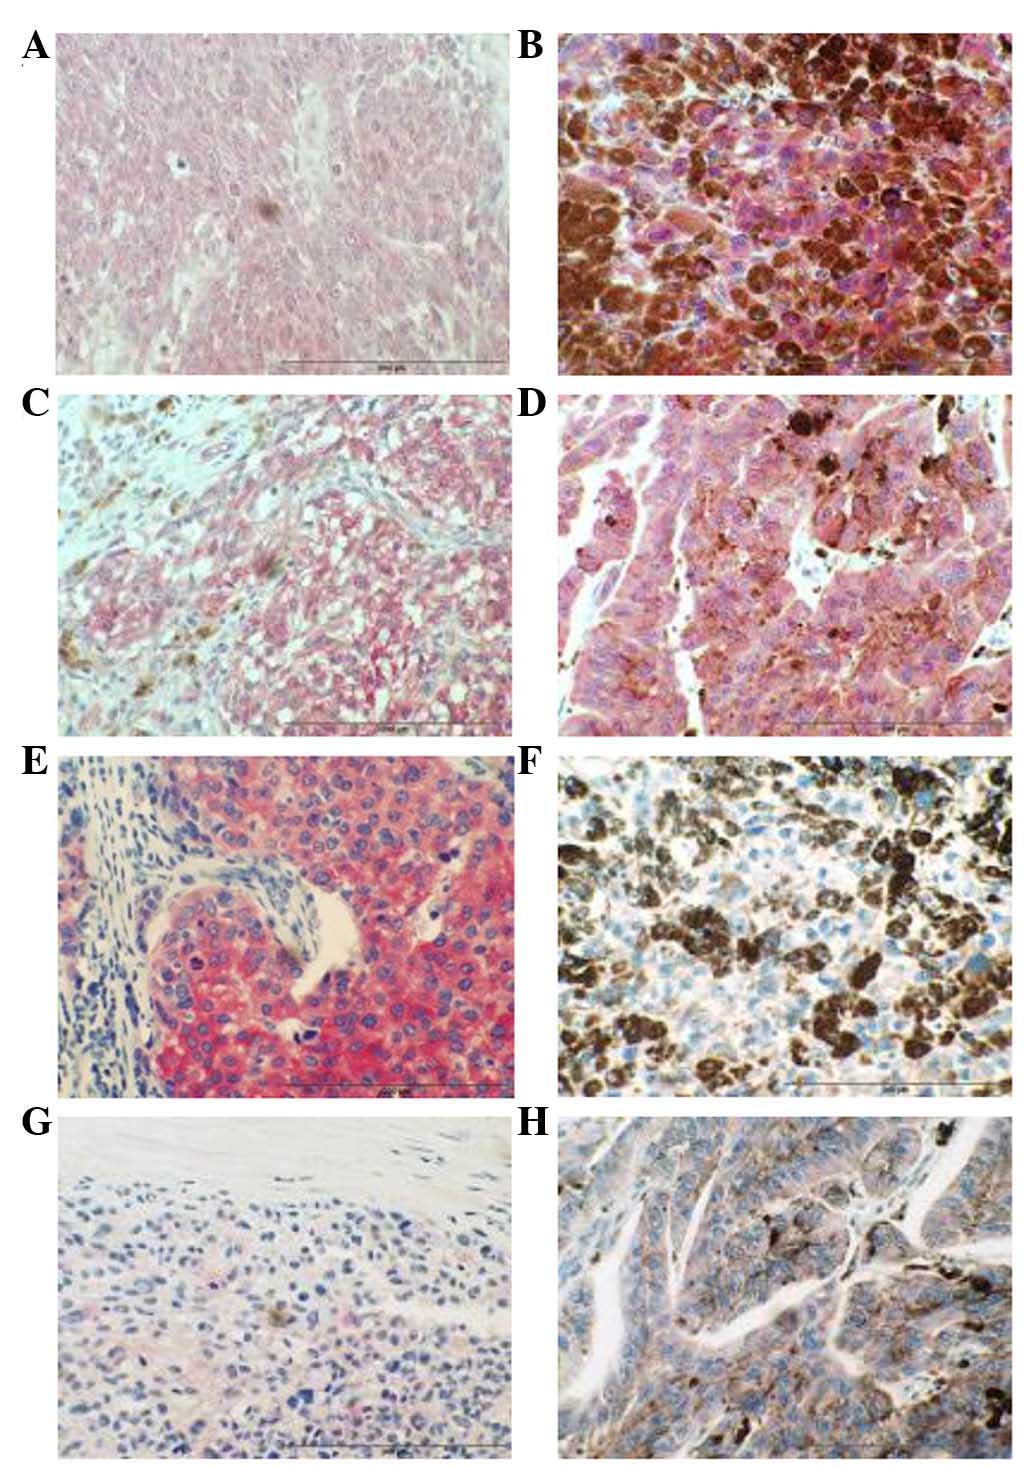
IHC analysis of FASN in a cohort of primary melanoma
tumour samples (n=28) and a cohort of metastatic melanoma tumours
(n=29) revealed that a higher percentage (72%) of metastatic
melanomas exhibited FASN immunoreactivity (weak/moderate) compared
with primary tissue (50%), (Fig. 2
and Table III). Furthermore, a
greater number of primary tumours (50%) exhibited negative FASN
immunoreactivity, compared with metastatic tumours (28%). IHC
results also indicate that 14-3-3ε, a member of the 14-3-3 family
of proteins, may be associated with melanoma disease progression,
since a greater number of metastatic tumours exhibited strong
14-3-3ε immunoreactivity (57%) compared with primary melanomas
(32%) (Fig. 2 and Table III).
| Table III.Immunohistochemistry analysis of FASN
and 14-3-3ε in normal, primary and metastatic melanoma tissues. |
Table III.
Immunohistochemistry analysis of FASN
and 14-3-3ε in normal, primary and metastatic melanoma tissues.
| A, FASN | Intensity
scores |
|---|
| Normal (n=3) | Negative | 3/3 |
| Primary melanomas
(n=28) | Negative | 14/28 |
|
| Weak | 9/28 |
|
| Moderate | 5/28 |
|
| Strong | 0/28 |
| Metastatic
melanomas (n=29) | Negative | 8/29 |
|
| Weak | 11/29 |
|
| Moderate | 10/29 |
|
| Strong | 0/29 |
|
| B, 14-3-3ε | Intensity
scores |
|
| Normal (n=3) | Moderate | 3/3 |
| Primary melanomas
(n=28) | Weak | 6/28 |
|
| Moderate | 13/28 |
|
| Strong | 9/28 |
| Metastatic
melanomas (n=30) | Negative | 1/30 |
|
| Weak | 2/30 |
|
| Moderate | 10/30 |
|
| Strong | 17/30 |
Discussion
Molecular pathways regulating melanoma initiation
and progression may represent potential targets of therapeutic
development for this aggressive cancer. To gain additional
understanding into the mechanism by which melanoma in situ,
which is confined to the epidermis, progresses into invasive
melanoma at the protein level, label-free MS analysis of FFPE
tissue using the FASP methodology was applied in the present study
to identify proteins differentially expressed between these two
stages of melanoma. The FASP method presents numerous advantages
over alternative approaches for analysing FFPE tissues,
particularly the ability to buffer-exchange the sample into a more
digestion-compatible solution, thus facilitating the classification
of large numbers of disease-associated proteins (19).
Using this approach, a number of proteins were
identified that were significantly increased in invasive melanoma
compared with melanoma in situ. Proteins associated with
alterations in the majority of cancer cells use glucose at high
levels and convert it into lactate instead of relying on
mitochondrial oxidative phosphorylation to generate energy, even
with adequate oxygen levels, a phenomenon termed the ‘Warburg
effect’ (20). A decisive consequence
of this altered metabolism is the amplification of lactate
production in tumour cells, resulting in a low pH created by
extracellular acidification (21).
This process provides a favorable microenvironment for the
activation of proteases, which induce extracellular matrix
degradation and assist tumour cells to metastasize (22). The enzymes involved in glycolysis also
play a vital part in tumour migration and invasion (23). Pyruvate kinase M2 (PKM2), an embryonic
isoform predominantly expressed in malignant cells, catalyzes the
conversion of phosphoenolpyruvate to pyruvate (24). In the present study, PKM2 was observed
to be significantly elevated in invasive melanoma tissue compared
with in situ melanoma tissue. Clinical evidence of PKM2
contribution to tumourigenesis includes reported increased serum
levels of this protein in colon and breast cancer patients
(25,26). The elevation of PKM2 is associated
with a poor prognosis in small cell lung cancer and in head and
neck cancer (24,27,28). High
expression of PKM2 and two other glycolytic proteins has been
associated with a poor outcome in stage-2 melanoma (29). This finding of increased levels of
PKM2 further implicates a potential role for this glycolytic
protein in melanoma disease progression.
A second metabolic-associated protein discovered to
be significantly elevated in invasive melanoma is FASN, a key
protein involved in the metabolism of cancer cells (30). In order to validate this finding and
other selected proteins, the expression levels of FASN and 14-3-3ε
were further investigated in melanoma samples. 14-3-3ε, one of the
members of the 14-3-3 family of proteins that is considered to
participate in the PI3K-Akt signalling pathway (31), was upregulated in invasive melanoma. A
number of proteins involved in the PI3K-Akt signalling pathway were
also observed to be increased in invasive melanoma. An ideal
follow-up validation study would have involved IHC analysis of
protein expression in archival material from the same patients used
for the current FASP proteomics study; however, this was not
feasible due to the limited amount of tissue available. In
addition, at the time of the study, it was not possible to obtain
FFPE slides of in situ melanoma tumours. Thus, IHC analysis
was performed using commercially sourced TMAs of primary invasive
melanoma tumours and metastatic melanoma tumours as a surrogate for
the initial discovery-phase analysis. As well as validating the
expression of candidate proteins in invasive melanoma tumour
tissues, this approach would enable to confirm if these proteins
were associated with a metastatic melanoma phenotype.
FASN is the key enzyme responsible for the synthesis
of fatty acids, catalyzing the conversion of acetyl-CoA and
malonyl-CoA into long-chain fatty acids (32). Normal cells express low levels of FASN
because they use fatty acids from dietary lipids, with the
exception of those that are lipogenic (33). As expected, no FASN immunoreactivity
was observed in normal skin archival samples. FASN expression was
reported to be upregulated in several human cancers, including
prostate, breast, ovarian and lung cancer (34–38). FASN
was significantly elevated in invasive melanoma in the current
study. In cutaneous melanomas, FASN protein expression was
previously associated with Breslow's thickness, and thus, with a
poorer prognosis (39,40). Orlistat (also known as
tetrahydrolipstatin) is a FASN inhibitor that reduces metastases
and angiogenesis in B-16-F10 melanoma cells (41). In the present study, IHC analysis of
FASN in a cohort of primary melanoma tumour samples (n=28) and a
cohort of metastatic melanoma tumours (n=29) revealed that a higher
proportion of metastatic melanomas exhibited FASN immunoreactivity.
Furthermore, a greater number of primary tumours (14/28) exhibited
negative FASN immunoreactivity, compared with metastatic tumours
(8/29). This result provides further evidence that FASN is
potentially involved in the progression of the malignant melanoma
phenotype. The metabolic products of the FASN complex are rapidly
consumed by actively dividing cells, and previous studies
demonstrated that FASN expression is important for tumour growth
and survival, indicating that FASN is a metabolic oncogene
(42). FASN overexpression and the
Warburg effect are widespread metabolic abnormalities in cancer,
and are likely to contribute to the in situ-to-invasive
transition evaluated in the current study. FASN expression in
adipocyte/3T3 cells as well as in breast, prostate and ovarian
cancer cells has previously been suggested to be regulated by the
PI3K/Akt signalling cascade (43–46).
Proteins involved in the PI3K/Akt pathway were also observed to be
significantly increased in invasive melanoma tissue, suggesting the
involvement of this signalling pathway in the observed increased
FASN protein expression. However, while the present validation
studies observed FASN protein overexpression, they did not provide
any information regarding FASN activity.
In melanoma, both the Ras/Raf/MEK/ERK and PI3K-Akt
signalling pathways are constitutively activated through multiple
mechanisms, and thus exert a number of key functions in melanoma
development and progression (47–49). The
ubiquitously expressed 14-3-3 proteins regulate multiple pathways
involved in transformation, including the PI3K-Akt pathway
(50). Phosphorylation-dependent
association with binding partners forms the mechanistic basis for
the essential role for 14-3-3 proteins in modulating kinase
signalling pathways (51). The family
of 14-3-3 proteins comprises seven small molecules termed α/β, ε,
γ, σ, ζ/δ, τ/θ and η, which are expressed in a diversity of tissues
types (52). Four family members were
observed to be significantly elevated in invasive melanoma FFPE
tissue compared with in situ melanoma tissue, including
YWHAE (14-3-3ε), YWHAQ (14-3-3τ/θ), YWHAB (14-3-3α/β) and YWHAZ
(14-3-3ζ/δ). Neal et al reported that 14-3-3ζ overexpression
was significantly associated with increased Akt phosphorylation in
human breast tumours, and that 14-3-3ζ overexpression combined with
strong Akt phosphorylation was significantly associated with
increased recurrence in cancer patients (53). The authors also observed that
knockdown of 14-3-3ζ expression by small interfering RNA in cancer
cell lines and in tumour xenografts reduced Akt phosphorylation
(53). Schultz et al
demonstrated that epigenetic silencing of 14-3-3σ may contribute to
tumour progression in malignant melanoma via loss of cell cycle
control, impaired cellular senescence program and support of
migratory capacity (54), a process
regulated by high levels of gene methylation (55). The IHC studies presented in the
current report indicate that 14-3-3ε may be associated with
melanoma disease progression, since a significant number of
metastatic tumours (17/30) exhibited strong 14-3-3ε
immunoreactivity compared with primary melanomas (9/28). 14-3-3ε
has been reported to upregulate focal adhesion kinase (FAK) via
nuclear factor-κB activation in hepatocellular carcinoma (56). The PI3K-Akt pathway is one of the
downstream pathways implicated in FAK viability signalling
(57).
In summary, the use of FFPE tissue to study protein
changes during tumourogenesis is now a very powerful and
reproducible approach to identify the key molecules involved in
disease progression. In particular, MS and IHC analysis of FASN and
14-3-3ε in normal, primary and metastatic melanoma tissues
demonstrated significant changes in the abundance levels of these
proteins, which play significant roles in metabolic pathways and in
PI3K-Akt signalling, respectively, and are key events in the
establishment of a more invasive/aggressive phenotype in
melanoma.
References
|
1
|
Masters GA, Krilov L, Bailey HH, Brose MS,
Burstein H, Diller LR, Dizon DS, Fine HA, Kalemkerian GP, Moasser
M, et al: Clinical cancer advances 2015: Annual report on progress
against cancer from the American society of clinical oncology. J
Clin Oncol. 33:786–809. 2015. View Article : Google Scholar : PubMed/NCBI
|
|
2
|
Ferlay J, Shin HR, Bray F, Forman D,
Mathers C and Parkin DM: Estimates of worldwide burden of cancer in
2008: GLOBOCAN 2008. Int J Cancer. 127:2893–2917. 2010. View Article : Google Scholar : PubMed/NCBI
|
|
3
|
Miller AJ and Mihm MC Jr: Melanoma. N Engl
J Med. 355:51–65. 2006. View Article : Google Scholar : PubMed/NCBI
|
|
4
|
Boyle GM: Therapy for metastatic melanoma:
An overview and update. Expert Rev Anticancer Ther. 11:725–737.
2011. View Article : Google Scholar : PubMed/NCBI
|
|
5
|
Sullivan R, LoRusso P, Boerner S and
Dummer R: Achievements and challenges of molecular targeted therapy
in melanoma. Am Soc Clin Oncol Educ Book. 2015:177–186. 2015.
View Article : Google Scholar
|
|
6
|
Kalia M: Biomarkers for personalized
oncology: Recent advances and future challenges. Metabolism. 64(3):
Suppl 1. S16–S21. 2015. View Article : Google Scholar : PubMed/NCBI
|
|
7
|
Moschos SJ and Pinnamaneni R: Targeted
therapies in melanoma. Surg Oncol Clin N Am. 24:347–358. 2015.
View Article : Google Scholar : PubMed/NCBI
|
|
8
|
Wang K, Huang C and Nice E: Recent
advances in proteomics: Towards the human proteome. Biomed
Chromatogr. 28:848–857. 2014. View
Article : Google Scholar : PubMed/NCBI
|
|
9
|
Bougnoux AC and Solassol J: The
contribution of proteomics to the identification of biomarkers for
cutaneous malignant melanoma. Clin Biochem. 46:518–523. 2013.
View Article : Google Scholar : PubMed/NCBI
|
|
10
|
Byrum SD, Larson SK, Avaritt NL, Moreland
LE, Mackintosh SG, Cheung WL and Tackett AJ: Quantitative
proteomics identifies activation of hallmark pathways of cancer in
patient melanoma. J Proteomics Bioinform. 6:43–50. 2013. View Article : Google Scholar : PubMed/NCBI
|
|
11
|
Manzini MC, Perez KR, Riske KA, Bozelli JC
Jr, Santos TL, da Silva MA, Saraiva GK, Politi MJ, Valente AP,
Almeida FC, et al: Peptide: lipid ratio and membrane surface charge
determine the mechanism of action of the antimicrobial peptide
BP100. Conformational and functional studies. Biochim Biophys Acta.
1838:1985–1999. 2014. View Article : Google Scholar : PubMed/NCBI
|
|
12
|
Gustafsson OJ, Arentz G and Hoffmann P:
Proteomic developments in the analysis of formalin-fixed tissue.
Biochim Biophys Acta. 1854:559–580. 2015. View Article : Google Scholar : PubMed/NCBI
|
|
13
|
Quesada-Calvo F, Bertrand V, Longuespée R,
Delga A, Mazzucchelli G, Smargiasso N, Baiwir D, Delvenne P,
Malaise M, De Pauw-Gillet MC, et al: Comparison of two FFPE
preparation methods using label-free shotgun proteomics:
Application to tissues of diverticulitis patients. J Proteomics.
112:250–261. 2015. View Article : Google Scholar : PubMed/NCBI
|
|
14
|
Tanca A, Abbondio M, Pisanu S, Pagnozzi D,
Uzzau S and Addis MF: Critical comparison of sample preparation
strategies for shotgun proteomic analysis of formalin-fixed,
paraffin-embedded samples: Insights from liver tissue. Clin
Proteomics. 11:282014. View Article : Google Scholar : PubMed/NCBI
|
|
15
|
Linge A, Kennedy S, O'Flynn D, Beatty S,
Moriarty P, Henry M, Clynes M, Larkin A and Meleady P: Differential
expression of fourteen proteins between uveal melanoma from
patients who subsequently developed distant metastases versus those
who did not. Invest Opthalmol Vis Sci. 53:4634–4643. 2012.
View Article : Google Scholar
|
|
16
|
Ostasiewicz P, Zielinska DF, Mann M and
Wiśniewski JR: Proteome, phosphoproteome, and N-glycoproteome are
quantitatively preserved in formalin-fixed paraffin-embedded tissue
and analyzable by high-resolution mass spectrometry. J Proteome
Res. 9:3688–3700. 2010. View Article : Google Scholar : PubMed/NCBI
|
|
17
|
Dowling P, Hughes DJ, Larkin AM, Larkin
AM, Meiller J, Henry M, Meleady P, Lynch V, Pardini B, Naccarati A,
et al: Elevated levels of 14-3-3 proteins, serotonin, gamma enolase
and pyruvate kinase identified in clinical samples from patients
diagnosed with colorectal cancer. Clin Chim Acta. 441:133–141.
2015. View Article : Google Scholar : PubMed/NCBI
|
|
18
|
Franceschini A, Szklarczyk D, Frankild S,
Kuhn M, Simonovic M, Roth A, Lin J, Minguez P, Bork P, von Mering C
and Jensen LJ: STRING v9.1: Protein-protein interaction networks,
with increased coverage and integration. Nucleic Acids Res.
41:(Database Issue). D808–D815. 2013. View Article : Google Scholar : PubMed/NCBI
|
|
19
|
Shen K, Sun J, Cao X, Zhou D and Li J:
Comparison of different buffers for protein extraction from
formalin-fixed and paraffin-embedded tissue specimens. PLoS One.
10:e01426502015. View Article : Google Scholar : PubMed/NCBI
|
|
20
|
Warburg O, Wind F and Negelein E: THE
metabolism of tumors in the body. J Gen Physiol. 8:519–530. 1927.
View Article : Google Scholar : PubMed/NCBI
|
|
21
|
Böhme I and Bosserhoff AK: Acidic tumor
microenvironment in human melanoma. Pigment Cell Melanoma Res. May
27–2016.(Epub ahead of print). View Article : Google Scholar
|
|
22
|
Han T, Kang D, Ji D, Wang X, Zhan W, Fu M,
Xin HB and Wang JB: How does cancer cell metabolism affect tumor
migration and invasion? Cell Adh Migr. 7:395–403. 2013. View Article : Google Scholar : PubMed/NCBI
|
|
23
|
Fu QF, Liu Y, Fan Y, Hua SN, Qu HY, Dong
SW, Li RL, Zhao MY, Zhen Y, Yu XL, et al: Alpha-enolase promotes
cell glycolysis, growth, migration, and invasion in non-small cell
lung cancer through FAK-mediated PI3K/AKT pathway. J Hematol Oncol.
8:222015. View Article : Google Scholar : PubMed/NCBI
|
|
24
|
Wong N, Ojo D, Yan J and Tang D: PKM2
contributes to cancer metabolism. Cancer Lett. 356:184–191. 2015.
View Article : Google Scholar : PubMed/NCBI
|
|
25
|
Eigenbrodt E, Basenau D, Holthusen S,
Mazurek S and Fischer G: Quantification of tumor type M2 pyruvate
kinase (Tu M2-PK) in human carcinomas. Anticancer Res.
17:3153–3156. 1997.PubMed/NCBI
|
|
26
|
Lüftner D, Mesterharm J, Akrivakis C,
Geppert R, Petrides PE, Wernecke KD and Possinger K: Tumor type M2
pyruvate kinase expression in advanced breast cancer. Anticancer
Res. 20:5077–5082. 2000.PubMed/NCBI
|
|
27
|
Karachaliou N, Papadaki C, Lagoudaki E,
Trypaki M, Sfakianaki M, Koutsopoulos A, Mavroudis D, Stathopoulos
E, Georgoulias V and Souglakos J: Predictive value of BRCA1, ERCC1,
ATP7B, PKM2, TOPOI, TOPΟ-IIA, TOPOIIB and C-MYC genes in patients
with small cell lung cancer (SCLC) who received first line therapy
with cisplatin and etoposide. PLoS One. 8:e746112013. View Article : Google Scholar : PubMed/NCBI
|
|
28
|
Desai S, Ding M, Wang B, Lu Z, Zhao Q,
Shaw K, Yung WK, Weinstein JN, Tan M and Yao J: Tissue-specific
isoform switch and DNA hypomethylation of the pyruvate kinase PKM
gene in human cancers. Oncotarget. 5:8202–8210. 2014. View Article : Google Scholar : PubMed/NCBI
|
|
29
|
Falkenius J, Lundeberg J, Johansson H,
Tuominen R, Frostvik-Stolt M, Hansson J and Brage S Egyhazi: High
expression of glycolytic and pigment proteins is associated with
worse clinical outcome in stage III melanoma. Melanoma Res.
23:452–460. 2013. View Article : Google Scholar : PubMed/NCBI
|
|
30
|
Rossato FA, Zecchin KG, La Guardia PG,
Ortega RM, Alberici LC, Costa RA, Catharino RR, Graner E, Castilho
RF and Vercesi AE: Fatty acid synthase inhibitors induce apoptosis
in non-tumorigenic melan-a cells associated with inhibition of
mitochondrial respiration. PLoS One. 9:e1010602014. View Article : Google Scholar : PubMed/NCBI
|
|
31
|
Tzivion G, Dobson M and Ramakrishnan G:
FoxO transcription factors; Regulation by AKT and 14-3-3 proteins.
Biochim Biophys Acta. 1813:1938–1945. 2011. View Article : Google Scholar : PubMed/NCBI
|
|
32
|
Hopperton KE, Duncan RE, Bazinet RP and
Archer MC: Fatty acid synthase plays a role in cancer metabolism
beyond providing fatty acids for phospholipid synthesis or
sustaining elevations in glycolytic activity. Exp Cell Res.
320:302–310. 2014. View Article : Google Scholar : PubMed/NCBI
|
|
33
|
Menendez JA and Lupu R: Fatty acid
synthase and the lipogenic phenotype in cancer pathogenesis. Nat
Rev Cancer. 7:763–777. 2007. View Article : Google Scholar : PubMed/NCBI
|
|
34
|
Swinnen JV, Roskams T, Joniau S, Van
Poppel H, Oyen R, Baert L, Heyns W and Verhoeven G: Overexpression
of fatty acid synthase is an early and common event in the
development of prostate cancer. Int J Cancer. 98:19–22. 2002.
View Article : Google Scholar : PubMed/NCBI
|
|
35
|
Rossi S, Graner E, Febbo P, Weinstein L,
Bhattacharya N, Onody T, Bubley G, Balk S and Loda M: Fatty acid
synthase expression defines distinct molecular signatures in
prostate cancer. Mol Cancer Res. 1:707–715. 2003.PubMed/NCBI
|
|
36
|
Wang Y, Kuhajda FP, Li JN, Pizer ES, Han
WF, Sokoll LJ and Chan DW: Fatty acid synthase (FAS) expression in
human breast cancer cell culture supernatants and in breast cancer
patients. Cancer Lett. 167:99–104. 2001. View Article : Google Scholar : PubMed/NCBI
|
|
37
|
Bauerschlag DO, Maass N, Leonhardt P,
Verburg FA, Pecks U, Zeppernick F, Morgenroth A, Mottaghy FM, Tolba
R, Meinhold-Heerlein I and Bräutigam K: Fatty acid synthase
overexpression: Target for therapy and reversal of chemoresistance
in ovarian cancer. J Transl Med. 13:1462015. View Article : Google Scholar : PubMed/NCBI
|
|
38
|
Cerne D, Zitnik IP and Sok M: Increased
fatty acid synthase activity in non-small cell lung cancer tissue
is a weaker predictor of shorter patient survival than increased
lipoprotein lipase activity. Arch Med Res. 41:405–409. 2010.
View Article : Google Scholar : PubMed/NCBI
|
|
39
|
Innocenzi D, Alò PL, Balzani A, Sebastiani
V, Silipo V, La Torre G, Ricciardi G, Bosman C and Calvieri S:
Fatty acid synthase expression in melanoma. J Cutan Pathol.
30:23–28. 2003. View Article : Google Scholar : PubMed/NCBI
|
|
40
|
Kapur P, Rakheja D, Roy LC and Hoang MP:
Fatty acid synthase expression in cutaneous melanocytic neoplasms.
Mod Pathol. 18:1107–1112. 2005. View Article : Google Scholar : PubMed/NCBI
|
|
41
|
Seguin F, Carvalho MA, Bastos DC, Agostini
M, Zecchin KG, Alvarez-Flores MP, Chudzinski-Tavassi AM, Coletta RD
and Graner E: The fatty acid synthase inhibitor orlistat reduces
experimental metastases and angiogenesis in B16-F10 melanomas. Br J
Cancer. 107:977–987. 2012. View Article : Google Scholar : PubMed/NCBI
|
|
42
|
Flavin R, Peluso S, Nguyen PL and Loda M:
Fatty acid synthase as a potential therapeutic target in cancer.
Future Oncol. 6:551–562. 2010. View Article : Google Scholar : PubMed/NCBI
|
|
43
|
Yang YA, Han WF, Morin PJ, Chrest FJ and
Pizer ES: Activation of fatty acid synthesis during neoplastic
transformation: Role of mitogen-activated protein kinase and
phosphatidylinositol 3-kinase. Exp Cell Res. 279:80–90. 2002.
View Article : Google Scholar : PubMed/NCBI
|
|
44
|
Van de Sande T, De Schrijver E, Heyns W,
Verhoeven G and Swinnen JV: Role of the phosphatidylinositol
3′-kinase/PTEN/Akt kinase pathway in the overexpression of fatty
acid synthase in LNCaP prostate cancer cells. Cancer Res.
62:642–646. 2002.PubMed/NCBI
|
|
45
|
Wang D and Sul HS: Insulin stimulation of
the fatty acid synthase promoter is mediated by the
phosphatidylinositol 3-kinase pathway. Involvement of protein
kinase B/Akt. J Biol Chem. 273:25420–25426. 1998.
|
|
46
|
Wang HQ, Altomare DA, Skele KL, Poulikakos
PI, Kuhajda FP, Di Cristofano A and Testa JR: Positive feedback
regulation between AKT activation and fatty acid synthase
expression in ovarian carcinoma cells. Oncogene. 24:3574–3582.
2005. View Article : Google Scholar : PubMed/NCBI
|
|
47
|
Chen B, Tardell C, Higgins B, Packman K,
Boylan JF and Niu H: BRAFV600E negatively regulates the AKT pathway
in melanoma cell lines. PLoS One. 7:e425982012. View Article : Google Scholar : PubMed/NCBI
|
|
48
|
Stahl JM, Sharma A, Cheung M, Zimmerman M,
Cheng JQ, Bosenberg MW, Kester M, Sandirasegarane L and Robertson
GP: Deregulated Akt3 activity promotes development of malignant
melanoma. Cancer Res. 64:7002–7010. 2004. View Article : Google Scholar : PubMed/NCBI
|
|
49
|
Meier F, Schittek B, Busch S, Garbe C,
Smalley K, Satyamoorthy K, Li G and Herlyn M: The RAS/RAF/MEK/ERK
and PI3K/AKT signaling pathways present molecular targets for the
effective treatment of advanced melanoma. Front Biosci.
10:2986–3001. 2005. View
Article : Google Scholar : PubMed/NCBI
|
|
50
|
Daitoku H, Sakamaki J and Fukamizu A:
Regulation of FoxO transcription factors by acetylation and
protein-protein interactions. Biochim Biophys Acta. 1813:1954–1960.
2011. View Article : Google Scholar : PubMed/NCBI
|
|
51
|
Freeman AK and Morrison DK: 14-3-3
proteins: Diverse functions in cell proliferation and cancer
progression. Semin Cell Dev Biol. 22:681–687. 2011. View Article : Google Scholar : PubMed/NCBI
|
|
52
|
Tzivion G, Gupta VS, Kaplun L and Balan V:
14-3-3 proteins as potential oncogenes. Semin Cancer Biol.
16:203–213. 2006. View Article : Google Scholar : PubMed/NCBI
|
|
53
|
Neal CL, Xu J, Li P, Mori S, Yang J, Neal
NN, Zhou X, Wyszomierski SL and Yu D: Overexpression of 14-3-3ζ in
cancer cells activates PI3K via binding the p85 regulatory subunit.
Oncogene. 31:897–906. 2012. View Article : Google Scholar : PubMed/NCBI
|
|
54
|
Schultz J, Ibrahim SM, Vera J and Kunz M:
14-3-3sigma gene silencing during melanoma progression and its role
in cell cycle control and cellular senescence. Mol Cancer.
8:532009. View Article : Google Scholar : PubMed/NCBI
|
|
55
|
Vera J, Schultz J, Ibrahim S, Raatz Y,
Wolkenhauer O and Kunz M: Dynamical effects of epigenetic silencing
of 14-3-3sigma expression. Mol Biosyst. 6:264–273. 2010. View Article : Google Scholar : PubMed/NCBI
|
|
56
|
Ko BS, Jan YJ, Chang TC, Liang SM, Chen
SC, Liu TA, Wu YM, Wang J and Liou JY: Upregulation of focal
adhesion kinase by 14-3-3ε via NFκB activation in hepatocellular
carcinoma. Anticancer Agents Med Chem. 13:555–562. 2013. View Article : Google Scholar : PubMed/NCBI
|
|
57
|
Xia H, Nho RS, Kahm J, Kleidon J and Henke
CA: Focal adhesion kinase is upstream of phosphatidylinositol
3-kinase/Akt in regulating fibroblast survival in response to
contraction of type I collagen matrices via a beta 1 integrin
viability signaling pathway. J Biol Chem. 279:33024–33034. 2004.
View Article : Google Scholar : PubMed/NCBI
|