Introduction
High altitude heart disease is a common disease in
people living in the high altitude areas (1). Hypoxic pulmonary hypertension (HPH) has
been reported to be the key link of its onset (2). Understanding the pathogenic mechanism of
HPH is the key for prevention and treatment. One of the major
pathological change characteristics of HPH is hypoxic pulmonary
vasoconstriction and pulmonary vascular structural remodeling
(3). Hypertrophy and proliferation of
pulmonary artery smooth muscle cells (PASMCs) can lead to thicker
pulmonary arteriole walls and narrower inner diameter, increased
pulmonary vascular resistance, and pulmonary arterial pressure
(4). Long-term consistent pulmonary
arterial hypertension may lead to compensatory hypertrophy of the
right ventricle and even right heart failure (5).
Abnormal proliferation, apoptosis and migration of
PASMCs are the most important characteristics of pulmonary vascular
structural remodeling (6). Previous
studies often focused on the mechanism of changes in related
bioactive molecules involved in regulating functions such as
proliferation, apoptosis and migration (7–9). Results
obtained from other studies revealed that anoxia can significantly
downregulate the expression of PASMC contractile phenotype marker
proteins (10,11). However, the specific mechanism of this
downregulation is still unclear. Therefore, in-depth research on
the molecular mechanism of phenotypic transformation of PASMCs may
help us to explain the internal mechanism involved in pulmonary
arterial structural modeling during the process of hypoxic
pulmonary hypertension.
MicroRNAs (miRNAs) are small endogenous non-coding
single stranded RNA molecules with regulatory capacities (12). It is estimated that the expression of
~1/3 of the human genes are regulated by miRNA (13). miRNAs can degrade mRNA (14) by directly binding to the 3′-UTR of its
target mRNA. miRNAs can also regulate the gene expression through
inhibition of mRNA translation (15).
There are several studies showing that miRNAs can participate in
multiple physiological processes such as cellular differentiation,
metabolism, apoptosis and proliferation. Also, the involvement of
miRNAs in regulation of many other pathological processes such as
tumorigenesis, inflammation resolution and vascular proliferation
has been reported (16,17). However, little has been done to
determine whether miRNAs are involved in regulation of
anoxia-induced phenotypic transformation of VSMCs. The internal
mechanism of anoxia-induced changes in expression of miRNA in
PASMCs is also expected to be studied.
We verified the expression of a series of miRNAs
using RT-qPCR in anoxia-induced phenotypic transformation models of
PASMCs. Additionally, we verified whether miR-23a upregulation was
involved in anoxia-induced phenotypic transformation of PASMCs.
Materials and methods
Isolation and purification of the
primary PASMCs in rats
Healthy SPF Sprague-Dawley (SD) rats weighing ~180 g
were provided by the Inner Mongolia Medical University of Inner
Mongolia Medical University (Inner Mongolia, China; animal license
no. SCXK Meng 2014–0007). Ethics approval for the animal
experiments was received from the Animal Ethics Committee of Inner
Mongolia Medical University Animal Center. Rats were decollated
after they were anesthetized by intraperitoneal injections of 10%
urethane (1 ml/100 g) (Beijing Chemical Reagent Co., Ltd., Beijing,
China). Rats were fixed and transferred to an aseptic operation
room. Thoracic cavity was dissected and heart and lung were
extracted and immersed in pre-cooled sterilized phosphate-buffered
saline (PBS). Starting from right ventricle, the arteriole was
separated from the lung. The fibrous tissue and adipose tissue were
removed from the outer membrane of the pulmonary arteries with
bended microscopic tweezers (Beijing Beifang Biologic Technology
Research Institute, Beijing, China). Blood vessels were
longitudinally cut open and washed twice with D-Hank's solution
(Invirogen Life Technologies, Carlsbad, CA, USA). The inner
membrane surface of the blood vessels was exposed and the vascular
endothelial cells were removed. The remaining tissue was sliced
into fragments and placed in a centrifuge tube containing 0.2%
collagenase I (Sigma-Aldrich, St. Louis, MO, USA). It was agitated
gently and digested for 3 h at 37°C. It was then centrifuged at 800
× g for 5 min and the supernatant was discarded. The pellet was
re-suspended in 5 ml of high glucose Dulbecco's modified Eagle's
medium (DMEM), containing 10% fetal bovine serum (FBS) (both from
Gibco-BRL, Grand Island, NY, USA; Invitrogen Life Technologies). It
was then incubated at 37°C with 5% CO2 for 3 days.
Culture media were changed every 3 days.
Identification of PASMCs
Cells were placed in suspension, inoculated into a
sterile 24-well microplate and allowed to stand for 2 days. The
cells were rinsed 3 times with pre-heated (37°C) PBS for 3 min
(each time). Cells were fixed with 200 µl of 4% paraformaldehyde
(Beijing Chemical Reagent Co., Ltd.) for 15 min, followed by
washing with PBS 3 times (10 min each). One hundred microliters of
0.3% Triton X-100 (Invitrogen, Darmstadt, Germany) was added to
rupture the membrane for 30 min at room temperature. The cells were
rinsed 3 times with PBS (10 min each) and blocked for 30 min at
room temperature after adding 100 µl of 10% goat serum
(Invitrogen). Blocking buffer was discarded and the cells were
incubated at 4°C overnight after the addition of 100 µl of specific
SM-α-actin antibody (dilution ratio of 1:200; Abcam, Cambridge,
UK). The cells were then rinsed 3 times with PBS (10 min each) and
incubated at 37°C for 60 min in the dark and washed 3 times with
PBS (10 min each) after the addition of 100 µl of FITC-marked
secondary antibody (dilution ratio of 1:300; Bioss Biological
Technology Co., Beijing, China). The cells were incubated for 5 min
at room temperature followed by the addition of the DAPI nucleus
staining solution (Wuhan Boster Bio-Engineering Co., Ltd., Wuhan,
China) and rinsed 3 times with PBS (10 min each time). The samples
were mounted with the anti-fluorescent quenching mounting medium
(Bioss Biological Technology Co.) and were kept in the dark. The
cells were then studied under a laser confocal microscope (Olympus,
Tokyo, Japan).
Protein expression
The primary rat PASMCs were rinsed with preheated
PBS (37°C). Pre-cooled lysing buffer was then added. The adherence
cells were removed from the ice with a cell scraper and placed on
ice. After 20 min of lysis, samples were centrifuged at 10,000 × g
for 5 min at 4°C. The supernatant was collected for BCA protein
quantification (Gemini Bio-Products, Woodland, CA, USA). Loading
buffer was added to samples and they were prepared for SDS-PAGE.
Proteins were then transferred onto a PVDF membrane (Invitrogen
Life Technologies) for 60 min at a constant voltage of 16 V. The
membrane was immersed into 5% BSA blocking buffer for 2 h and after
rinsing antibody diluent TBST was added (0.1 ml/cm2). It
was incubated overnight at 4°C. Anti-SM-MHC, anti-SM-α-actin,
anti-calponin-1, anti-SM22α and anti-β-actin antibodies (dilution
ratio of 1:1,000; Abcam) was added to membranes. Membranes were
then washed 3 times with TBST (10 min each), and incubated with
HRP-marked goat anti-rabbit secondary antibody (1:5,000; cat no.:
10672), HRP-marked goat anti-mouse secondary antibody (1:5,000; cat
no.: 10541) and HRP-marked rabbit anti-goat secondary antibody
(1:5,000; cat no.: 12376) (all from Wuhan Boster Bio-Engineering
Co., Ltd) for 1 h at room temperature and rinsed 3 times (10 min
each) with TBST. Finally, chemiluminescence reagent (Millipore,
Billerica, MA, USA) was added and membranes were placed in darkroom
for exposure. The quantity one software (Tree Star, Inc., Ashland,
OR, USA) was employed for imaging. The relative gray value was used
to express the relative protein content.
Detecting proliferation of PASMCs with
EdU
PASMCs were inoculated into a 96-well microplates
(1×10⁴/well). The cells were placed in a
normoxia-preconditioned incubator and were grown until they entered
a normal growth stage. Cells in the anoxia treatment group were
placed in an anoxia incubator and cultured for 48 h (H48h). Cells
in the normoxia group were placed in a normoxia incubator and
cultured for 48 h (N48h). EdU solution (Premier Biosoft
International, Palo Alto, CA, USA) was diluted proportionally with
the culture medium for preparation of 50 µM EdU culture medium. One
hundred microliters of EdU culture medium (50 µM) was added to each
well. Culture medium was discarded after 2 h. The cells were washed
twice with PBS (5 min each time). Paraformaldehyde (60 µl) (4v%)
(Beijing Chemical Reagent Co., Ltd.) was added to each well,
followed by 30 min incubation at room temperature. Glycine (50 µl)
(2 mg/ml) (Invitrogen Dynal AS, Oslo, Norway) was added to each
well and cells were incubated for 5 min on a shaking table (Thermo
Fisher Scientific, Inc., Waltham, MA, USA). Glycine solution was
then discarded and the cells were washed for 5 min with PBS.
Penetrant (100 µl) (0.3% Triton X-100) (Invitrogen) was added to
each well and cells were incubated for 10 min followed by a wash
with PBS for 5 min. Then, 1X Apollo® staining reaction
solution (100 µl) was added to each well followed by 30 min
incubation in the dark at room temperature. Staining reaction
solution was discarded and 100 µl of methyl alcohol (Beijing
Beifang Biotechnology Research Institute) was added to each well.
The cells were washed twice with PBS (5 min each time). Hoechst
33342 (1X) reaction solution (100 µl) (BD Biosciences, Mountain
View, CA, USA) was added to each well and cells were incubated for
30 min at room temperature in the dark. The cells were washed twice
with PBS and then 50 µl goat serum (10%) was added to each well.
Subsequently, the cells were blocked for 30 min at room
temperature. Specific SM-α-actin antibody (50 µl) (dilution of
1:200; Abcam), was added and incubated overnight at 4°C. Cells were
rinsed 3 times with PBS (10 min each). FITC marked secondary
antibody (Wuhan Boster Bio-Engineering Co., Ltd.) (dilution of
1:300) was added followed by 60 min incubation at 37°C in the dark
followed by 3 washes with PBS (10 min each). Cells were kept in the
dark, before observation with laser confocal microscope after
dropwise addition of an appropriate volume of the anti-quenching
mounting medium (Wuhan Boster Bio-Engineering Co., Ltd.).
miR-23a detection using RT-qPCR
The PASMC cells were cultured in 6-well microplates.
The microplate was placed on ice and 800 µl of pre-cooled RNAiso
Plus (Qiagen, Inc., Valencia, CA, USA) was added to each well.
Adherent cells were removed and transferred into an Eppendorf tube.
After 10 min, samples were centrifuged at 12,000 × g for 5 min at
4°C. Supernatant was collected and RNAiso Plus chloroform (Qiagen,
Inc.) was added and cells were left for 5 min and centrifuged at
12,000 × g for 15 min at 4°C. Supernatant was collected and
isopropanol (Qiagen, Inc.) was added, and cells were left for 10
min at room temperature followed by centrifugation at 12,000 × g
for 10 min at 4°C. Supernatant was discarded, and pellet was dried
before adding 1 ml of 75% ethanol. Samples were centrifuged again
at 12,000 × g for 5 min at 4°C. Supernatant was discarded, and
pellet was dissolved in DEPC-treated water (Qiagen, Inc.). For
reverse transcriptional we used All-in-One™ miRNA First-Strand cDNA
Synthesis kit (Takara Bio, Inc., Japan).
RT reaction system was: 1 µl (100 ng) total RNA, 2.5
U/µl Poly(A) polymerase (0.2 µl), RTase mix (0.2 µl), 5X reaction
buffer (1 µl) and nuclease-free water (2.6 µl). RT reaction
conditions were: 37°C for 60 min; 85°C for 5 min. Reverse
transcription products were diluted with non-enzymatic sterile
ddH2O.
The qPCR reaction system was: 5 µl of 2X All-in-One
qPCR mix, 1 µl (2 µM) of All-in-One miRNA qPCR primer, 1 µl (2 µM)
universal adaptor PCR primer, 1 µl (diluted 1:5) First-Strand cDNA
and 2 µl nuclease-free water.
PCR condition was as follows: Pre-denaturation at
95°C for 10 min; 95°C for 10 sec, 60°C for 20 sec and 72°C for 10
sec and total cycles were 40. Dissolution curve reaction was 65°C
for 5 sec, fluorescence collection; the temperature in each cycle
increased by 0.5°C, up to 95°C.
Cell transfection
The PASMCs were cultured for 24 h with DMEM
containing 0.5% FBS before transfection. Cells transfected with
miR-23a inhibitor (100 nM) (Qiagen, Inc.) were designated as the
miR-23a inhibitor group.
Cells that transfected with inhibitor control (100
nM) (Qiagen, Inc.) were designated as the inhibitor control (ctrl)
group, and cells with transfection reagent (equal volume) were
designated as the vehicle group. All the groups were placed in an
anoxia incubator containing 3% O2 and were incubated for
48 h. Cells transfected with miR-23a mimic (100 nM) were designated
as the miR-23a mimic group, and cells transfected with mimic
control (100 nM) were designated as the mimic ctrl group. Cells
with transfection reagent (equal volume) were designated as the
blank control group, or vehicle. All groups were incubated in a
normoxia incubator containing 21% O2 for 48 h.
Detecting the expression of myocardin
and miR-23a in the pulmonary arteriole tissue with RT-qPCR
PASMCs (106) were directly added to 1 ml
RNAiso Plus. The pulmonary arteriole tissue was placed in a glass
homogenizer. Five hundred microliters of pre-cooled RNAiso Plus was
added. Tissue was sufficiently grounded and then mixed in a vortex
mixer and allowed to stand for 5 min at room temperature. Then,
~1/5 volume of chloroform was added and mixed well for 1 min,
allowed to stand for 5 min and centrifuged at 10,000 × g for 15 min
at 4°C. An equal volume of isopropanol was added and after mixing
it was left for 5 min at room temperature, followed by
centrifugation at 10,000 × g for 10 min at 4°C. Supernatant was
discarded, and 1 ml of 75% ethanol was added to the pellet. An
appropriate volume of DEPC water was added for sufficient
dissolution and precipitation.
The reaction system was 25 µl: The fluorescent
RT-PCR reaction solution was 1 µl DNA polymerase, 0.35 µl reverse
transcriptase and 5 µl template RNA. Solution was mixed well and
centrifuged at 5,000 × g for 10 sec. Real-time fluorescent RT-PCR
amplification procedure was as follows: Reverse transcription for
30 min at 50°C; pre-denaturation for 3 min at 95°C; denaturation
for 15 sec at 95°C; annealing at 50°C for 30 sec; extention for 30
min at 72°C, 5 cycles in total; denaturation for 10 sec at 95°C;
annealing for 40 sec at 55°C, 40 cycles in total. The primer
sequences were as follows: miR-23a forward, 5′-CAGGCGGGTAGTAGATG-3′
and reverse, 5′-AGGGACGGGCATGGAAAGG-3′.
Pri-miR-23a-1, pri-miR-23a-2, and
pri-miR-23a-3 expression
Takara fluorescent quantitation reverse
transcription reagent kit and SYBR-Green qPCR reagent (Takara Bio,
Inc.) were used. Specific reaction system and conditions were as
follows: i) 2 µl reverse transcription reaction system PrimeScript™
buffer (5X), 0.5 µl PrimeScript™ RT enzyme mix I, 0.5 µl Oligo(dT)
primer, 0.5 µl random 6 mers, 500 ng total RNA and up to 10 µl
RNase-free water. Reaction conditions for reverse transcription was
37°C for 30 min and 85°C for 5 min. PCR reaction system was: 10 µl
SYBR Premix Ex Taq (2X), 0.5 µl forward primer (10 µM), 0.5 µl
reverse primer (10 µM), 0.8 µl RT and up to 20 µl nuclease-free
water. PCR reaction conditions: 95°C for 1 min; 95°C for 5 sec;
60°C for 30 sec (40 cycles). Dissolution curve reaction: 65°C for 6
sec, temperature increased by 0.5°C in each cycle, up to 95°C.
Sequence of the primers used were as follows: Pri-miR-23a-1
forward, 5′-TTCCATATGCTGACCTCCA-3′ and reverse,
5′-CAAGGTACCAGGCCCTCT-3′; pri-miR-23a-2 forward,
5′-GAGGACTATGCTGTGACCAA-3′ and reverse,
5′-AGCAATGCATGCCTTTCTGGT-3′; pri-miR-23a-3 forward,
5′-GCCGTAGTCACTCTTTGGTT-3′ and reverse,
5′-TCGATCGTGCAAGTTGTTAGA-3′.
Chromatin immunoprecipitation
(ChIP)
We closely followed the instructions provided with
the ChIP kit (Millipore). The PASMCs were properly cultured with
high glucose DMEM containing 10% FBS until cell density reached
80–90%. They were cross linked for 15 min at room temperature after
addition of 1% formaldehyde. Culture medium and glycine was added
to terminate cross-linking. Cells were transferred to an Eppendorf
tube and centrifuged at 1,000 × g for 5 min at 4°C. Cells were
re-suspended with SDS lysis buffer and ruptured with ultrasound and
the sediment was collected. Nine hundred microliters dilution
buffer + 9 µl protease inhibitor cocktail I (PIC; 100X) was added
to each 100 µl of the ultrasonic lysis products. Sixty microliters
of the protein G agarose was added to each tube. It was well mixed
and placed at 4°C for 1 h followed by centrifugation at 3,000–5,000
× g for 1 min. Nine hundred microliters of the supernatant were
transferred to a new tube and appropriate antibody was added. For
negative control we used 5 µl IgG. In the experimental group, we
used 5 µl HIF-1α polyclonal antibody. Sixty microliters of the
protein G and agarose was added to each tube, and incubated at 4°C
for 1 h with gentle shaking to collect the HIF-1α/miR-23a gene
compound and the HIF-1α antibody followed by centrifugation at
3,000 × g at 4°C for 1 min. Supernatant was discarded after the
agar was precipitated. It was incubated at 4°C for 5 min and DNA
bound to HIF-1α was eluted. After addition of 1 µl RNase A, it was
incubated at 37°C for 30 min. Four microliters of 0.5 M EDTA, 8 µl
1 M Tris-HCl, and 1 µl proteinase K, were added followed by
incubation at 45°C for 2 h. TE was added then to adjust the volume
at 250 µl. After the addition of 250 µl of phenol chloroform
mixture, it was centrifuged at 11,000 × g for 7 min. The upper
aqueous phase was transferred to an Eppendorf tube and of equal
volume of chloroform isoamylol mixture was added. They were mixed
well and centrifuged at 11,000 × g for 5 min. The supernatant was
transferred to an Eppendorf tube, and 1/10 volume of 3 M sodium
acetate (pH 5.2) and 1 µl of 20 mg/ml glycogen were added. It was
mixed well, and 2 volume of ethanol was added and after mixing it
was transferred to −20°C for 1 h to precipitate DNA. Sample was
then centrifuged at 13,000 × g for 10 min at 4°C. The supernatant
was discarded and 700 µl of 70% ethanol was used to wash the
sediment. Fifty microliters of TE was added to dissolve the
sediment.
PCR reaction system: 10 µl SYBR® Premix
Ex Taq GC (2X), 0.4 µl forward primer (10 µM), 0.4 µl reverse
primer (10 µM), 1 µl DNA template and up to 20 µl nuclease-free
water.
PCR reaction condition: 95°C for 1 min; 95°C for 5
sec; 60°C for 30 sec (40 cycles). Dissolution curve reaction: 65°C
for 6 sec, fluorescence collection; temperature increased by 0.5°C
in each cycle, up to 95°C. PCR primers: miR-23a-1R1 forward,
5′-GGATTTTGCGTACCACCAAA-3′ and reverse, 5′-CTCATTAAGGCCACTTTTCA-3′;
miR-23a-1R2 forward, 5′-AAAAACTGTGCGTATGAGAG-3′ and reverse,
5′-GTCCGTGCGTACACATCAAG-3′; miR-23a-1R3 forward,
5′-GTATGTGTGCGCCTGAAGAC-3′ and reverse, 5′-CGATGCAACCTGAACCCACT-3′;
miR-23a-3R forward, 5′-GTCACACTGTCGTCCGGTCC-3′ and reverse,
5′-TCTGTTGCGTCGTCACAGCTA-3′.
Dual-luciferase reporter gene
experiment
Expression plasmids and the luciferase reporter gene
plasmids were diluted (100 ng/µl). Internal reference plasmids were
also diluted (10 ng/µl). For transfection, we followed the
instruction provided by Lipofectamine 2000 kit.
For dual-luciferase reporter gene detection we used
the Dual-Luciferase Reporter Assay System kit (Promega, Madison,
WI, USA). Culture medium was discarded and cells were rinsed twice
in PBS. Thirty microliters of freshly-prepared reporter gene cell
lysis buffer 1X PLB was added to the cells in each well. Cells were
lysed for 15 min at room temperature and then centrifuged and
supernatant was collected. Twenty microliters of the supernatant
was transferred to an Eppendorf tube in order to measure luciferase
activity.
Mean pulmonary arterial pressure
(mPAP) and right ventricular weight index [RV/(LV+S)]
Rats in chronic hypoxia (CH) group were exposed to
21 days of hypoxia and rats in the normoxia control (NC) group were
put in a hypobaric chamber and outside of the chamber at a
simulated altitude of 5,000 m (Thermo Fisher Scientific, Inc.).
Eight rats were selected from each group.
Each rat was intraperitoneally injected with 10%
urethane (1 ml/100 g) and fixed onto a platform for separating the
right external jugular vein. Each rat was intravenously injected
with 0.5% heparin normal saline solution (0.2 ml/100 g body mass)
(Beijing Sanyao Science and Technology Development Co., Ltd.,
Beijing, China). Right ventricle and pulmonary arterial intubations
(0.45 mm ID and 0.8 mm OD) were performed for 10 min. mPAP was
determined with the Power lab multilead physiological recording
instrument (Thermo Fisher Scientific, Inc.). Rats were sacrificed
and thoracotomy was performed to remove the heart. The heart atrium
and connective tissue were carefully separated. RV free wall was
separated along the ventricular septum. The weight index of the
right ventricle was calculated using the following formula: [weight
of right ventricle/(left ventricle + ventricular septum)
weight].
Hematoxylin and eosin (H&E)
staining
Frozen sections were warmed for 60 min at room
temperature, fixed for 15 min in the pre-cooled acetone at 4°C,
rinsed for 3 min with distilled water. The sample was stained for 5
min in the hematoxylin staining solution (Beijing Beifang Biologic
Technology Research Institute) and then rinsed once with water,
prior to being placed in 95% ethanol for 5 sec and stained for
approximately 1 min in the eosin solution (Beijing Beifang Biologic
Technology Research Institute). The sample was then immersed in 95%
ethanol for 2 min, transferred to xylene, mounted with central gum,
and observed under a microscope (Takara, Bio, Inc.). The nucleus
was stained in blue while the cytoplasm was pink or red. Image
analysis was studied with an inverted microscope. Outer diameter,
wall thickness and intima-media thickness were measured.
Statistical analysis
SPSS 19.0 (SPSS, Inc., Chicago, IL, USA) software
was used for statistical analysis. Experimental data were expressed
as mean ± standard deviation (mean ± SD). Independent sample test
was used to compare the means of the two samples. P<0.05 was
considered to indicate a statistically significant difference.
Results
Effect of anoxia on the general
characteristics of rat PASMCs
Primary rat PASMC cells were growing on the culture
flask wall in an extended form, most cells were fusiform, the
cytoplasm was rich and cytoplasmic density was high. Sheaf-like
parallel arrangement was observed, also peak-valley distribution
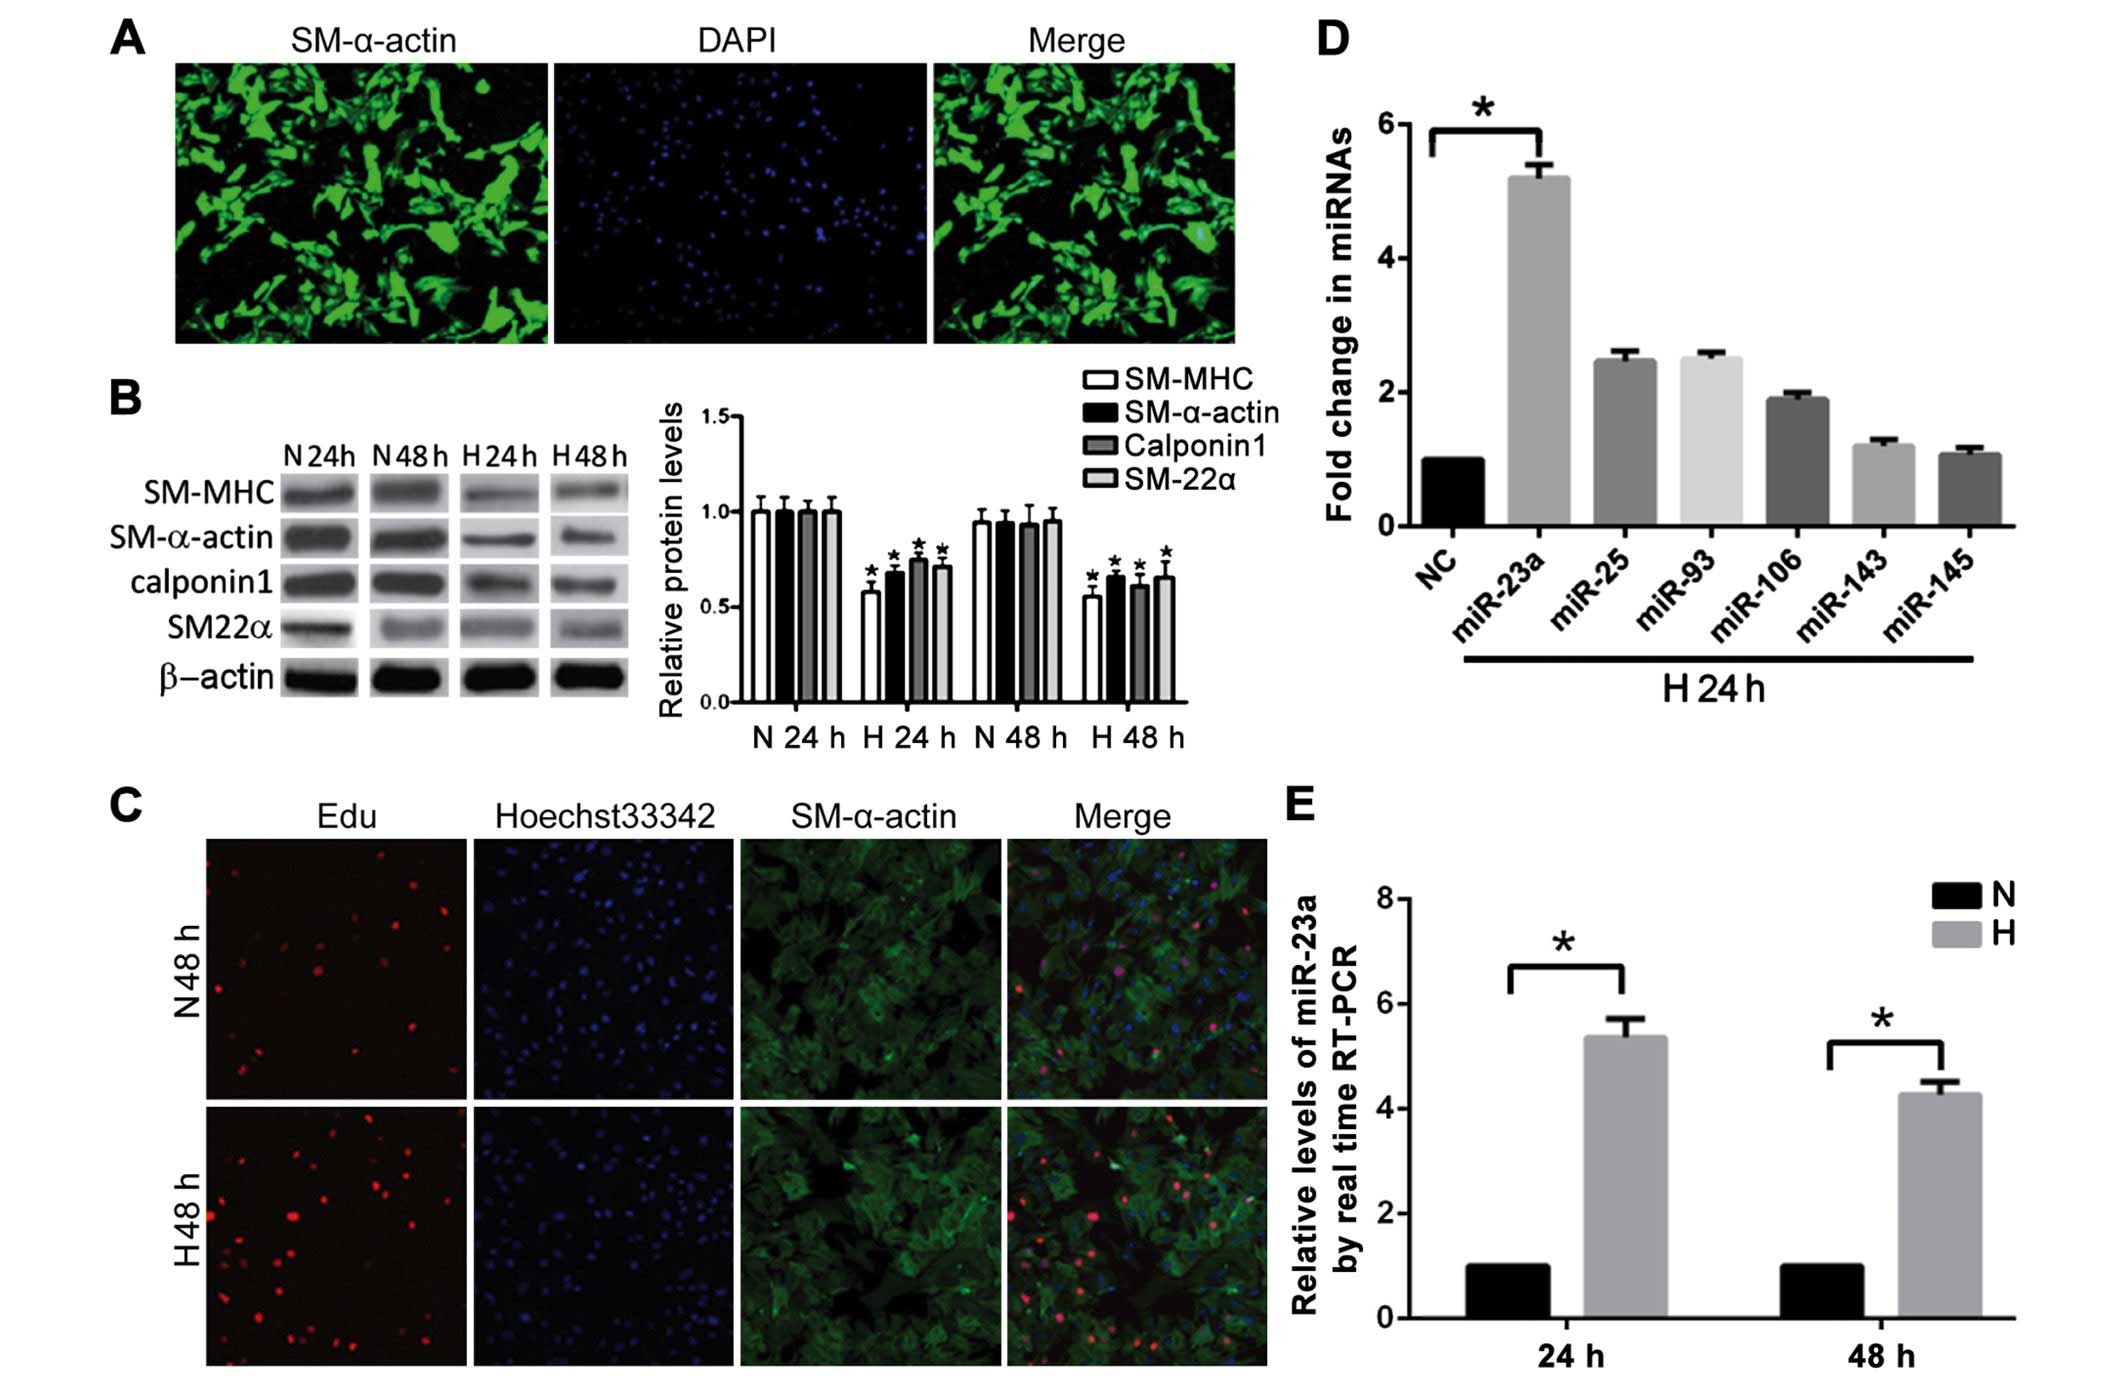
with VSMCs characteristics was observed. After immunofluorescent
staining using SM-α-actin antibody, we observed bright green
filamentous fluorescence in the cytoplasm (Fig. 1A). The positive rate of SM-α-actin was
over 95% on average. The PASMCs in the NC group and anoxia (3%
O2, 24 or 48 h) treatment group were subjected to
SM-MHC, SM-α-actin, calponin-1 and SM22α detection. The result
indicated that the expression levels of SM-MHC, SM-α-actin,
calponin-1 and SM22α in the H24h group were significantly lower
than those in the NC group (P<0.05) (Fig. 1B). The level of contractile phenotype
marker proteins in the PASMCs at 48 h after anoxia treatment (H48h)
was significantly lower than that in the control group (N48h). The
proliferative activity of the primary PASMCs were subjected to
normoxia treatment and those subjected to 3% O2
anaerobic treatment were detected with the EdU staining method. The
positive rate of EdU staining at 48 h (H48h) after anoxia treatment
was lower than that in the NC group, indicating that the anoxia
treatment could significantly strengthen the proliferative activity
of PASMCs (Fig. 1C).
miR-23a, miR-25, miR-23a-3, and miR-106b expression
levels at 24 h after anoxia (H24h) were compared with those in the
NC group (Fig. 1D and E). The
increase in miR-23a expression was the most significant. It was
5.3-fold higher than that in the NC group (N24h). No significant
changes in the expression of miR-143 and miR-145 were observed. The
expression level of miR-23a at 48 h after anoxia was detected. The
result indicated that the expression level of miR-23a at 48 h after
anoxia (H48h) was ~4-fold higher than that in the NC group
(N48h).
Role of miR-23a in anoxia-induced
downregulation of the expression of contractile phenotype marker
protein in PASMCs
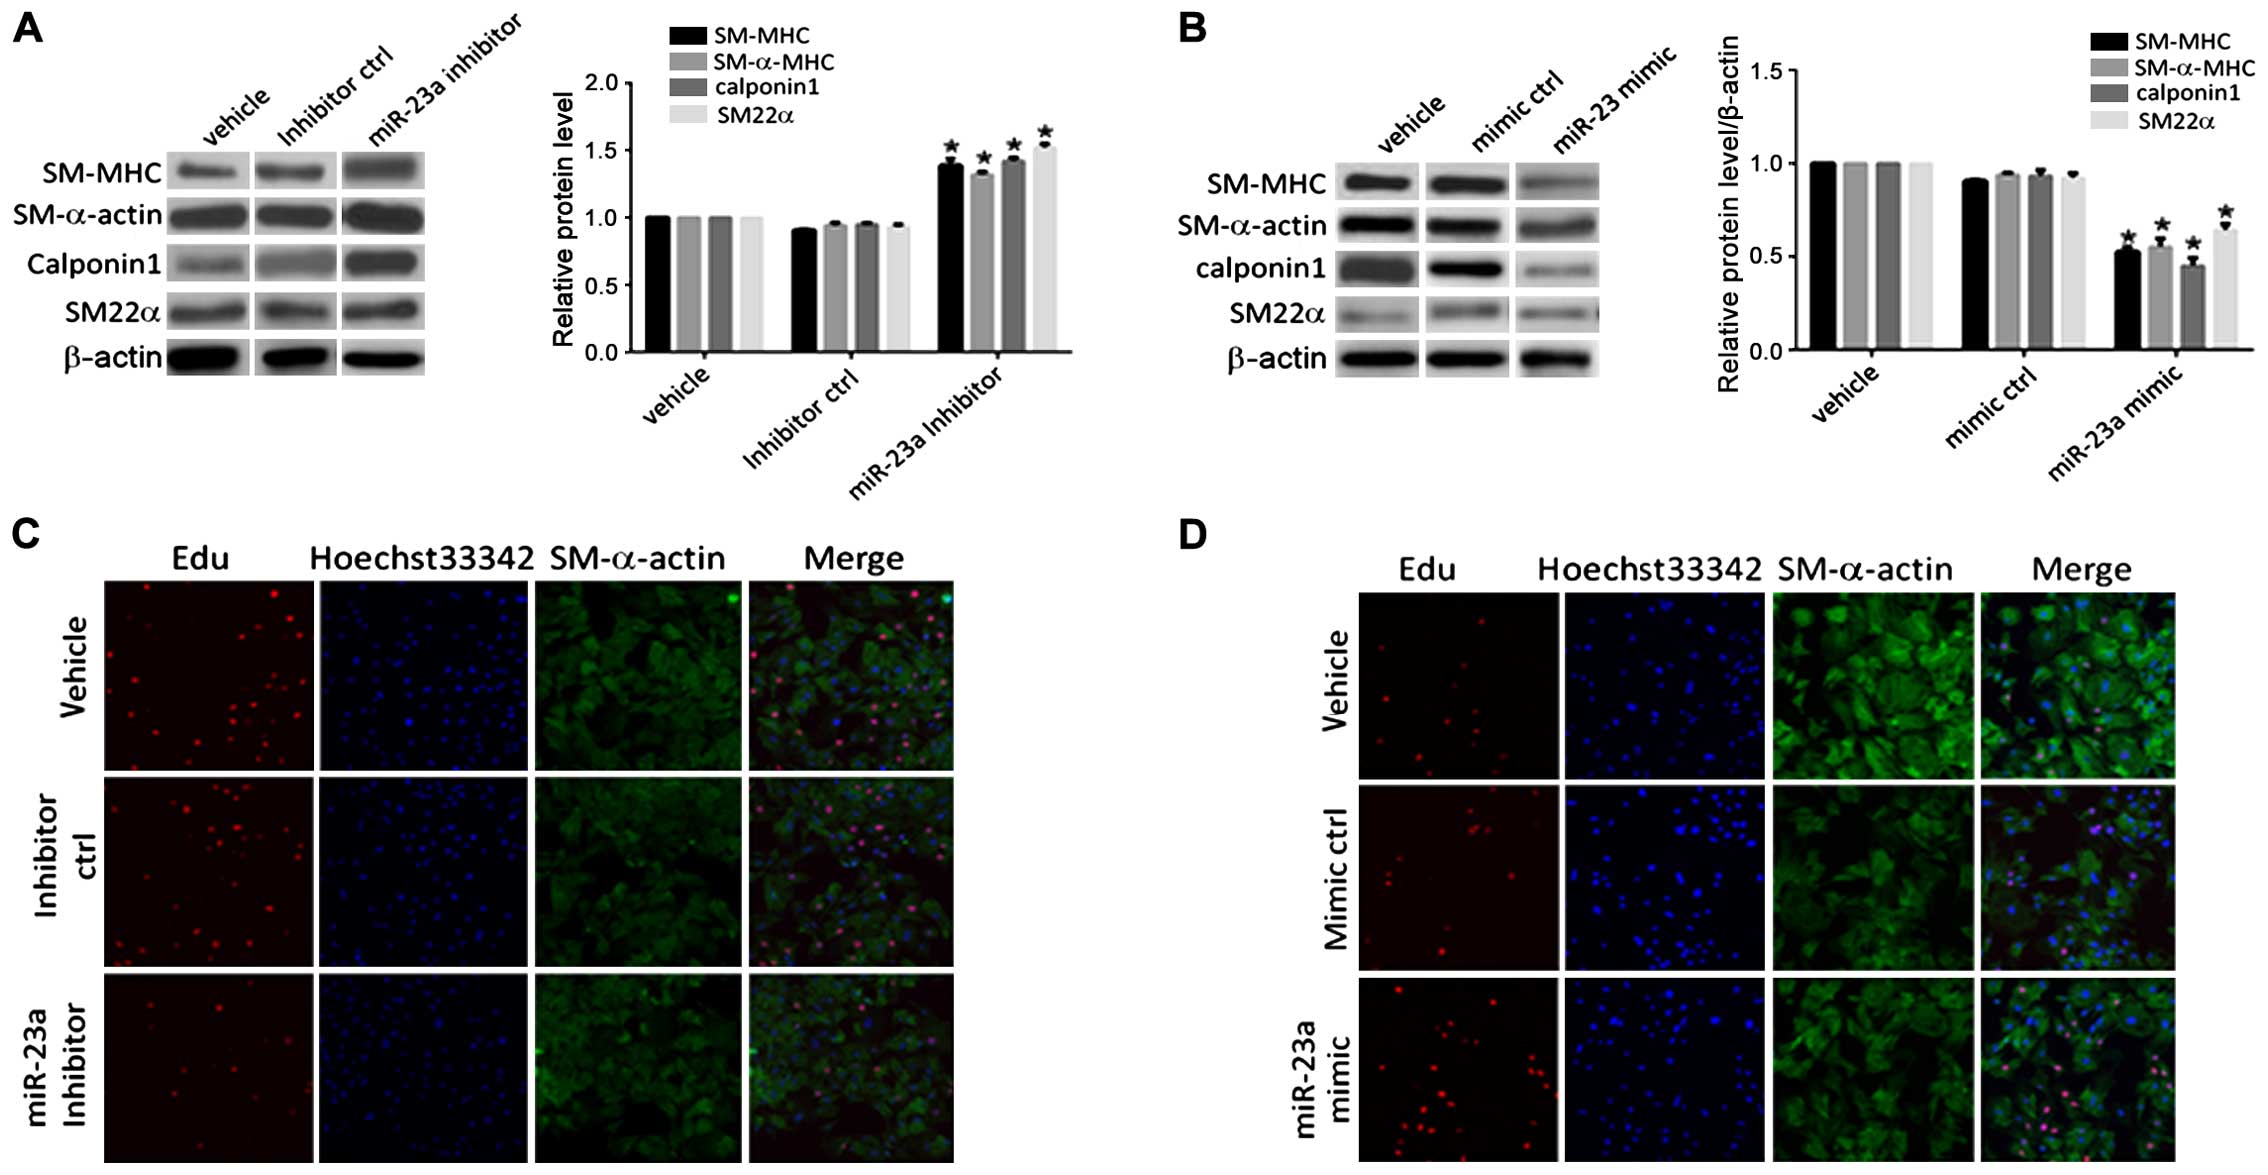
As shown in Fig. 2,
there were no significant change in the levels of contractile
marker proteins (SM-MHC, SM-α-actin, calponin-1 and SM22α) in the
control group (inhibitor ctrl) under anoxia. Contractile marker
proteins were significantly upregulated after transfection with the
miR-23a inhibitor. Expression of the contractile phenotype marker
gene protein in VSMCs in the transfection mimic control group
(mimic ctrl) demonstrated no significant changes compared to that
in the blank control (vehicle) group. The expression levels of the
contractile marker proteins in the PASMCs at 48 h after
transfection with miR-23a mimic were downregulated to different
extents compared with those in the transfection mimic control
group. The positive rate of the staining result of PASMCs
transfected with miR-23a inhibitor under anoxia was detected. It
was found that the positive rate of the EdU in PASMCs in the
transfection inhibitor control group (inhibitor ctrl) had no
significant difference compared with that in the blank control
(vehicle) group. The positive rate of the EdU staining result of
the PASMCs in the transfection inhibitor control group (inhibitor
ctrl) at 48 h after transfection with miR-23a inhibitor decreased
significantly compared with that in the inhibitor control group. It
indicated that miR-23a played a role in promoting anoxia-induced
proliferative activity of PASMCs. The positive rate of the EdU
staining result of PASMCs in the transfection mimic control (mimic
ctrl) under normoxia, had no significant difference compared with
that in the blank control group (vehicle). The positive rate of the
EdU staining result of PASMCs in the transfection mimic control
(mimic ctrl) at 48 h after transfection with miR-23a mimic
increased significantly compared with that in the mimic control
group. It suggested that overexpression of miR-23a under normoxia
could also lead to increased proliferation of PASMCs.
Role of HIF-1α in anoxia-induced
upregulation of the miR-23a expression
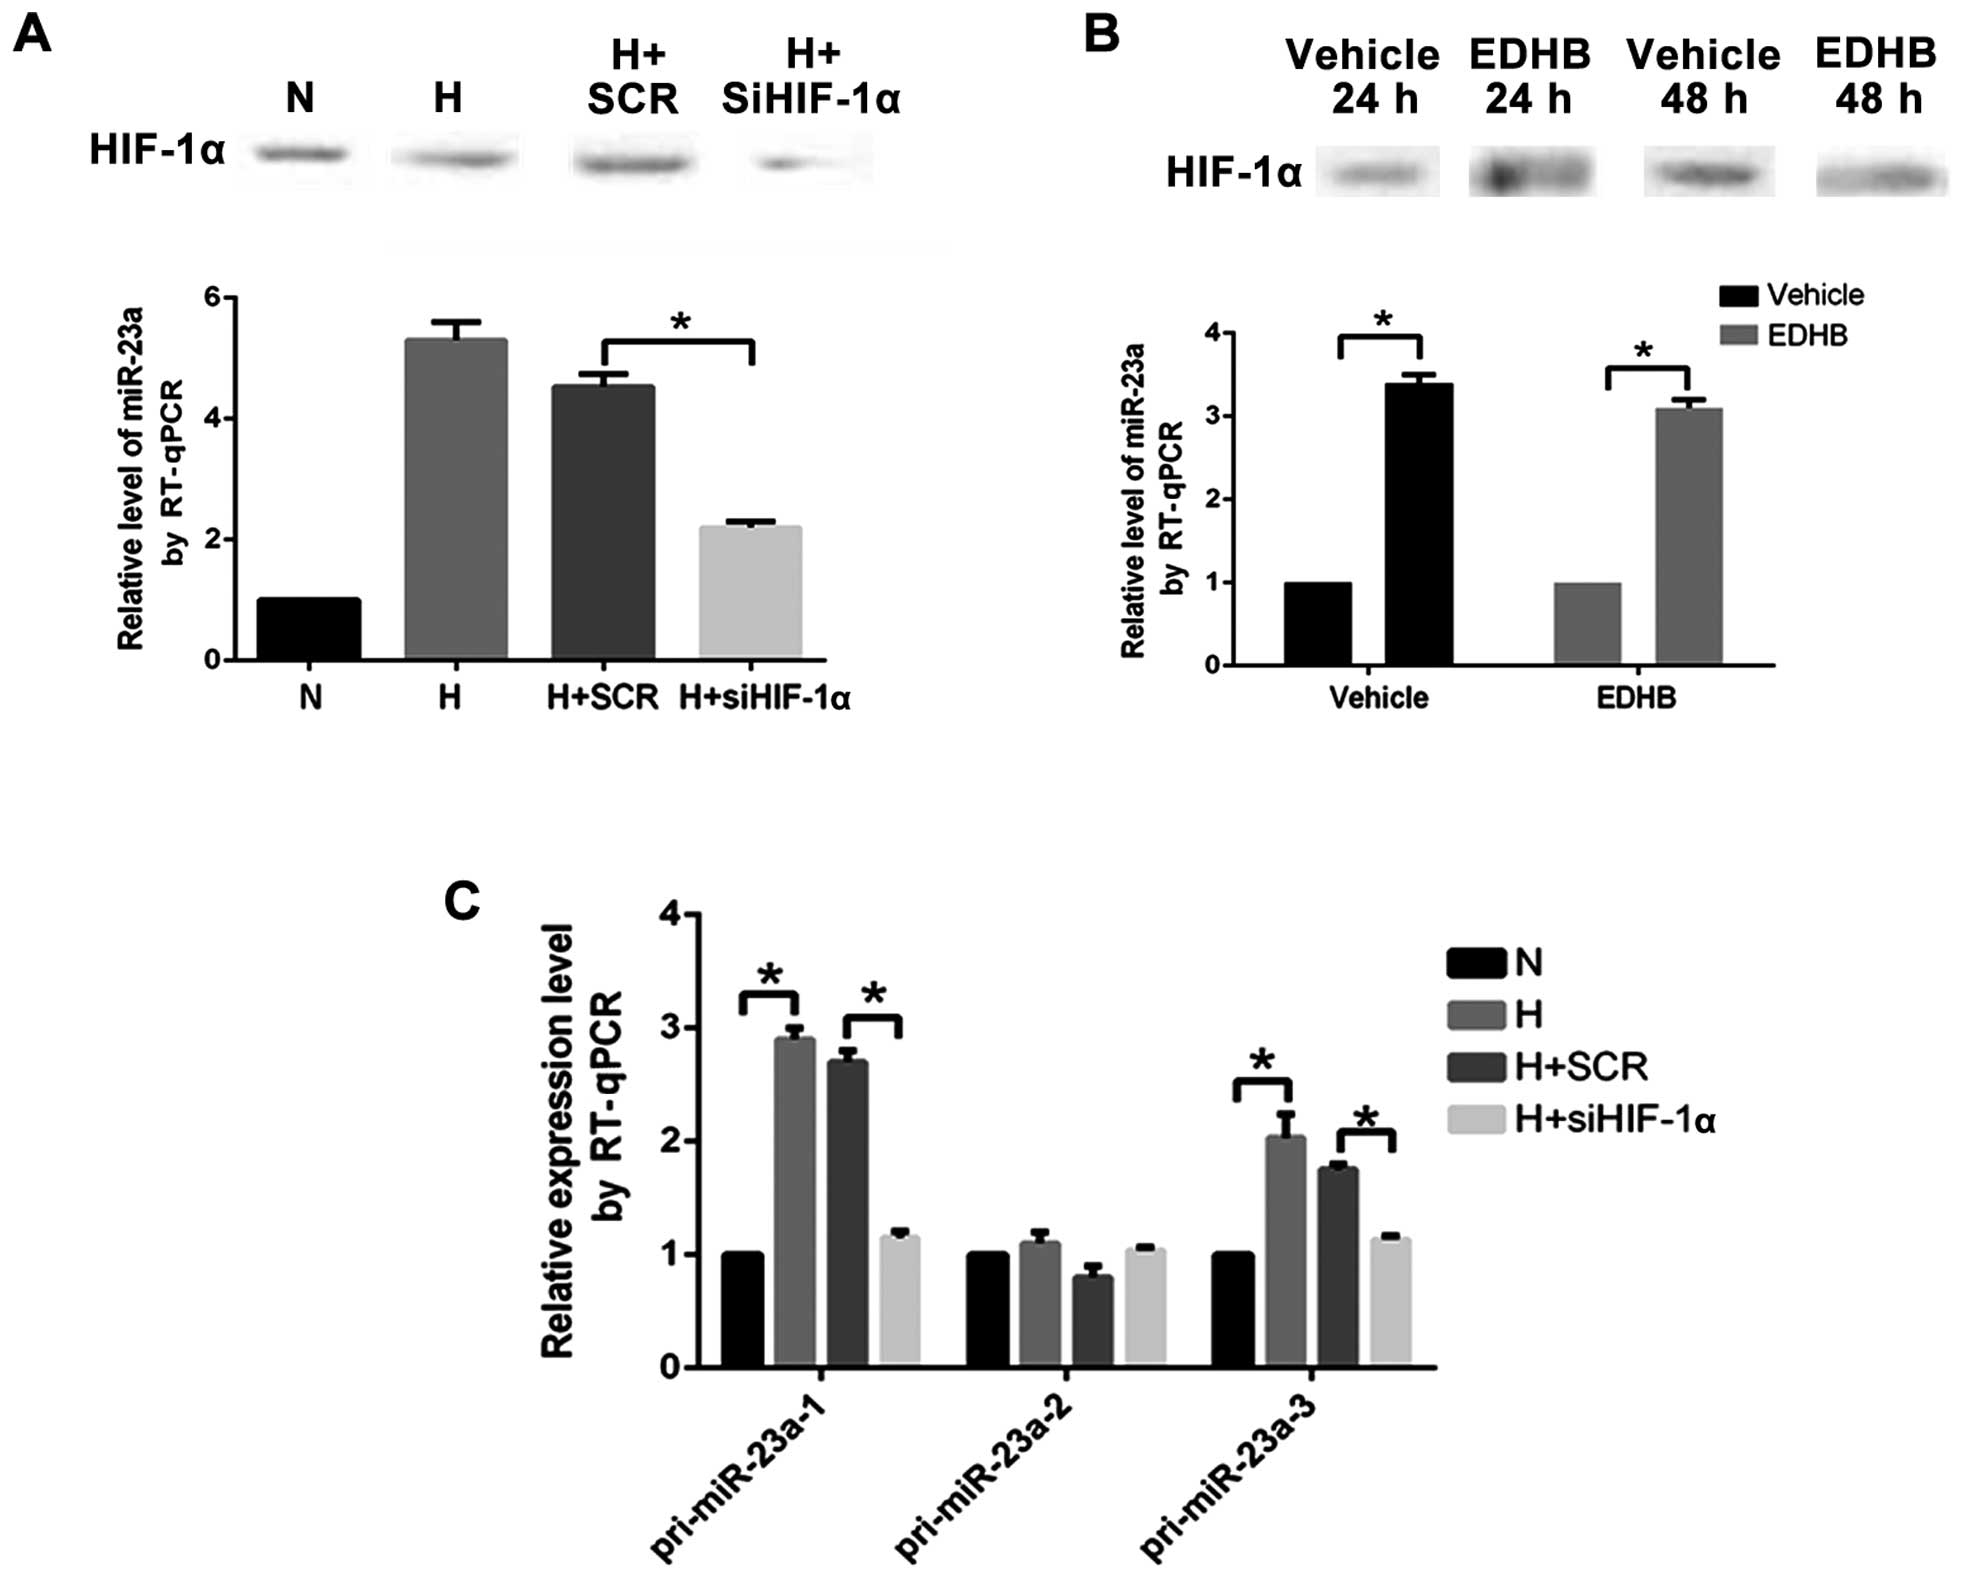
The expression level of miR-23a in PASMCs
transfected with the HIF-1α specific siRNA under anoxia decreased
significantly (Fig. 3A). It indicated
that the upregulation of miR-23a under anoxia was regulated by
HIF-1α.
The HIF-1α protein level and the miR-23a expression
level in the PASMCs under normoxia in the EDHB (500 µM) 24 h (EDHB,
24 h) group increased significantly compared with those in the
control group. The expression level of the HIF-1α protein was
significantly higher than that in the control group (vehicle, 48 h)
and the expression level of miR-23a was significantly higher than
that in the control group (vehicle, 48 h) at 48 h after addition of
EDHB 48 h (EDHB, 48 h) (Fig. 3B).
Changes in the content of pri-miR-23a-1, pri-miR-23a-2, and
pri-miR-23a-3 reflected the transcriptional activity of miR-23a-1,
miR-23a-2 and miR-23a-3. When PASMCs were cultured under anoxia and
transfected with HIF-1α-specific siRNA, the expression levels of
pri-miR-23a-1 and pri-miR-23a-3 decreased significantly (Fig. 3C), indicating that HIF-1α participated
in transcriptional activation effect of miR-23a-1 and
miR-23a-3.
HIF-1α binding to 5′-UTR of miR-23a-1
and miR-23a-3 and its role in transcriptional activation
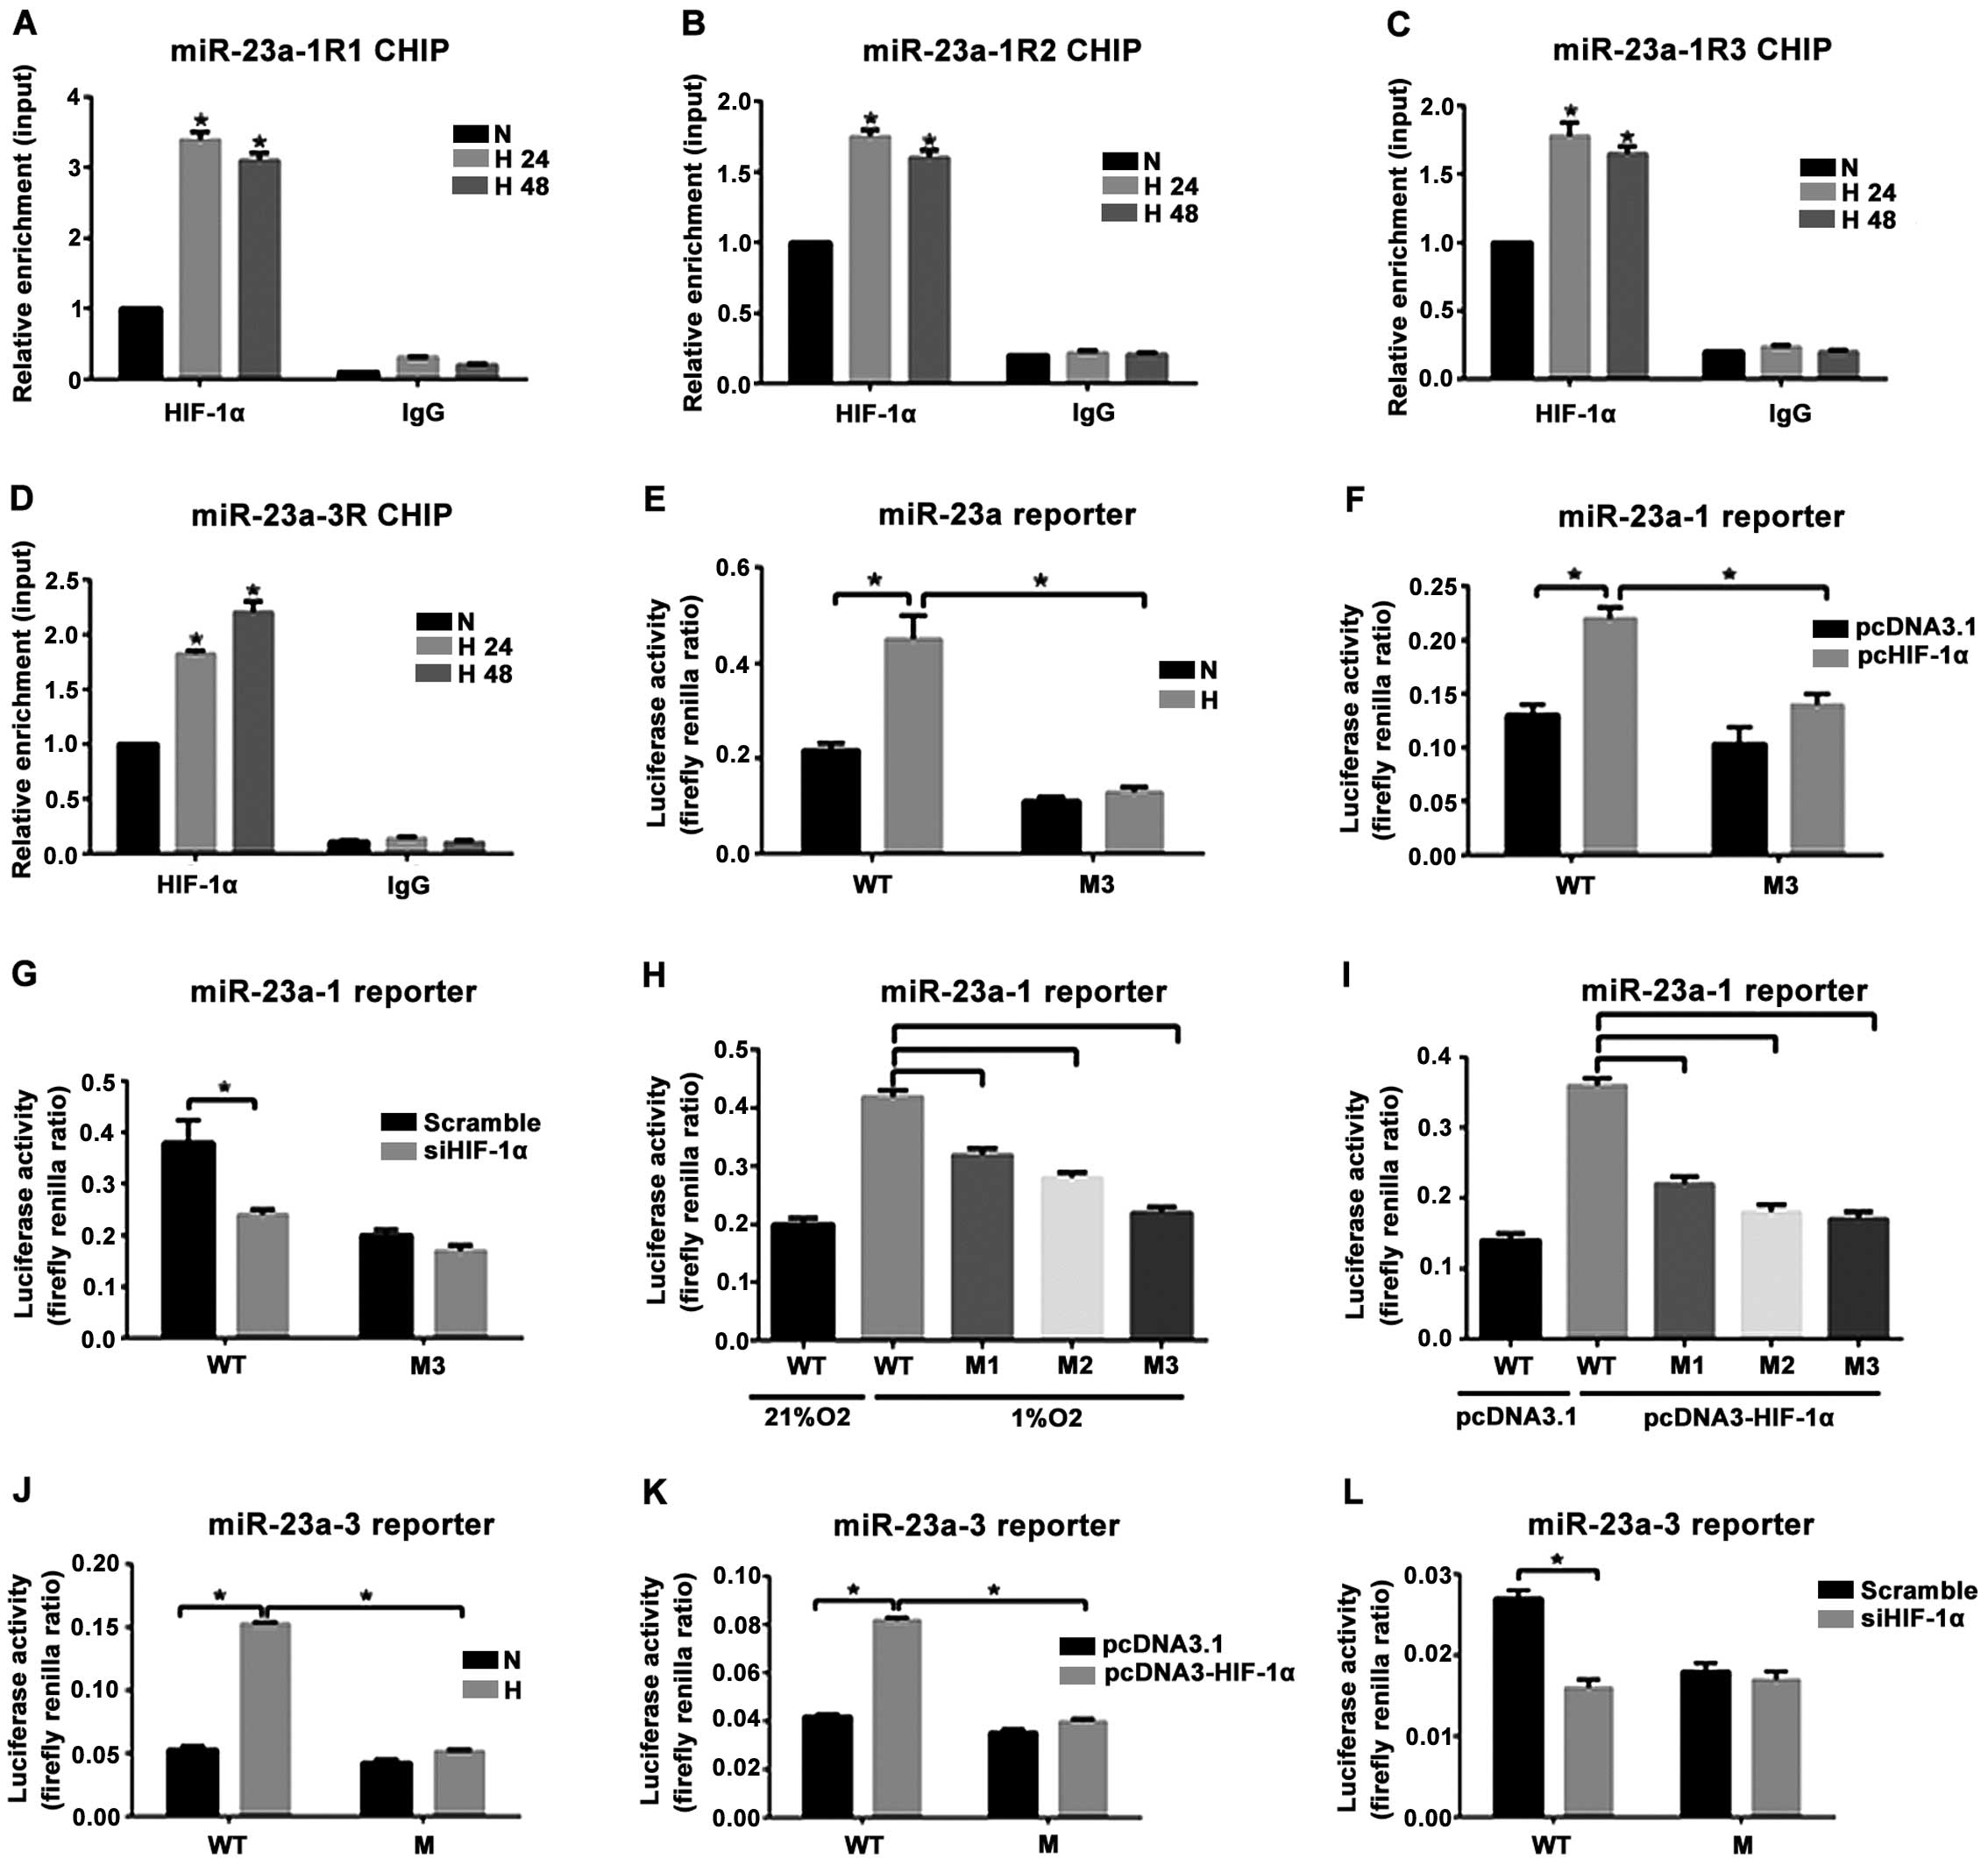
The bonding of the three prediction sites (R1, R2
and R3) within the 5′-UTR of miR-23a-1 in PASMCs to HIF-1α at 24 h
(H24h) and 48 h (H48h) after anoxia increased significantly
compared with that before anoxia (N group). The enrichment level of
HIF-1α in R1 was the highest (Fig.
4A-C). HIF-1α binding to a binding site (R) within 5′-UTR of
miR-23a-3 in the anoxia 24 h group (H24h) and the anoxia 48 h group
(H48h) increased significantly compared with that in the NC group.
To clarify the effect of anoxia and HIF-1α on the transcriptional
activity of miR-23a-1 and miR-23a-3 genes, HEK293FT cells
transfected with the wild-type reporter gene vector (WT) or mutant
(M1, M2 and M3) reporter gene vector were subjected to anoxia
exposure (1% O2 concentration) treatment and
co-transfected with the plasmids with HIF-1α overexpressed. The
result indicated that reporter gene activity of the mutant vectors
transfected with M1, M2 and M3 decreased significantly. The
reporter gene activity of the mutant vector transfected with M3 had
the lowest level (Fig. 4H and I).
Anoxia could significantly increase the luciferase activity of the
wild-type Luc-miR-23a-1 (WT) but had no effect on the mutant
Luc-miR-23a-1M3 (M3) (Fig. 4E). In
addition, the wild-type and mutant reporter gene vectors and the
plasmids with overexpression of HIF-1α or the control empty vector
were used to co-transfect with the HEK293FT cells. Results showed
that the overexpressed HIF-1α could improve the luciferase activity
in the wild-type Luc-miR-23a-1 (WT) by 1.8 times but had no effect
on the mutant Luc-miR-23a-1M3 (M3) (Fig.
4F). Intervening HIF-1α could significantly weaken the role of
the luciferase activity of the enhanced wild-type Luc-miR-23a-1
(WT) under anoxia (Fig. 4G). For
miR-23a-3, anoxia exposure (1% O2 concentration) and
co-transfection with the plasmid with overexpression of HIF-1α
could improve the luciferase activity of the wild-type
Luc-miR-23a-3 (WT) by 2.7- and 1.9-fold but had no effect on the
mutant Luc-miR-23a-3 (M) (Fig. 4J and
K). Intervening with HIF-1α under anoxia significantly weakened
the activity of the wild-type Luc-miR-23a-3 (WT) reporter gene
(Fig. 4L). These results indicated
that anoxia upregulated the expression of miR-23a-1 and miR-23a-3,
which was achieved by the transcriptional activation of HIF-1α.
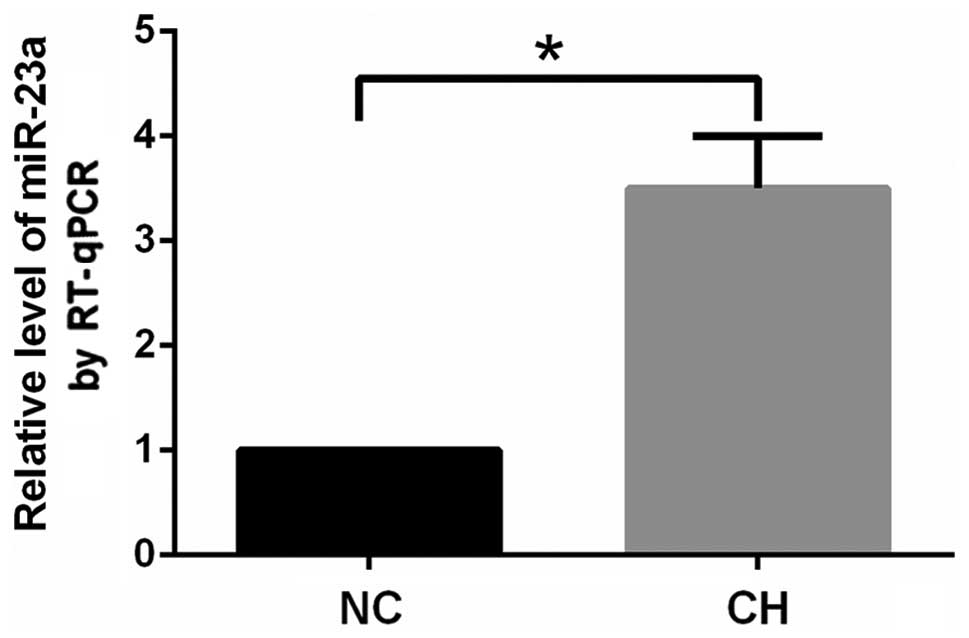
Effect of chronic anoxia on mPAP, RV
weight index, and pulmonary arteriole wall, intima-media thickness,
and miR-23a expression
The mean pulmonary arterial pressure in the CH group
increased significantly (P<0.05), compared with that of the
control group (Table I). This
suggested that CH significantly increased the pulmonary arterial
pressure. RV/(LV+S) in the CH group increased significantly
compared with that in the NC group (P<0.05). It indicated that
CH could lead to right ventricle hypertrophy of the rat. We
measured the outer diameter and canal wall thickness (outer
diameter-inner diameter), and intima-media thickness. The result
indicated that the pulmonary arterioles of the rats in the NC group
had thin canal walls and large lumens with an outer diameter of
81.31±2.8 µm, canal wall thickness of 10.57±2.6 µm, and
intima-media thickness of 3.6±0.8 µm (Table I). The outer diameter of pulmonary
arterioles in the CH group was 86.61±6.1 µm, canal wall thickness
was 21.3±4.4 µm, and intima-media thickness was 8.8±1.6 µm. It
indicated that CH could significantly increase the thickness of the
pulmonary arteriole wall and lead to proliferation of the medial
smooth muscle cells and structure remodeling of the pulmonary
arterioles. The expression of miR-23a in the pulmonary arterioles
in the CH group increased significantly (P<0.05) compared with
that in the NC group (Fig. 5).
 | Table I.Effect of CH on the mPAP, RV weight
index, pulmonary arteriole wall, and intima-media thickness (mean ±
SD) of the rats. |
Table I.
Effect of CH on the mPAP, RV weight
index, pulmonary arteriole wall, and intima-media thickness (mean ±
SD) of the rats.
| Groups | Mean arterial
pressure (mmHg) | RV (LV+S) | Outer diameter
(mm) | Canal wall thickness
(mm) | Intima-media
thickness (mm) |
|---|
| NC group | 16.8±2.3 | 0.28±0.03 | 81.31±2.8 | 10.57±2.6 | 3.6±0.8 |
| CH group | 33.7±7.9a |
0.46±0.06a | 86.61±6.1 | 21.3±4.4a | 8.8±1.6a |
Discussion
The pulmonary arteriole canal wall comprises
endothelial cells, smooth muscle cells and fibroblasts. PASMCs are
the major effector cells during the systolic process of the
pulmonary arterioles due to hypoxia (18,19) and
the key cells participating in pulmonary vascular structural
remodeling during the CH process. Previous studies have shown that
hypoxia is significant in in vitro primary PASMCs (20). In the experiment involving detection
of the proliferative activity of PASMCs with EdU staining, it was
found that the positive rate of the EdU staining results of PASMCs
improved significantly at 48 h after exposure to 3% O2
hypoxia, suggesting that hypoxia enables the proliferative activity
of PASMCs to improve. It has been shown that the proliferative
activity of PASMCs decreased significantly following exposure to 1%
O2 hypoxia, suggesting that hypoxia can also inhibit
cell proliferation (21). Thus, the
effect of hypoxia on the proliferative activity of PASMCs is
closely associated with oxygen concentration.
Other studies showed that the phenotypic
transformation of VSMCs occurs earlier than the cellular
proliferation and migration, and the phenotypic transformation of
VSMCs is often accompanied with changes in the expression of the
phenotypic specific marker protein (22). There is also evidence suggesting that
multiple stimulations could cause phenotypic transformation in
VSMCs (23). Serum stimulation and
hunger can influence the expression of the contractile phenotype
markers in VSMCs cultures (24).
Hunger can upregulate the phenotypic marker expression in VSMCs
thus enabling VSMCs to have contractile phenotype. Under the
simulations of multiple types of cytokines and growth factors,
VSMCs can also transform from the differentiated phenotype with a
systolic function into de-differentiated phenotype with migration
and proliferation abilities. The present study found that the
exposure to hypoxia for 24 or 48 h downregulated the expression of
phenotypic marker proteins in PASMCs. However, we need to study
this phenomenon further to understand the mechanism controlling
this downregulation.
miR-23a is extensively expressed in different
animals, and its gene sequence is highly conserved. In the mammals,
miR-23a is mainly expressed in the nerve tissue, particularly, in
the process of the nervous system development, however, later it
maintains at a relatively low expression level. Changes in the
expression level of miR-23a are closely associated with activities
such as proliferation and migration of neurocytes. Prior studies
have discovered that miR-23a is expressed abnormally in multiple
tumors and closely associated with the occurrence and progression
of tumors. It regulates tumor proliferation, apoptosis, metastasis
and invasion (13,15). In the present study, we conducted
gain-of-function and loss-of-function experiments by transfecting
cells with chemosynthetic miR-23a-mimic and miR-23a inhibitor. We
obtained results suggesting that the expression levels of the
contractile marker proteins increased significantly after
transfection with miR-23a inhibitor under hypoxia compared with
those in the inhibitor control group. Positive rate of the EdU
staining in PASMCs decreased significantly. In addition,
transfection with miR-23a mimic downregulated the expression of
contractile marker proteins in PASMCs and strengthened the
proliferative activity under normoxia.
We demonstrated that miR-23a also played an
important role in regulating the anoxia-induced phenotypic
transformation in PASMCs. The expression level of miR-23a in PASMCs
decreased significantly when the cells were transfected with the
HIF-1α specific siRNA under hypoxia, indicating that the
upregulation of miR-23a under hypoxia was regulated by HIF-1. The
levels of pri-miR-23a-1 and pri-miR-23a-3 in PASMCs increased
significantly after hypoxia treatment while the expression level of
pri-miR-23a-2 did not change significantly, suggesting that hypoxia
can improve the transcription of miR-23a-1 and miR-23a-3. The
expression levels of pri-miR-23a-1 and pri-miR-23a-3 were inhibited
while the expression level of pri-miR-23a-2 did not change
significantly after PASMCs were transfected with the HIF-1α
specific siRNA under hypoxia, indicating that HIF-1α participates
in anoxia-induced upregulation of the expression of miR-23a-1 and
miR-23a-3.
HIF-1α binding to its target sites under hypoxia was
detected with the ChIP-qPCR method. Results indicated that HIF-1α
binding to its target sites within 5′-UTR of miR-23a-1 in PASMCs
increased significantly at 24 and 48 h after hypoxia.
The dual-luciferase reporter gene experiment result
indicated that the regulatory region containing the HIF-1 binding
sequence upstream of miR-23a-1 and miR-23a-3 exerted its
strengthened sub-functions. The hypoxia environment plays a role in
activating the transcription of miR-23a-1 and miR-23a-3 by
increasing rate of HIF-1α binding to the cis-acting
elements. The above mentioned results demonstrated that the
mechanism of hypoxia in upregulating the expression of miR-23a in
PASMCs may be caused by the role of HIF-1α in activating the
transcription of miR-23a-1 and miR-23a-3. Differences in HIF-1α
binding rate among the miR-23a-1, miR-23a-2 and miR-23a-3 regions
may be the internal mechanism responsible for the different
transcriptional levels of various encoding genes of miR-23a under
hypoxia.
Rats were put in the low-pressure hypoxia animal
chamber at a simulated altitude of 5,000 m and exposed to CH for 21
days to replicate the HPH models. The experimental results
suggested that the pulmonary arterial pressure rose significantly
at 21 days after CH. Pulmonary arteriole vascular wall and tunica
media vasorum thickness increased significantly and a series of
morphological changes including structural reconstruction and right
ventricle hypertrophy occurred. These results were consistent with
the results obtained in a previous study (25). Hypoxia significantly increased the
expression of miR-23a in the pulmonary arteriole compared with
normoxia, indicating that miR-23a may be involved in regulating the
hypoxic pulmonary vascular remodeling. Regulating the miR-23a
expression may become one of the effective therapeutic approaches
for targeted therapy of HPH.
In conclusion, we have demonstrated that miR-23a
played an important role in anoxia-induced phenotypic
transformation in PASMCs. Future studies are to investigate whether
miR-23a can participate in such functional changes as
anoxia-induced apoptosis, secretion and migration. We detected the
expression of miR-23a in rat pulmonary arterial tissue with CH and
discovered changes in miR-23a level following CH. However, further
research should be conducted to investigate whether miR-23a can
sufficiently influence the occurrence of HPH in rats.
Acknowledgements
The present study is funded by the project: Major
Medical Research Program of Health Department of Hebei Province
(20110012).
References
|
1
|
Bishop T and Ratcliffe PJ: HIF hydroxylase
pathways in cardiovascular physiology and medicine. Circ Res.
117:65–79. 2015. View Article : Google Scholar : PubMed/NCBI
|
|
2
|
Wilkins MR, Ghofrani HA, Weissmann N,
Aldashev A and Zhao L: Pathophysiology and treatment of
high-altitude pulmonary vascular disease. Circulation. 131:582–590.
2015. View Article : Google Scholar : PubMed/NCBI
|
|
3
|
Shovlin CL: Pulmonary arteriovenous
malformations. Am J Respir Crit Care Med. 190:1217–1228. 2014.
View Article : Google Scholar : PubMed/NCBI
|
|
4
|
Hu J, Xu Q, McTiernan C, Lai YC,
Osei-Hwedieh D and Gladwin M: Novel targets of drug treatment for
pulmonary hypertension. Am J Cardiovasc Drugs. 15:225–234. 2015.
View Article : Google Scholar : PubMed/NCBI
|
|
5
|
Vaillancourt M, Ruffenach G, Meloche J and
Bonnet S: Adaptation and remodelling of the pulmonary circulation
in pulmonary hypertension. Can J Cardiol. 31:407–415. 2015.
View Article : Google Scholar : PubMed/NCBI
|
|
6
|
Lai N, Lu W and Wang J: Ca(2+) and ion
channels in hypoxia-mediated pulmonary hypertension. Int J Clin Exp
Pathol. 8:1081–1092. 2015.PubMed/NCBI
|
|
7
|
Jernigan NL: Smooth muscle acid-sensing
ion channel 1: pathophysiological implication in hypoxic pulmonary
hypertension. Exp Physiol. 100:111–120. 2015. View Article : Google Scholar : PubMed/NCBI
|
|
8
|
Lee A, McLean D, Choi J, Kang H, Chang W
and Kim J: Therapeutic implications of microRNAs in pulmonary
arterial hypertension. BMB Rep. 47:311–317. 2014. View Article : Google Scholar : PubMed/NCBI
|
|
9
|
Ishii T, Warabi E, Siow RC and Mann GE:
Sequestosome1/p62: a regulator of redox-sensitive voltage-activated
potassium channels, arterial remodeling, inflammation, and neurite
outgrowth. Free Radic Biol Med. 65:102–116. 2013. View Article : Google Scholar : PubMed/NCBI
|
|
10
|
Yamamura A, Yamamura H and Yuan JX:
Enhanced Ca2+-sensing receptor function in pulmonary
hypertension. Yakugaku Zasshi. 133:1351–1359. 2013.(In Japanese).
View Article : Google Scholar : PubMed/NCBI
|
|
11
|
Saito Y, Nakamura K, Akagi S, Sarashina T,
Ejiri K, Miura A, Ogawa A, Matsubara H and Ito H: Epoprostenol
sodium for treatment of pulmonary arterial hypertension. Vasc
Health Risk Manag. 11:265–270. 2015.PubMed/NCBI
|
|
12
|
Wang XH: MicroRNA in myogenesis and muscle
atrophy. Curr Opin Clin Nutr Metab Care. 16:258–266. 2013.
View Article : Google Scholar : PubMed/NCBI
|
|
13
|
Henshall DC: MicroRNA and epilepsy:
profiling, functions and potential clinical applications. Curr Opin
Neurol. 27:199–205. 2014. View Article : Google Scholar : PubMed/NCBI
|
|
14
|
Kunz M: MicroRNAs in melanoma biology. Adv
Exp Med Biol. 774:103–120. 2013. View Article : Google Scholar : PubMed/NCBI
|
|
15
|
Han M, Toli J and Abdellatif M: MicroRNAs
in the cardiovascular system. Curr Opin Cardiol. 26:181–189. 2011.
View Article : Google Scholar : PubMed/NCBI
|
|
16
|
Chhabra R, Dubey R and Saini N:
Cooperative and individualistic functions of the microRNAs in the
miR-23a~27a~24-2 cluster and its implication in human diseases. Mol
Cancer. 9:2322010. View Article : Google Scholar : PubMed/NCBI
|
|
17
|
Dang CV: Rethinking the Warburg effect
with Myc micromanaging glutamine metabolism. Cancer Res.
70:859–862. 2010. View Article : Google Scholar : PubMed/NCBI
|
|
18
|
Huetsch J and Shimoda LA: Na(+)/H(+)
exchange and hypoxic pulmonary hypertension. Pulm Circ. 5:228–243.
2015. View
Article : Google Scholar : PubMed/NCBI
|
|
19
|
West JB: High-altitude medicine. Am J
Respir Crit Care Med. 186:1229–1237. 2012. View Article : Google Scholar : PubMed/NCBI
|
|
20
|
Killilea DW, Hester R, Balczon R, Babal P
and Gillespie MN: Free radical production in hypoxic pulmonary
artery smooth muscle cells. Am J Physiol Lung Cell Mol Physiol.
279:L408–L412. 2000.PubMed/NCBI
|
|
21
|
Yamamura A: Pathological function of
Ca2+-sensing receptor in pulmonary arterial
hypertension. J Smooth Muscle Res. 50:8–17. 2014. View Article : Google Scholar : PubMed/NCBI
|
|
22
|
Jernigan NL and Resta TC: Calcium
homeostasis and sensitization in pulmonary arterial smooth muscle.
Microcirculation. 21:259–271. 2014. View Article : Google Scholar : PubMed/NCBI
|
|
23
|
Kuhr FK, Smith KA, Song MY, Levitan I and
Yuan JX: New mechanisms of pulmonary arterial hypertension: role of
Ca2+ signaling. Am J Physiol Heart Circ Physiol.
302:H1546–H1562. 2012. View Article : Google Scholar : PubMed/NCBI
|
|
24
|
Dang CV, Le A and Gao P: MYC-induced
cancer cell energy metabolism and therapeutic opportunities. Clin
Cancer Res. 15:6479–6483. 2009. View Article : Google Scholar : PubMed/NCBI
|
|
25
|
Sutendra G and Michelakis ED: The
metabolic basis of pulmonary arterial hypertension. Cell Metab.
19:558–573. 2014. View Article : Google Scholar : PubMed/NCBI
|