Introduction
Recent studies have revealed that microRNAs (miRNAs)
released by cancer cells and circulating in the plasma are
promising candidates for non-invasive cancer detection (1–3). However,
the evidence that blood also contains miRNAs resulting from the
lysis of hematopoietic cells (hemolysis), and whose levels
correlate with blood cell counts (4,5), makes
their identification complex. Certain cellular miRNAs have been
proposed to be tumour-associated circulating biomarkers (6); however, differences in their levels may
reflect blood cell-based phenomena rather than the presence of
cancer.
Hemolysis is therefore an important factor that
should be considered in studies of miRNA. Various hemolysis indices
based on absorbance measurements have previously been suggested
(3,5,7,8) to identify hemolysed samples that can be
discarded from studies. However, their removal limits the search
for circulating biomarkers and prohibits the development of a tool
for the detection of circulating miRNAs that may be used in
clinical practice. An alternative approach to sample removal would
be to test the potential miRNA biomarkers for their sensitivity to
hemolysis and to proceed only with miRNAs that are not influenced
by hemolysis. The present study proposes a procedure that
integrates the quantification of miRNAs within the levels of an
ad-hoc designed hemolysis calibration curve and directly evaluates
the influence of hemolysis on their expression. In addition, the
present study used the same calibration curve to estimate the
percentage of red blood cells (RBCs) in plasma samples and
therefore evaluate how the expression in RBCs of the potential
miRNA biomarkers may be critical in the series of samples in
analysis. The present study describes the procedure by applying it
to data obtained from plasma samples collected for studies
conducted at the Scientific Institutes for Research and Treatment
Foundation ‘National Cancer Institute’ (Milan, Italy).
Materials and methods
Patient cohort
The series of plasma samples used to estimate the
unknown percentage of RBCs was collected from 110 individuals (57%
female; 43% male) who tested positive on a fecal immunochemical
test and underwent colonoscopy at the Scientific Institutes for
Research and Treatment Foundation ‘National Cancer Institute’
(Milan, Italy). All patients provided written informed consent to
donate their blood for research purposes. Plasma samples were
collected between February 2013 and April 2014. Patient age at
blood collection was between 50 and 70 years old (median age, 61
years old). The study design was approved by the institutional
review board of the Scientific Institutes for Research and
Treatment Foundation ‘National Cancer Institute’.
In-vitro controlled hemolysis
experiment
Plasma and RBC samples, separated from a blood
sample collected from a healthy donor, were kindly provided by Dr
Appierto from the Scientific Institutes for Research and Treatment
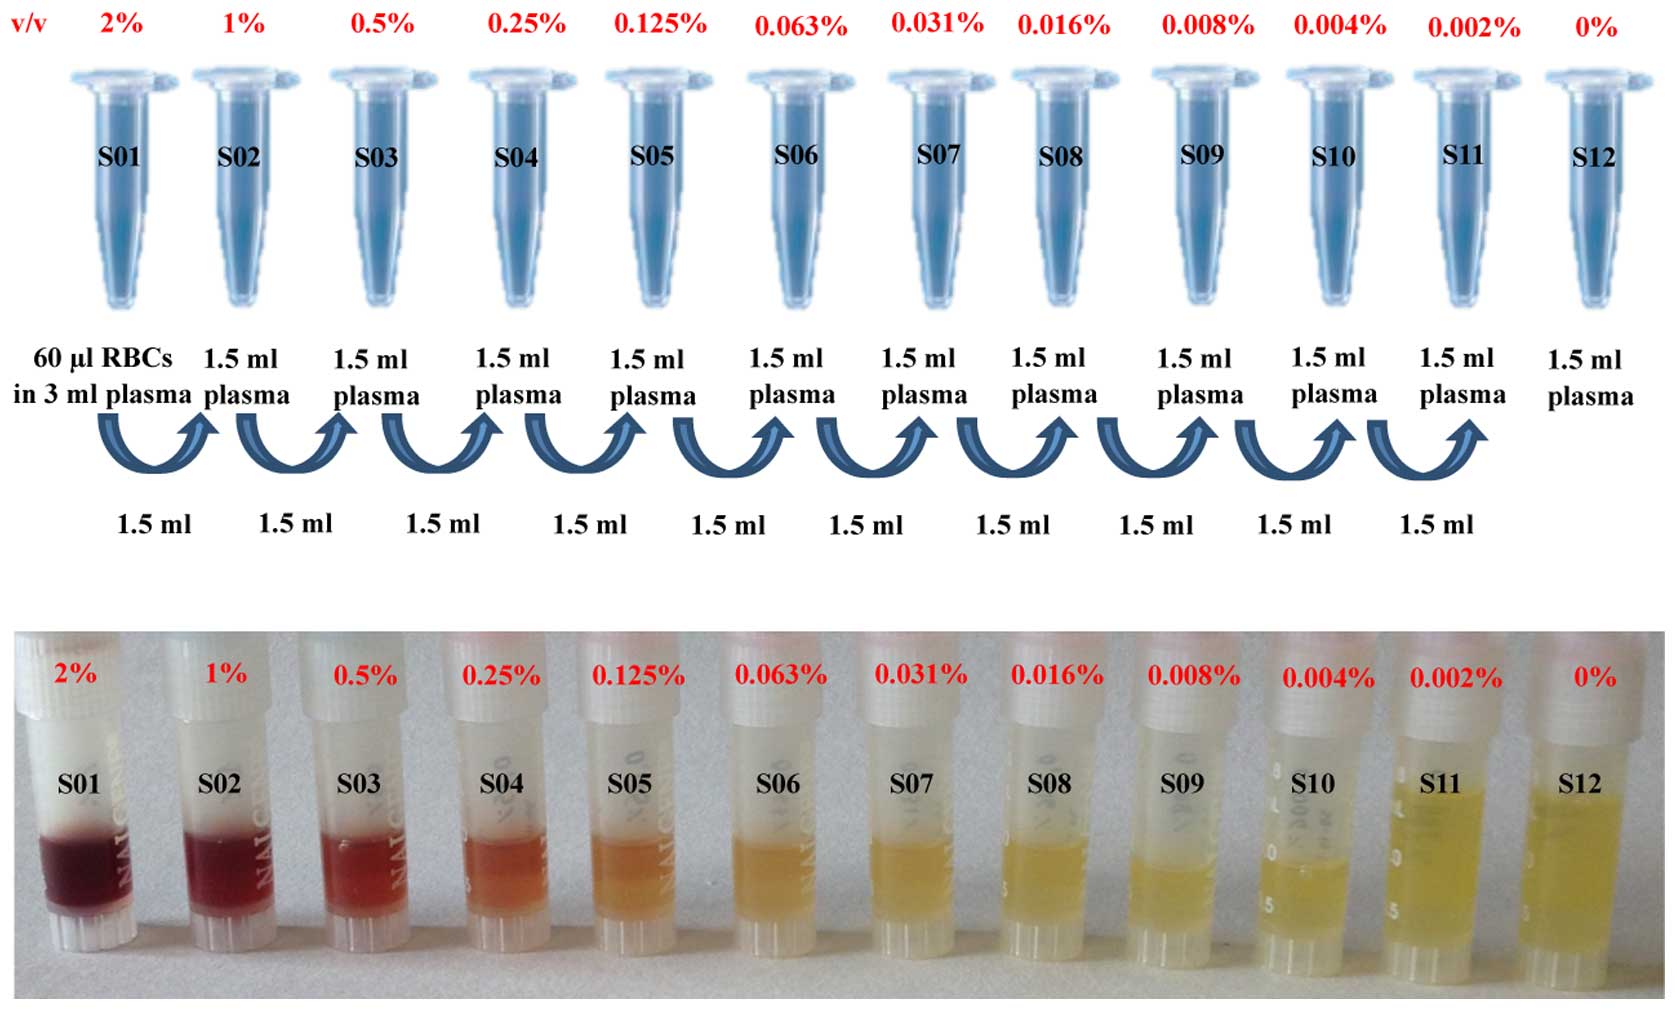
Foundation ‘National Cancer Institute’ (7). Hemolysis was artificially introduced in
the plasma by adding RBCs starting from a 2% concentration and by
performing ten 1:2 serial dilutions (range, 0.002–1% v/v) for a
total of twelve samples (S01-12), including the uncontaminated
plasma (0%, S12). Fig. 1 displays the
dilution scheme of the experiment and the RBC colorimetric scale of
the twelve samples.
Absorbance measurement
A total of 2 µl of each sample were used to measure
absorbance on a NanoDrop™ 1000 (Thermo Fisher Scientific, Inc.,
Waltham, MA, USA). As demonstrated in Table I, the level of hemolysis for each
plasma sample was computed according to the hemolysis indices
previously used in other miRNA-related studies: The absorbance peak
at 414 nm (5), the hemolysis ratio
(3), the H-score (7) and the Harboe method, which measures the
concentration of hemoglobin (8).
 | Table I.Descriptive statistics of the
considered hemolysis indices. |
Table I.
Descriptive statistics of the
considered hemolysis indices.
|
|
|
| Absorbance 414 nm
(A414) | Hemolysis ratio
(A414/A375) | H-score
(A414-A385)+0.16xA385 | Harboe index, g/l
(167.2xA415-83.6x A380-83.6x A450)x1/1,000 |
|---|
|
|
|
|
|
|
|
|
|---|
| Sample | RBCs, % | n | Median | Range | Median | Range | Median | Range | Median | Range |
|---|
| S11 | 0.002 | 3 | 0.117 | 0.021 | 1.000 | 0.023 | 0.0204 | 0.002 | 0.001 | 0.0001 |
| S10 | 0.004 | 3 | 0.134 | 0.014 | 1.021 | 0.033 | 0.0265 | 0.001 | 0.002 | 0.0003 |
| S09 | 0.008 | 3 | 0.151 | 0.015 | 1.091 | 0.042 | 0.0348 | 0.005 | 0.004 | 0.0004 |
| S08 | 0.016 | 3 | 0.184 | 0.005 | 1.170 | 0.036 | 0.0540 | 0.005 | 0.007 | 0.0004 |
| S07 | 0.031 | 3 | 0.228 | 0.022 | 1.432 | 0.063 | 0.0890 | 0.004 | 0.014 | 0.0006 |
| S06 | 0.063 | 3 | 0.329 | 0.012 | 1.693 | 0.087 | 0.1490 | 0.003 | 0.025 | 0.0006 |
| S05 | 0.125 | 3 | 0.373 | 0.015 | 1.673 | 0.045 | 0.1690 | 0.002 | 0.029 | 0.0008 |
| S04 | 0.250 | 3 | 0.720 | 0.062 | 2.156 | 0.116 | 0.3910 | 0.022 | 0.071 | 0.0042 |
| S03 | 0.500 | 3 | 1.506 | 0.055 | 2.477 | 0.043 | 0.8840 | 0.023 | 0.167 | 0.0078 |
| S02 | 1.000 | 3 | 2.409 | 0.022 | 2.145 | 0.072 | 1.2380 | 0.054 | 0.254 | 0.0107 |
RNA extraction and reverse
transcription-quantitative polymerase chain reaction (RT-qPCR)
Total RNA (including small non-coding RNA molecules
of between 50 and 250 nucleotides in length) was extracted from 600
µl of each of the vials as previously described (3). A total of two independent RNA
extractions were performed.
TaqMan MicroRNA assays were used for
miRNA quantification
A total of 2 µl of RNA was reverse transcribed to
complementary DNA using the TaqMan MicroRNA Reverse Transcription
kit and the commercially available primers specific to the 8 miRNAs
analysed (Thermo Fisher Scientific, Inc.), according to the
manufacturer's protocol, in a total reaction volume of 15 µl. The
names of the miRNAs analysed, the assay catalogue number and the
mature miRNA sequence amplified, are listed in Table II. No-template-controls were used as
a negative control of each assay. qPCR was performed using the
TaqMan FAST Universal PCR Master Mix, no AmpErase® UNG
according to the manufacturer's protocol in a PRISM 7900HT
Real-Time PCR system (both Thermo Fisher Scientific, Inc.). The
following thermocycling conditions were used: 95°C for 20 sec; 40
cycles of 95°C for 60 sec and 60°C for 20 sec. Technical duplicates
of Cq (threshold cycle) measurements were performed. Normalization
was performed using the 2−ΔΔCq method, according to the
criteria specified in the NqA algorithm as described previously
(9,10).
| Table II.List of the miRNAs analysed in the
in-vitro controlled hemolysis experiment. |
Table II.
List of the miRNAs analysed in the
in-vitro controlled hemolysis experiment.
| miRNA ID | Assay type | Mature miRNA
sequence |
|---|
| Hsa-miR-16 | 000391 |
UAGCAGCACGUAAAUAUUGGCG |
| Hsa-miR-30c | 000419 |
UGUAAACAUCCUACACUCUCAGC |
| Hsa-miR-92a | 000431 |
UAUUGCACUUGUCCCGGCCUGU |
| Hsa-miR-320 | 002277 |
AAAAGCUGGGUUGAGAGGGCGA |
| Hsa-miR-324-3p | 002161 |
ACUGCCCCAGGUGCUGCUGG |
| Hsa-miR-378 | 002243 |
ACUGGACUUGGAGUCAGAAGG |
| Hsa-miR-451 | 001141 |
AAACCGUUACCAUUACUGAGUU |
| Hsa-miR-486 | 001278 |
UCCUGUACUGAGCUGCCCCGAG |
Statistical analysis
The ΔCq values (11)
were used as pivotal variable to evaluate the influence of
hemolysis on each miRNA of interest. Specifically, for each sample
(12 samples, s), for each replicate (two replicates, j) and for
each extraction (two extractions, i) the ΔCq was obtained as
follows: ΔCqijs = Cqijs -
CqijsREF, where CqijsREF is the Cq average of
reference miRNAs identified on the bases of the NqA algorithm
(9,10). Subsequently, for each miRNA, the
relative quantity (RQ) was computed by subtracting the ΔCq value of
each sample from the 0% sample (S12) as follows: RQijs =
2(−ΔΔCqijs), where ΔΔCqijs =
ΔCqijs - ΔCqijS12.
The significance of the changes in expression among
the 12 samples was evaluated by resorting to the non-parametric
Brown-Mood test, based on the comparison of the median scores
(12). To consider the simultaneous
determination of the various miRNAs on the same sample, the P-value
of the test was adjusted according to the Bonferroni method by
considering the significance level of 0.05. In addition, to
evaluate the relevance of the change of expression compared with
the uncontaminated plasma sample (S12) and to consider the
simultaneous determination of the miRNAs, the 95% simultaneous
confidence interval (SCI) of the log2(RQijs)
was computed for each miRNA, according to the bootstrap percentile
method (13).
Following the conventional two-fold threshold rule,
the low levels and high levels of a specific miRNA were considered
statistically relevant due to RBC contamination, if the upper limit
of the 95% SCI of log2(RQ) was ≤-1 and the lower limit
of the 95% SCI of log2(RQ) was ≥1. In addition, by
appropriately fitting the values of the considered hemolysis index
computed starting from the absorbance values as a function of the
known induced percentage of RBCs of the 10 serial dilutions
(samples S02-11), a calibration hemolysis curve was generated and,
by applying the inverse regression method (14), the unknown percentage of RBCs in the
series of 110 plasma samples was estimated. Statistical analysis
was performed by developing ad hoc programs with the SAS software
version 9.2 (SAS Institute, Inc., Cary, NC, USA).
Results
RNA extracted from the twelve plasma samples
contaminated with scaling concentrations of red blood cells
(S01-12), was used to measure the influence of hemolysis on four
miRNAs known to also be present in RBCs [miR-16, miR-92a, miR-451
and miR-486 (4,5)] and on four miRNAs (miR-30c, miR-320,
miR-324-3p and miR-378) that were observed to be circulating in
plasma. miR-378 was previously identified to be associated with the
presence of colorectal cancer (CRC), independently from the
hemolysis levels of the samples in analysis (3). Six miRNAs exhibited a significant change
in expression in the 12 samples, according to the Brown-Mood test
(miR-16, P<0.001; miR-92a, P=0.006; miR-451, P=0.011; miR-486,
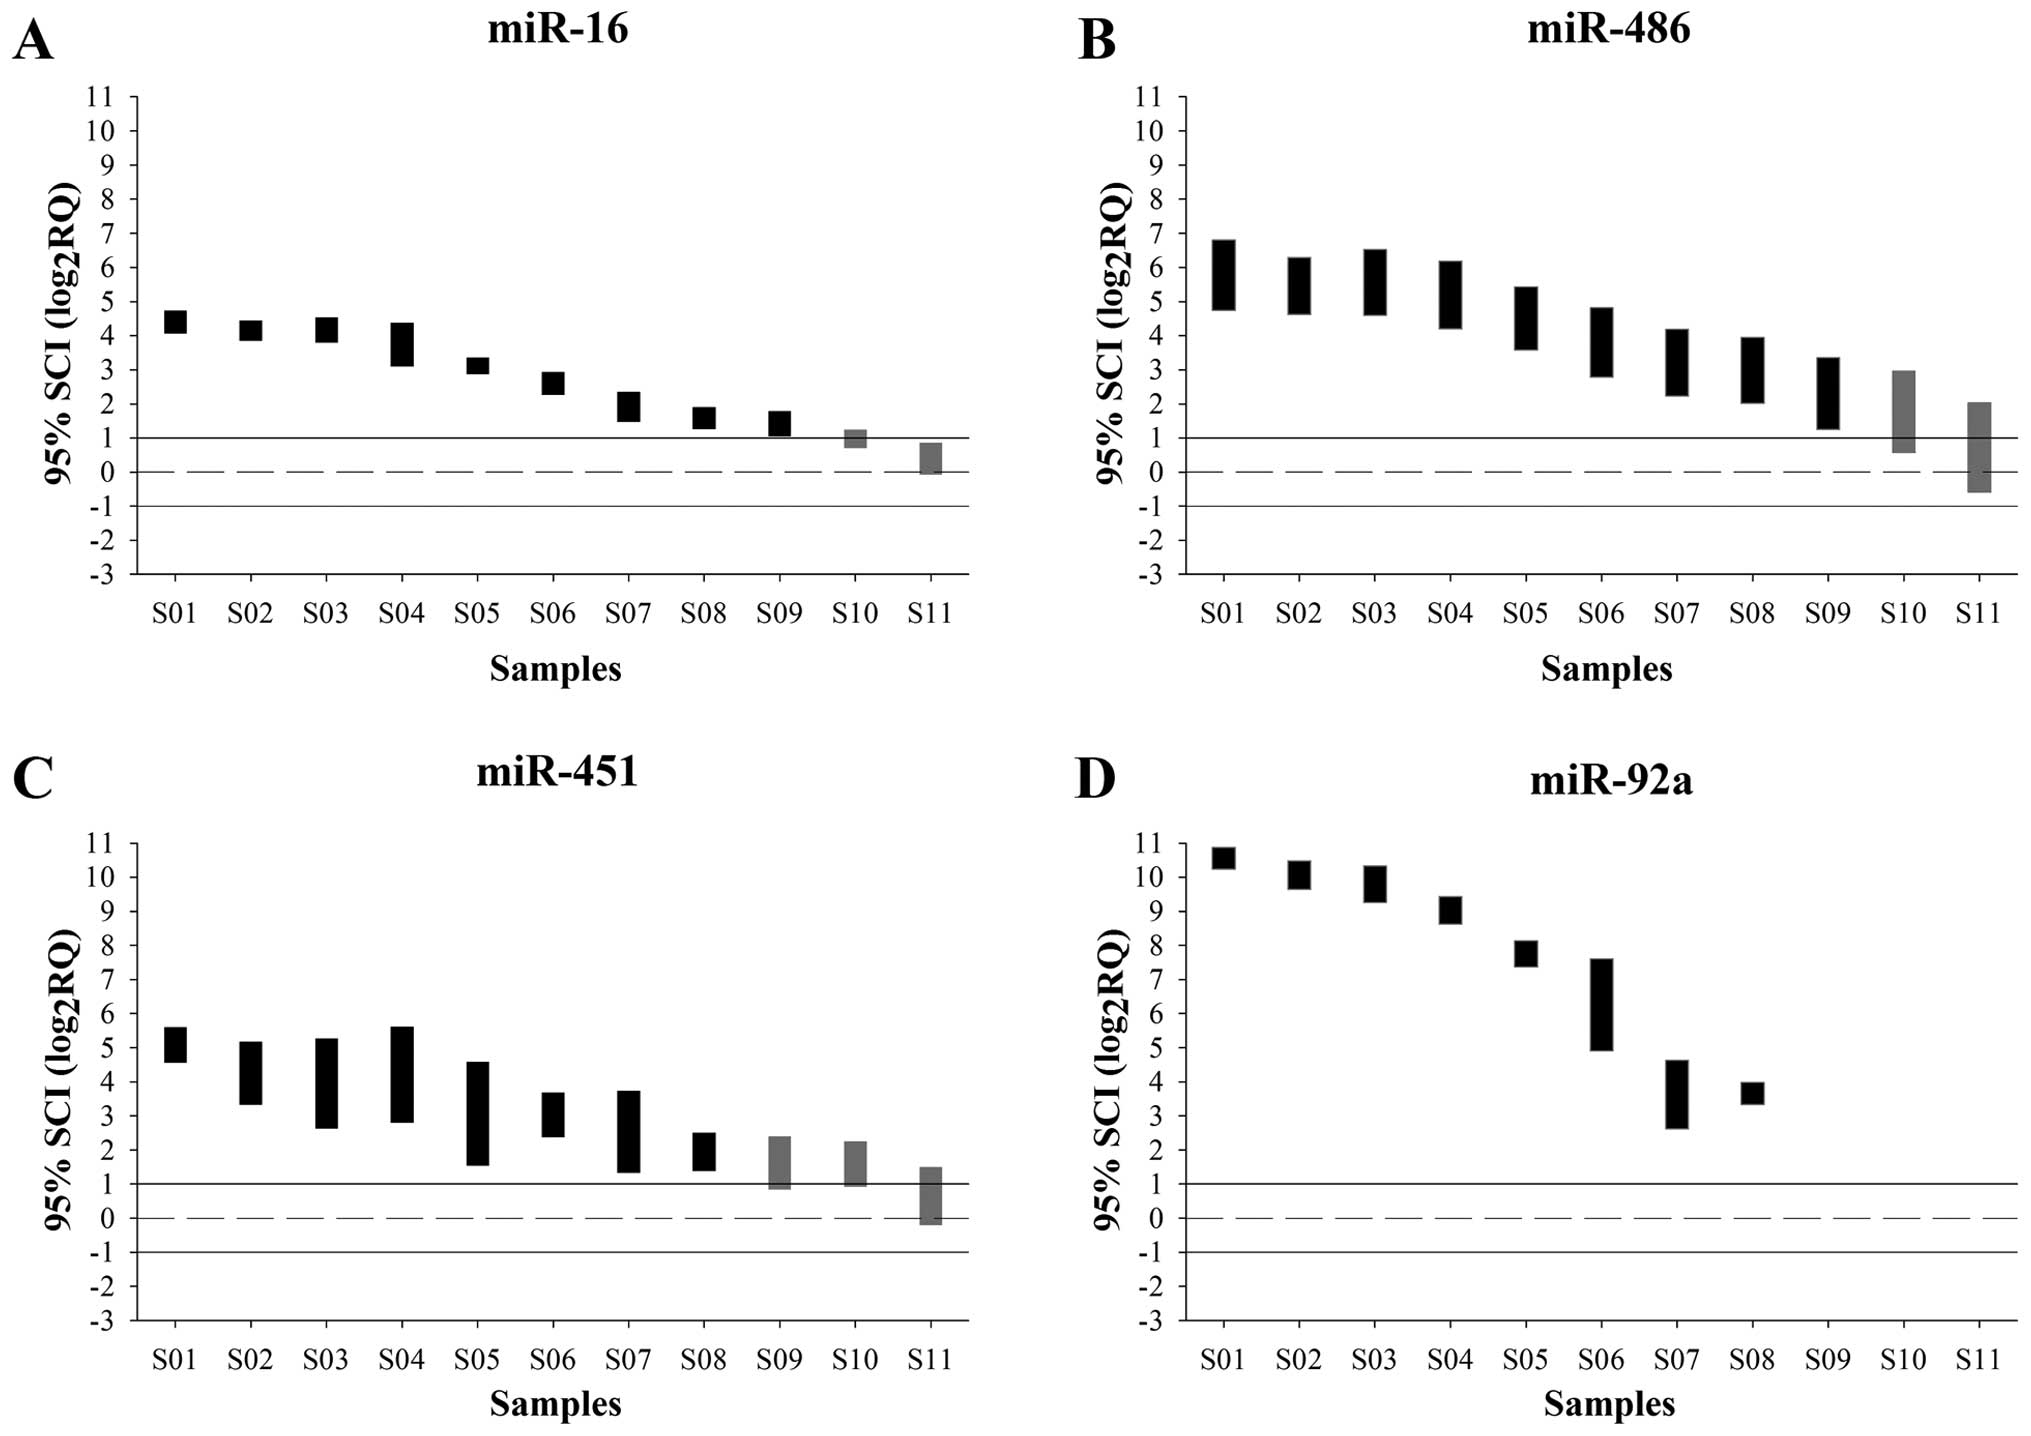
P<0.001; miR-320, P<0.001; and miR-324-3p, P=0.002). As shown
in Fig. 2, significantly elevated
levels of miR-16 and miR-486 were observed in contaminated samples
(S09-01) compared with the uncontaminated sample (S12) (Fig. 2A and B). Similarly, a significantly
increased level of miR-451 was detected starting from the sample
with a percentage of RBC contamination of 0.016% (S08) compared
with S12 (Fig. 2C). The majority of
Cq values of miR-92a were undetected between samples S12 and S09,
suggesting a specific association between its expression and the
presence of RBCs (Fig. 2D).
Accordingly, a significant increase in miR-92a expression was
observed starting from S08 (0.016% contamination with RBCs)
compared with the unhemolysed sample (Fig. 2D).
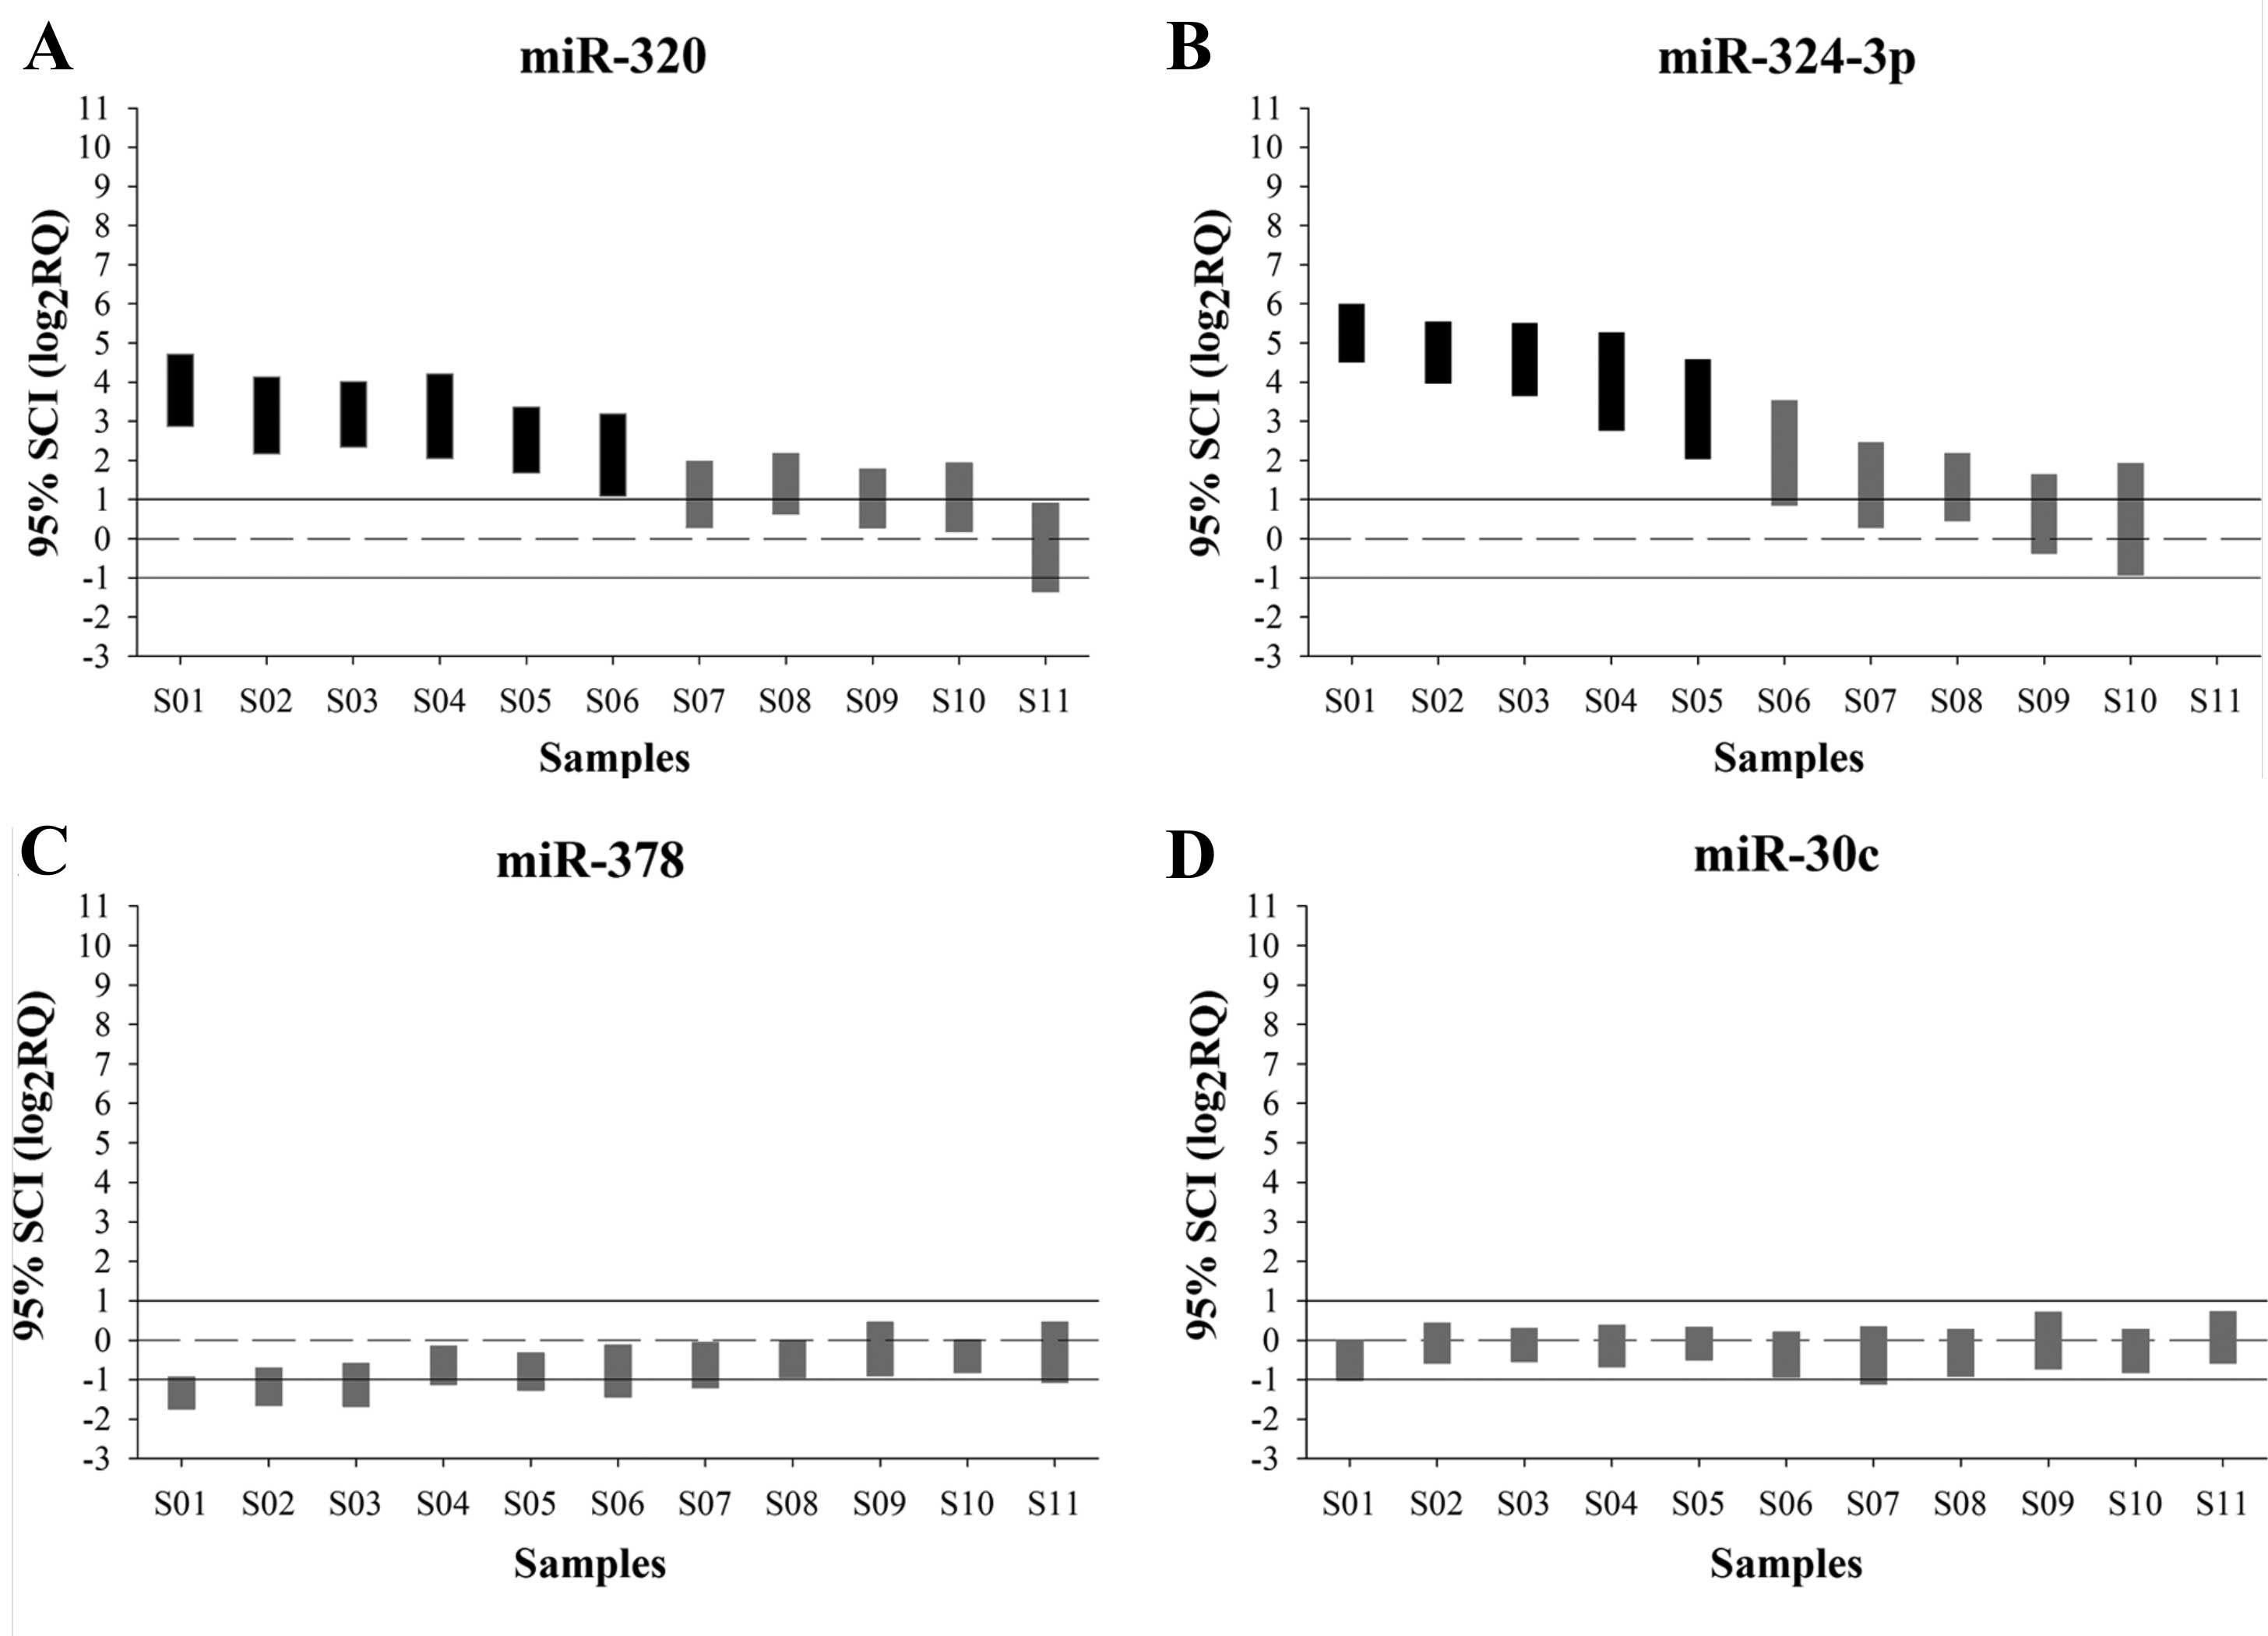
miR-320 and miR-324-3p demonstrated a significant
increase in expression starting from samples S06 and S05,
respectively, compared with the unhemolysed sample (Fig. 3A and B). By contrast, no significant
change in expression was observed with respect to S12 (0%
contamination with RBCs) for miR-378 (P=0.074) and miR-30c
(P=1.000) (Fig. 3C and D).
The present study also used the generated
calibration curve to estimate the unknown percentage of RBCs of
plasma samples in which miRNA expression investigation was
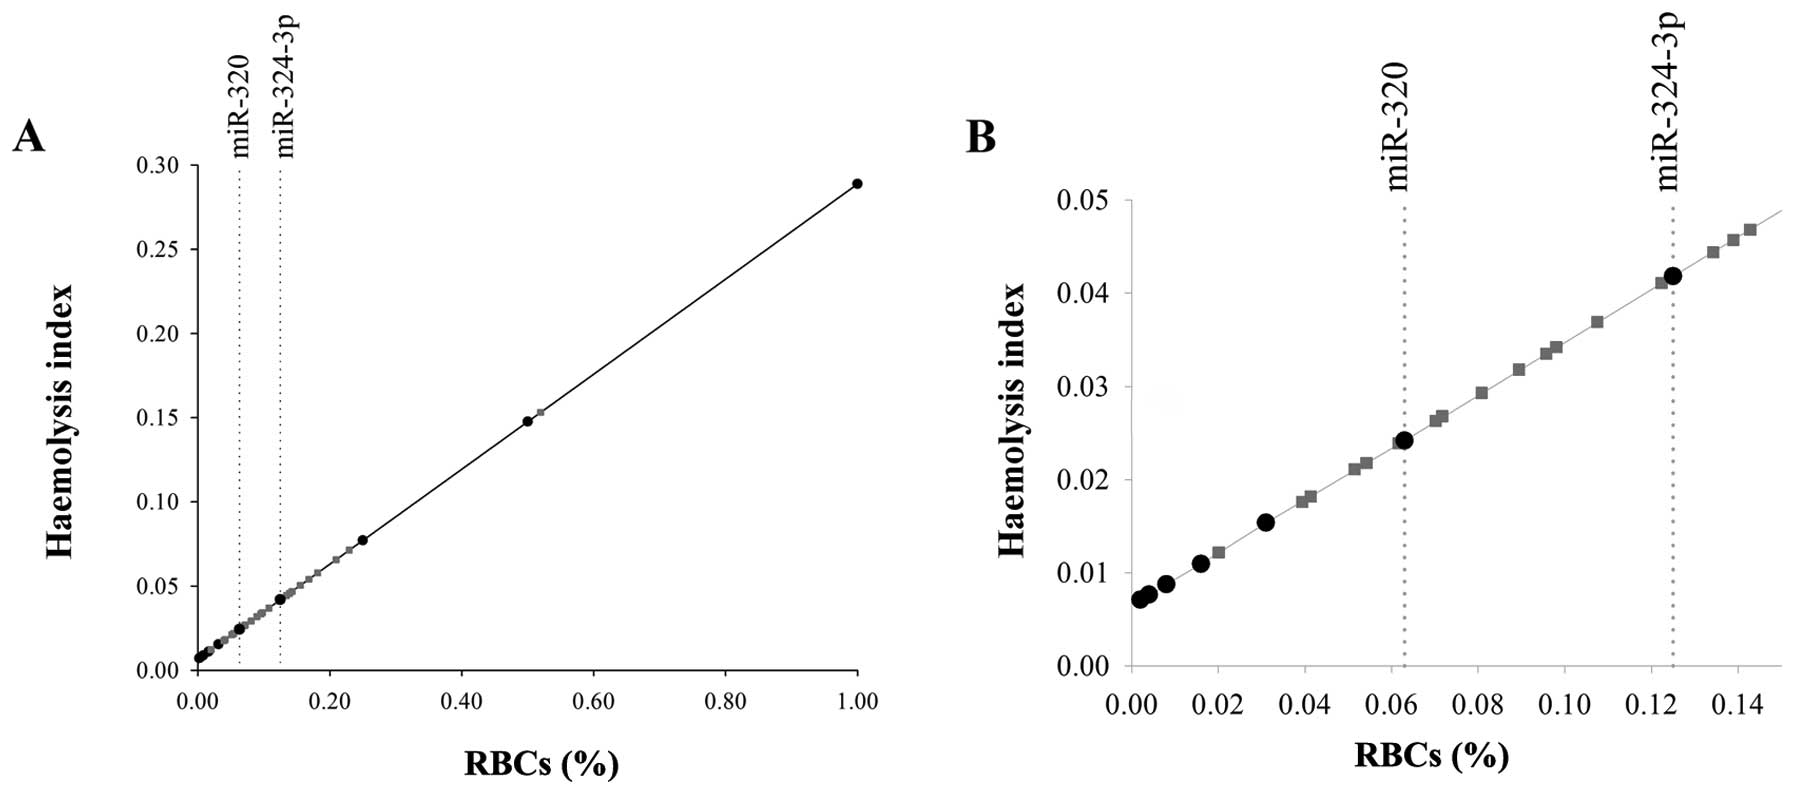
intended. Fig. 4 displays the
calibration process performed using, for illustration purposes, the
concentration of hemoglobin obtained with the Harboe method as
hemolysis index measured on 25/110 plasma samples analysed.
According to the calibration curve generated by fitting a linear
regression model, the percentage of RBCs of the plasma samples was
estimated by considering the regression parameters and the value of
the hemolysis index obtained for each sample (represented by grey
dots in Fig. 4).
The contemporary measurement of the percentage of
RBCs in plasma samples and of the influence of hemolysis on miRNA
expression on the same calibration curve provides a real estimation
of the number of samples for which the evaluation of the specific
miRNA may be considered critical. The vertical dotted lines in
Fig. 4B indicate the thresholds
identified for miR-320 and miR-324-3p (0.063 and 0.125%, S06 and
S05, respectively) and indicate the percentage of samples (~60 and
15%, respectively) where the expression levels of the miRNA will be
affected by the presence of RBCs.
Discussion
In the present study, a comprehensive procedure is
presented that allows the evaluation of the influence of hemolysis
on the expression of circulating miRNAs, as well as the estimation
of the unknown concentration of hemolysis in plasma samples where
the miRNAs will be measured. The quantification of miRNAs in
samples with known percentages of RBCs permits the determination of
the percentage at which RBC changes in miRNA expression may be
considered statistically relevant, and indicates whether miRNAs
should be discarded or retained for further analyses. By applying
the procedure to eight miRNAs observed to be circulating in plasma
samples, it was confirmed that four of them (miR-16, miR-92a,
miR-451 and miR-486) were hemolysis-associated and that miR-378 was
hemolysed independently, supporting the results of a previous
study, which identified it to be a hemolysis independent
CRC-associated circulating biomarker (3). In addition, the present study
highlighted that the expression of miR-30c was not influenced by
hemolysis, whereas the expression of miR-320 and miR-324-3p varied
according to the levels of hemolysis. These two miRNAs will be
discarded from further investigations and caution is advised when
using the sets of miRNAs as biomarkers for a particular phenotype
(miRNA signatures) that include miR-320 and miR-324-3p.
Furthermore, by exploiting previously proposed
hemolysis indices, based on absorbance measurements, a calibration
curve was constructed for the classification of plasma samples in
terms of percentage of RBCs. As reported by Yamada et al
(15), a potential method to avoid
hemolysis may be to exclude samples with visually recognizable
hemolysis from quantification and/or analysis. However, this
approach may raise certain issues, including the loss of plasma
samples (particularly of diseased patients) and the knowledge that
hemolysis affects miRNAs even when its level is not visible
(7). A potential solution for
considering all the samples and to overcome the hemolysis
interference on miRNA expression could be to apply appropriate
statistical methods that correct miRNA expression for the level of
RBC contamination in the target plasma samples. The present
procedure moves in this direction, as it proposes a more accurate
quantification of RBC contamination in plasma samples through a
standard curve.
In conclusion, the present methodological procedure
may be viewed as a tool for evaluation of the influence of
hemolysis on candidate circulating miRNA biomarkers. This procedure
should be introduced as an important step in the workflow for the
identification of new biomarkers.
Acknowledgements
The present study was supported by grants from the
Associazione Italiana per la Ricerca sul Cancro (grant no., 10529
to M.A. Pierotti; and special program no., 12162 to M. Gariboldi)
and by funds obtained through an Italian law that allows taxpayers
to allocate 0.5 percent share of their income tax contribution to a
research institution of their choice.
References
|
1
|
Schwarzenbach H, Nishida N, Calin GA and
Pantel K: Clinical relevance of circulating cell-free microRNAs in
cancer. Nat Rev Clin Oncol. 11:145–156. 2014. View Article : Google Scholar : PubMed/NCBI
|
|
2
|
Sozzi G, Boeri M, Rossi M, Verri C,
Suatoni P, Bravi F, Roz L, Conte D, Grassi M, Sverzellati N, et al:
Clinical utility of a plasma-based miRNA signature classifier
within computed tomography lung cancer screening: A correlative
MILD trial study. J Clin Oncol. 32:768–773. 2014. View Article : Google Scholar : PubMed/NCBI
|
|
3
|
Zanutto S, Pizzamiglio S, Ghilotti M,
Bertan C, Ravagnani F, Perrone F, Leo E, Pilotti S, Verderio P,
Gariboldi M and Pierotti MA: Circulating miR-378 in plasma: A
reliable, hemolysis-independent biomarker for colorectal cancer. Br
J Cancer. 110:1001–1007. 2014. View Article : Google Scholar : PubMed/NCBI
|
|
4
|
Pritchard CC, Kroh E, Wood B, Arroyo JD,
Dougherty KJ, Miyaji MM, Tait JF and Tewari M: Blood cell origin of
circulating microRNAs: A cautionary note for cancer biomarker
studies. Cancer Prev Res (Phila). 5:492–497. 2012. View Article : Google Scholar : PubMed/NCBI
|
|
5
|
Kirschner MB, Kao SC, Edelman JJ,
Armstrong NJ, Vallely MP, van Zandwijk N and Reid G: Hemolysis
during sample preparation alters microRNA content of plasma. PLoS
One. 6:e241452011. View Article : Google Scholar : PubMed/NCBI
|
|
6
|
Kirschner MB, Edelman JJ, Kao SC, Vallely
MP, van Zandwijk N and Reid G: The impact of hemolysis on cell-free
microRNA biomarkers. Front Genet. 4:942013. View Article : Google Scholar : PubMed/NCBI
|
|
7
|
Appierto V, Callari M, Cavadini E, Morelli
D, Daidone MG and Tiberio P: A lipemia-independent
NanoDrop(®)-based
score to identify hemolysis in plasma and serum samples.
Bioanalysis. 6:1215–1226. 2014. View Article : Google Scholar : PubMed/NCBI
|
|
8
|
MacLellan SA, MacAulay C, Lam S and Garnis
C: Pre-profiling factors influencing serum microRNA levels. BMC
Clin Pathol. 14:272014. View Article : Google Scholar : PubMed/NCBI
|
|
9
|
Verderio P, Bottelli S, Ciniselli CM,
Pierotti MA, Gariboldi M and Pizzamiglio S: NqA: An R-based
algorithm for the normalization and analysis of microRNA
quantitative real-time polymerase chain reaction data. Anal
Biochem. 461:7–9. 2014. View Article : Google Scholar : PubMed/NCBI
|
|
10
|
Pizzamiglio S, Bottelli S, Ciniselli CM,
Zanutto S, Bertan C, Gariboldi M, Pierotti MA and Verderio P: A
normalization strategy for the analysis of plasma microRNA qPCR
data in colorectal cancer. Int J Cancer. 134:2016–2018. 2014.
View Article : Google Scholar : PubMed/NCBI
|
|
11
|
Livak KJ and Schmittgen TD: Analysis of
relative gene expression data using real-time quantitative PCR and
the 2(−Delta Delta C(T)) Method. Methods. 25:402–408. 2001.
View Article : Google Scholar : PubMed/NCBI
|
|
12
|
Gibbons JD and Chakraborti S:
Nonparametric Statistical Inference. 4th. Marcel Dekker; New York:
pp. 247–257. 2003
|
|
13
|
Pizzamiglio S, Cossa G, Gatti L, Beretta
GL, Corna E, Tinelli S, Verderio P and Perego P: Simultaneous
confidence intervals to compare gene expression profiles using ABC
transporter TaqMan microfluidic cards. Oncol Rep. 23:853–860.
2010.PubMed/NCBI
|
|
14
|
Pizzamiglio S, Verderio P, Orlando C and
Marubini E: Confidence interval for DNA/mRNA concentration by
real-time PCR. Int J Biol Markers. 22:232–236. 2007.PubMed/NCBI
|
|
15
|
Yamada A, Cox MA, Gaffney KA, Moreland A,
Boland CR and Goel A: Technical factors involved in the measurement
of circulating microRNA biomarkers for the detection of colorectal
neoplasia. PLoS One. 9:e1124812014. View Article : Google Scholar : PubMed/NCBI
|