Introduction
Gastric cancer (GC) is one of the most prevalent
cancers and the second most common cause of cancer-associated
mortality worldwide (1). Almost one
million people are diagnosed with GC each year. Despite decades of
a steady decline in the incidence of GC, the GC fatality rate
remains paradoxically high in most countries, particularly in those
of East Asia (2). GC is a
heterogeneous disease with numerous etiologies and potential
pathways of carcinogenesis (3,4), resulting
in a variation in the incidence rates of GC among different
geographies, ethnicities and genders (5). One of the main etiological risk factors
for GC is Helicobacter pylori infection, although only a
small proportion of individuals infected with H. pylori
develop GC (6,7).
Traditional methods for the treatment of GC include
surgery, chemotherapy, radiation therapy and combination therapy,
which is also known as multimodality therapy. However, GC is often
asymptomatic during its early stage, which results in the advanced
stage being generally refractory to those therapies (8). Even following radical gastrectomy, many
patients experience disease recurrence and succumb to the disease
within a few months to years; the 5-year survival rate of GC is
≤2/3 (9,10). Therefore, an early and effective
detection method that improves the chance of treating GC is
imperative.
Microarrays are good tools for investigating the
pathogenesis of various diseases (11–14).
Compared with traditional methods, next-generation sequencing-based
microarrays have the advantages of being unbiased, as they are not
limited to previously known or annotated transcripts, and allowing
more accurate quantification of genes with very low or high
expression levels (15). In addition,
transcriptome data detects other types of transcriptional signals,
including alternative splicing, transcriptional starts/stops, gene
fusions and expressed alleles (16).
Studies based on microarrays have provided significant insights
into the molecular basis of GC and novel therapeutic targets.
However, microarrays have predominantly been used to characterize
the genomic alterations of GC patients, while the validation of
potential target genes for GC has been rare (10,17,18),
restricting the application of microarrays to clinical
practice.
The present study employed an integrated analysis of
microarray data from the Gene Expression Omnibus (GEO) to identify
the differentially expressed genes (DEGs) between GC and normal
control (NC) tissues, which were then used to construct a
protein-protein interaction (PPI) network. Furthermore, the
significantly enriched functions of these genes were screened and
analyzed to discover the biological processes and signaling
pathways associated with GC. Finally, reverse
transcription-quantitative polymerase chain reaction (RT-qPCR) of
clinical samples was performed to validate the integrated analysis
approach. This study may improve the methods used to elucidate the
dysexpression of various genes in GC and be of some value for the
future diagnosis of GC in the clinic.
Materials and methods
Microarray data and data
preprocessing
Eligible GC gene expression datasets were identified
by searching the GEO database (https://www.ncbi.nlm.nih.gov/geo/). Data were included
if they met the following criteria: i) The expression profile of
whole genome sequencing; ii) data from the tissues of GC patients
in the clinic; and iii) raw or standardized data. Raw data were
normalized using the Z-score transformation method (19) to make data from different platforms
comparable. Matrix Laboratory software (version 2013a; MathWorks,
Natick, MA, USA) was used to identify differentially expressed
probe sets between tumor and adjacent tissues. A gene-specific
t-test was performed, after which P-values and the effect size of
individual microarray studies were calculated. The genes with a
false discovery rate of ≤0.05 were selected as the significantly
DEGs. DEGs between tumor and adjacent tissues were subsequently
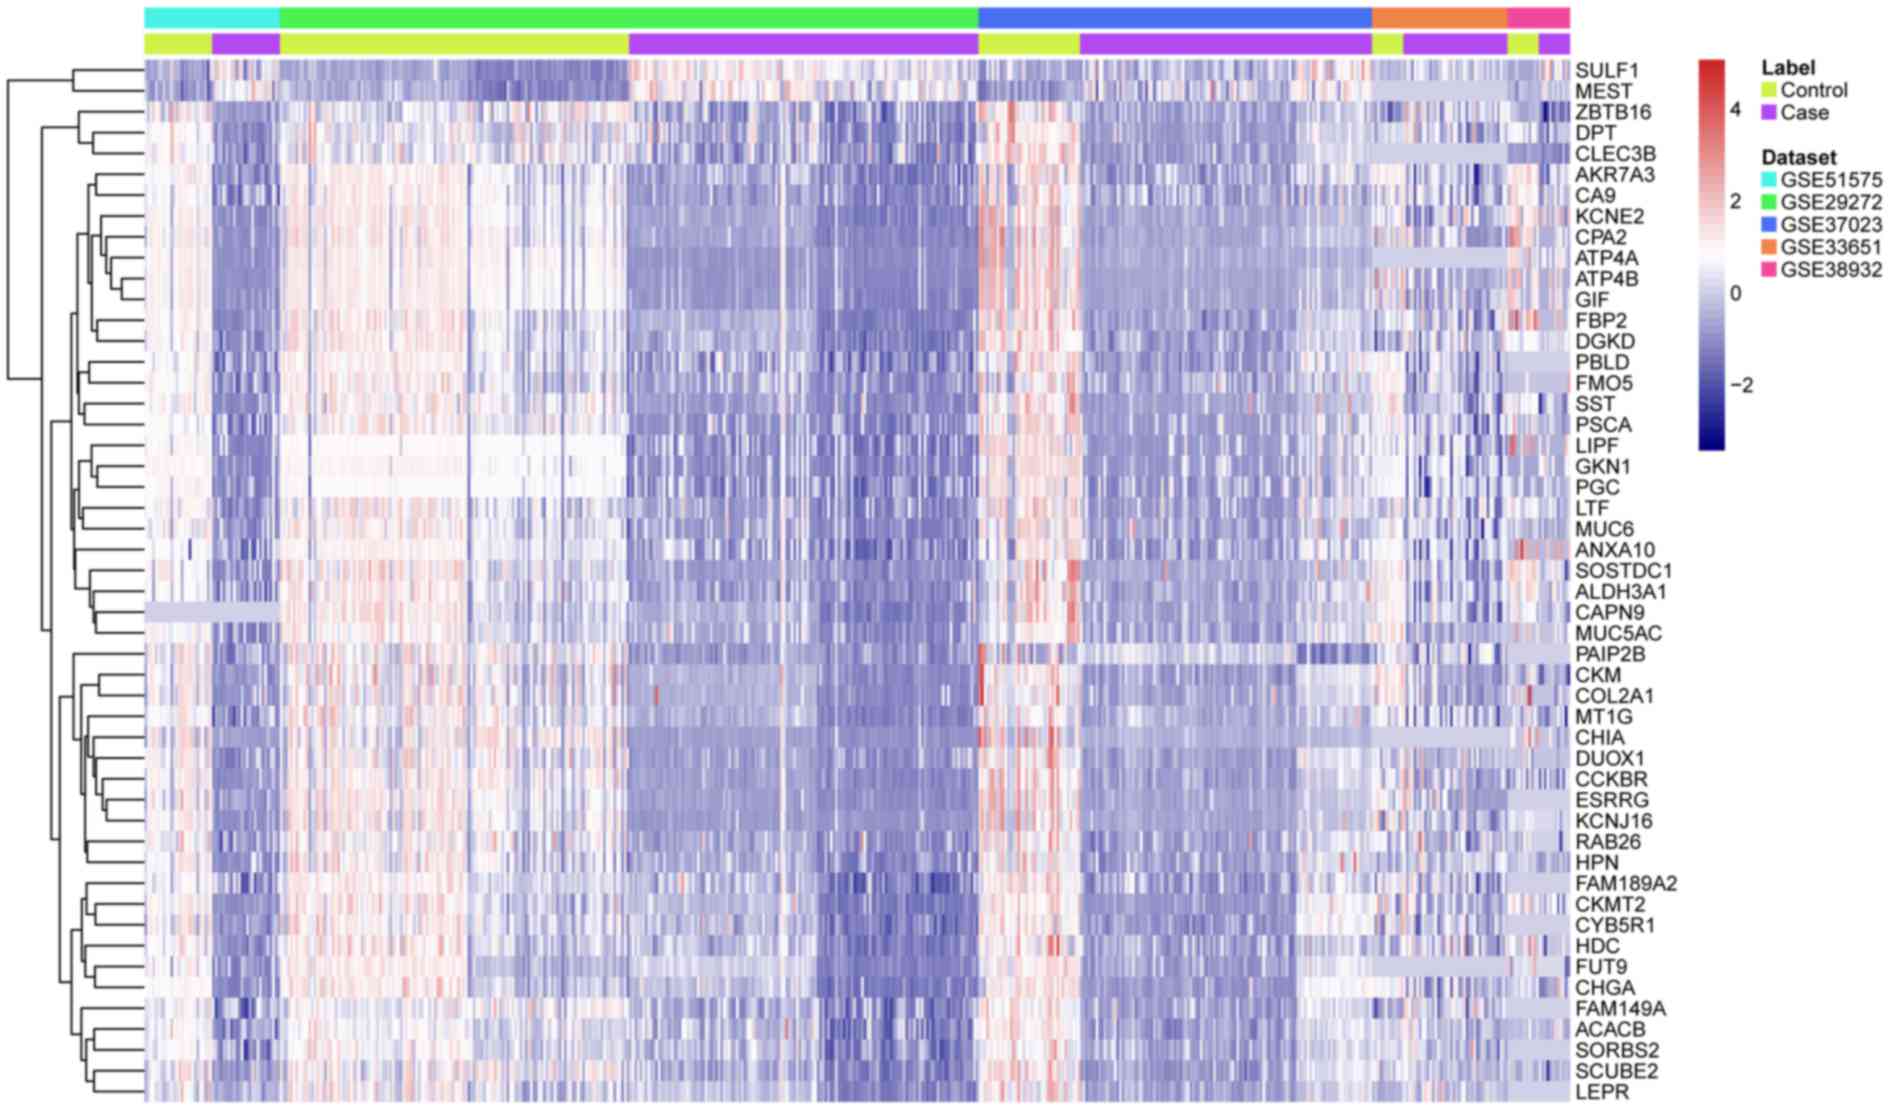
determined. Heat map analysis was conducted using the ‘heatmap.2’
function of the R/Bioconductor package ‘gplots’ (20).
Functional enrichment analysis of
DEGs
To determine the biological functions of DEGs, Gene
Ontology (GO) enrichment analysis of biological processes,
molecular functions and cellular components was performed. The
online software GeneCodis3 (http://genecodis.cnb.csic.es/analysis) was used to
perform this analysis (21). In
addition, pathway enrichment was also performed based on the Kyoto
Encyclopedia of Genes and Genomes (KEGG) database (http://www.genome.jp/kegg/).
PPI network construction
A PPI network of the significantly dysexpressed
genes was constructed according to data from the Biological General
Repository for Interaction Datasets (http://thebiogrid.org/). Among the candidate genes,
the distribution characteristics of the top 20 most significantly
upregulated and downregulated DEGs were visualized using Cytoscape
(22).
Collection of clinical specimens
A total of 10 patients, including 8 males and 2
females, were enrolled in the present study, among which 5 had been
diagnosed with GC. The average age of the patients was 54 years
(age range, 38–79 years). Frozen tissue sections were generated and
examined independently by senior pathologists. Parts of each tumor
tissues were frozen immediately following the operation and stored
at −135°C for RNA extraction. This study was approved by the Ethics
Committee of The First Affiliated Hospital of PLA General Hospital
(Beijing, China).
RNA preparation and RT-qPCR
Total RNA of each sample was extracted using the
RNAeasy Mini kit (Qiagen, Inc., Valencia, CA, USA), according to
the manufacturer's protocol. According to previous studies
(23–27), 10 DEGs were retrieved from the top 20
upregulated and downregulated genes. Primers for the 10 target
genes were designed using PrimerPlex 2.61 (Premier Biosoft
International, Palo Alto, CA, USA) and are shown in Table I. cDNA templates were synthesized from
1–5 µg RNA using Superscript Reverse Transcriptase II (Thermo
Fisher Scientific, Inc., Waltham, MA, USA). qPCR was performed on
the ABI 7500 Real-Time PCR System (Applied Biosystems; Thermo
Fisher Scientific, Inc.) with SYBR dye (Thermo Fisher Scientific,
Inc.). The final reaction mixture of 12.5 µl consisted of 6.25 µl
Power SYBR Green PCR Master Mix, 50 ng diluted cDNA and 1 µM of
each primer. Reactions were conducted in triplicate under the
following conditions: 50°C for 2 min, 95°C for 10 min, and 40
cycles of 95°C for 15 sec and 60°C for 1 min. Melting curves (60 to
95°C) were derived for every reaction to insure a single product.
Relative gene expression was evaluated using Data Assist Software,
version 3.0 (Thermo Fisher Scientific, Inc.), with the human actin
gene as a reference. The expression levels of each gene were
determined using the 2−ΔΔCq method (28).
 | Table I.Primer sequences for the target
genes. |
Table I.
Primer sequences for the target
genes.
| Gene | Sequence (5′ to
3′) | Product size
(bp) |
|---|
| SULF1 | F:
GTAAGAAGGAAGAATCCAGCAAGAA | 187 |
|
| R:
AGGTCACTGGGTCCTTTACACTT |
|
| SPP1 | F:
ATAAGCGGAAAGCCAATGATGAGAG | 134 |
|
| R:
TTTGGGGTCTACAACCAGCATATCT |
|
| THBS2 | F:
GAACATTGGCTGGAAGGACTACAC | 126 |
|
| R:
TCATAGATAGGTCCTGAGTCTGCCA |
|
| TOP2A | F:
ATCATTGAAAATAAGCCTAAGAAAG | 197 |
|
| R:
AGAAGATAGTTGAAGGTTGGTCC |
|
| HOXC6 | F:
GGACATAACACACAGACCTCAATCG | 129 |
|
| R:
GACCCCACTGTGCGAATTCAT |
|
| GIF | F:
ATGGCATCATTGGAGACATCTACAG | 94 |
|
| R:
TTCTTGCAGTTCCATTCCTTTTTAG |
|
| KCNE2 | F:
AGAGACGGGAACACTCCAATGACC | 64 |
|
| R:
ACTTTTCCTGCCAGTCCTCTACAATG |
|
| SST | F:
AACCCAACCAGACGGAGAATGAT | 109 |
|
| R:
GCCGGGTTTGAGTTAGCAGATCTC |
|
| GKN1 | F:
AGGAAGTCATGCCCTCCATTCAATC | 149 |
|
| R:
GTTTTTTCCGAACTTGCTCAGGTCA |
|
| LIPF | F:
GAACTTTAACACGAGTCGCTTGGAT | 189 |
|
| R:
ATGGCTGTCACATTGTAGTAGGGAG |
|
| Actin | F:
ACTTAGTTGCGTTACACCCTT | 156 |
|
| R:
GTCACCTTCACCGTTCCA |
|
Statistical analysis
Data are expressed as the mean ± standard deviation.
Comparisons of the expression levels of different genes were
conducted using Student's t-test with a significance level of 0.05.
Statistical analyses were conducted using SPSS version 16.0 (SPSS,
Inc., Chicago, IL, USA).
Results
DEGs in the integrated analysis of
microarray datasets
Following the electronic database search, six
microarray studies were obtained according to the inclusion
criteria. The characteristics of the individual studies that were
included in the integrated analysis are displayed in Table II. There were 53 GC patients and 259
NC patients. The integrated analysis identified a set of 689 DEGs
in the GC tissues, as compared with the normal tissues, including
202 upregulated and 487 downregulated DEGs. In addition, the
hierarchical clustering analysis indicated that the DEGs in GC were
distinguished from those in normal tissues (Fig. 1).
| Table II.Information of the six transcriptome
profiles. |
Table II.
Information of the six transcriptome
profiles.
| GEO ID |
Samples(cancer/normal) | Platform | Country | Year |
|---|
| GSE51575 | 26/26 | GPL13607
Agilent-028004 SurePrint G3 | Korea | 2014 |
|
|
| Human GE 8×60K
Microarray (Feature Number version) |
|
|
| GSE29272 | 134/134 | GPL96 [HG-U133A]
Affymetrix Human Genome U133A Array | USA | 2013 |
| GSE37023-GPL96 | 112/39 | GPL96 [HG-U133A]
Affymetrix Human Genome U133A Array | Singapore | 2012 |
| GSE37023-GPL97 | 29/36 | GPL97 [HG-U133B]
Affymetrix Human Genome U133B Array | Singapore | 2012 |
| GSE33651 | 40/12 | GPL2895 GE
Healthcare/Amersham Biosciences CodeLink | Korea | 2011 |
|
|
| Human Whole Genome
Bioarray |
|
|
| GSE38932 | 12/12 | GPL5936 HEEBO Human
oligo array | Argentina | 2012 |
Functional enrichment analysis
GO provides a common descriptive framework and
functional annotation and classification system for analyzing the
gene set data. The 689 DEGs were involved in 86 signaling pathways,
including the digestion and absorption of proteins, interactions
between extracellular matrix (ECM) receptors, the p53 signaling
pathway, the metabolism of propionate, the absorption of minerals,
etc. The results of the KEGG enrichment analysis revealed that the
first three most enriched pathways included protein digestion and
absorption, ECM-receptor interaction and the metabolism of
xenobiotics by cytochrome P450 (Tables
III and IV). The detailed
information on the 20 most significantly upregulated and
downregulated genes is shown in Table
V.
| Table III.Partial results of GO analysis. |
Table III.
Partial results of GO analysis.
| GO term | GO name | No. of genes | P-value |
|---|
| Biological
processes |
| 22 | 7.04E-20 |
|
GO:0007586 | Digestion | 30 | 1.87E-10 |
|
GO:0051301 | Cell division | 30 | 4.74E-10 |
|
GO:0042493 | Response to
drug | 41 | 5.44E-10 |
|
GO:0007155 | Cell adhesion | 20 | 1.68E-09 |
|
GO:0006805 | Xenobiotic
metabolic process | 29 | 2.79E-08 |
|
GO:0008285 | Negative regulation
of cell proliferation | 58 | 1.05E-07 |
|
GO:0007165 | Signal
transduction | 31 | 3.71E-07 |
|
GO:0007049 | Cell cycle | 24 | 1.22E-06 |
|
GO:0005975 | Carbohydrate
metabolic process | 12 | 1.31E-06 |
|
GO:0043434 | Response to peptide
hormone stimulus | 25 | 1.33E-06 |
|
GO:0008152 | Metabolic
process | 6 | 2.12E-06 |
|
GO:0006600 | Creatine metabolic
process | 24 | 2.35E-06 |
|
GO:0000278 | Mitotic cell
cycle | 10 | 2.41E-06 |
|
GO:0010033 | Response to organic
substance | 13 | 3.53E-06 |
| Molecular
functions |
|
|
|
|
GO:0005515 | Protein
binding | 192 | 4.51E-23 |
|
GO:0042803 | Protein
homodimerization activity | 42 | 6.63E-12 |
|
GO:0016491 | Oxidoreductase
activity | 38 | 1.15E-11 |
|
GO:0005509 | Calcium ion
binding | 47 | 1.67E-11 |
|
GO:0042802 | Identical protein
binding | 28 | 2.71E-09 |
|
GO:0005201 | Extracellular
matrix structural constituent | 14 | 7.05E-09 |
|
GO:0008201 | Heparin
binding | 18 | 7.53E-09 |
|
GO:0008009 | Chemokine
activity | 10 | 2.40E-06 |
|
GO:0003824 | Catalytic
activity | 26 | 3.55E-06 |
|
GO:0016787 | Hydrolase
activity | 46 | 5.63E-06 |
|
GO:0000166 | Nucleotide
binding | 79 | 6.03E-06 |
|
GO:0050840 | Extracellular
matrix binding | 6 | 4.04E-05 |
|
GO:0008233 | Peptidase
activity | 28 | 5.63E-05 |
|
GO:0019901 | Protein kinase
binding | 18 | 8.70E-05 |
|
GO:0005198 | Structural molecule
activity | 17 | 0.000169 |
| Cellular
components |
|
|
|
|
GO:0005576 | Extracellular
region | 163 | 1.54E-55 |
|
GO:0005615 | Extracellular
space | 93 | 6.61E-42 |
|
GO:0005737 | Cytoplasm | 242 | 3.60E-36 |
|
GO:0005886 | Plasma
membrane | 151 | 2.66E-17 |
|
GO:0005829 | Cytosol | 105 | 1.08E-15 |
|
GO:0031012 | Extracellular
matrix | 25 | 1.18E-14 |
|
GO:0048471 | Perinuclear region
of cytoplasm | 36 | 1.27E-11 |
|
GO:0005887 | Integral to plasma
membrane | 56 | 4.70E-10 |
|
GO:0016020 | Membrane | 141 | 1.29E-09 |
|
GO:0005634 | Nucleus | 173 | 4.31E-09 |
|
GO:0005581 | Collagen | 15 | 1.35E-08 |
|
GO:0005604 | Basement
membrane | 13 | 3.41E-08 |
|
GO:0005578 | Proteinaceous
extracellular matrix | 21 | 4.36E-08 |
|
GO:0005625 | Soluble
fraction | 29 | 4.45E-08 |
|
GO:0009986 | Cell surface | 24 | 2.10E-07 |
| Table IV.Partial results of the KEGG
analysis. |
Table IV.
Partial results of the KEGG
analysis.
| KEGG ID | KEGG term | No. of genes | P-value |
|---|
| hsa04974 | Protein digestion
and absorption | 19 | 1.77E-13 |
| hsa04512 | ECM-receptor
interaction | 16 | 9.65E-10 |
| hsa00980 | Metabolism of
xenobiotics by cytochrome P450 | 13 | 5.40E-08 |
| hsa05146 | Amoebiasis | 15 | 7.61E-08 |
| hsa04971 | Gastric acid
secretion | 13 | 8.50E-08 |
| hsa04510 | Focal adhesion | 20 | 1.11E-07 |
| hsa00071 | Fatty acid
metabolism | 10 | 1.70E-07 |
| hsa00982 | Drug
metabolism-cytochrome P450 | 12 | 3.32E-07 |
| hsa04110 | Cell cycle | 15 | 5.78E-07 |
| hsa00010 |
Glycolysis/gluconeogenesis | 11 | 7.37E-07 |
| hsa04978 | Mineral
absorption | 10 | 1.03E-06 |
| hsa04115 | p53 signaling
pathway | 11 | 1.42E-06 |
| hsa00640 | Propanoate
metabolism | 8 | 2.52E-06 |
| hsa00330 | Arginine and
proline metabolism | 9 | 1.60E-05 |
| hsa00591 | Linoleic acid
metabolism | 7 | 1.71E-05 |
| Table V.Top ten significantly upregulated and
downregulated DEGs. |
Table V.
Top ten significantly upregulated and
downregulated DEGs.
| DEG | Function | Fold-change | P-value |
|---|
| Upregulated |
|
|
|
|
SULF1 | Exhibits
arylsulfatase activity and highly specific
endoglucosamine-6-sulfatase activity; diminishes heparan sulfate
proteoglycan sulfation; inhibits signaling by heparin-dependent
growth factors; diminishes proliferation; and facilitates apoptosis
in response to exogenous stimulation | 1.9208 | 6.89E-54 |
|
MEST | N/A | 1.7879 | 2.94E-50 |
|
SPP1 | Probably important
to cell-matrix interaction; acts as a cytokine involved in
enhancing the production of interferon-γ and IL-12 and reducing the
production of IL-10; and is essential in the pathway that leads to
type I immunity | 2.5703 | 1.79E-47 |
|
THBS2 | Mediates
cell-to-cell and cell-to-matrix interactions. Ligand for cluster of
differentiation 36, mediating antiangiogenic properties | 2.0385 | 9.72E-44 |
|
TOP2A | Controls
topological states of DNA by transient breakage and subsequent
rejoining of DNA strands. | 1.9398 | 4.07E-42 |
|
HOXC6 | Provides cells with
specific positional identities on the anterior-posterior axis | 1.7265 | 3.34E-41 |
|
HOXC10 | Provides cells with
specific positional identities on the anterior-posterior axis | 1.8234 | 4.42E-38 |
|
ARPC1B | Involved in
regulating actin polymerization and, together with an activating
nucleation-promoting factor, mediates the formation of branched
actin networks | 1.4555 | 2.10E-35 |
|
KIF4A | Translocates PRC1
to the plus ends of interdigitating spindle microtubules during the
metaphase to anaphase transition; may play a role in mitotic
chromosomal positioning and bipolar spindle stabilization | 1.4195 | 2.38E-35 |
|
OLFML2B | N/A | 1.6155 | 7.38E-35 |
| Downregulated |
|
|
|
|
GIF | Promotes absorption
of the essential vitamin, cobalamin, in the ileum | −8.2157 | 8.04E-124 |
|
ESRRG | Acts as
transcription activator in the absence of bound ligand | −3.1508 | 6.98E-105 |
|
KCNE2 | Assembles as a
β-subunit with a voltage-gated potassium channel complex of
pore-forming α-subunits; modulates the gating kinetics and enhances
the stability of the channel complex; associated with KCNH2/HERG,
it is proposed to form the rapidly activating component of the
delayed rectifying potassium current in the heart; may associate
with KCNQ2 and/or KCNQ3 and modulate the native M-type current; may
associate with KCNQ1/KVLTQ1 and elicit a voltage-independent
current; may associate with HCN1 and HCN2 and increase potassium
current | −3.6014 | 1.29E-97 |
|
SST | Somatostatin
inhibits the release of somatotropin | −3.1116 | 3.67E-95 |
|
GKN1 | Has mitogenic
activity and may be involved in maintaining the integrity of the
gastric mucosal epithelium | −8.7597 | 2.11E-91 |
|
LIPF | N/A | −8.5977 | 1.14E-85 |
|
CHIA | May participate in
the defense against nematodes, fungi and other pathogens; plays a
role in T-helper cell type 2 immune response; contributes to the
response to IL-13 and inflammation in response to IL-13; stimulates
chemokine production by pulmonary epithelial cells; protects lung
epithelial cells against apoptosis and promotes phosphorylation of
AKT1 | −4.1886 | 1.27E-80 |
|
DUOX1 | Generates hydrogen
peroxide, which is required for the activity of thyroid peroxidase
and LPO; plays a role in thyroid hormones synthesis and
LPO-mediated antimicrobial defense at the surface of mucosa; may
have its own peroxidase activity through its N-terminal
peroxidase-like domain | −1.9009 | 1.20E-76 |
| AKR7A3 | Can reduce the
dialdehyde protein-binding form of AFB1 to the non-binding AFB1
dialcohol; may be involved in protecting the liver against the
toxic and carcinogenic effects of AFB1, a potent
hepatocarcinogen | −2.1215 | 1.34E-68 |
| FAM149A | N/A | −1.5039 | 1.04E-64 |
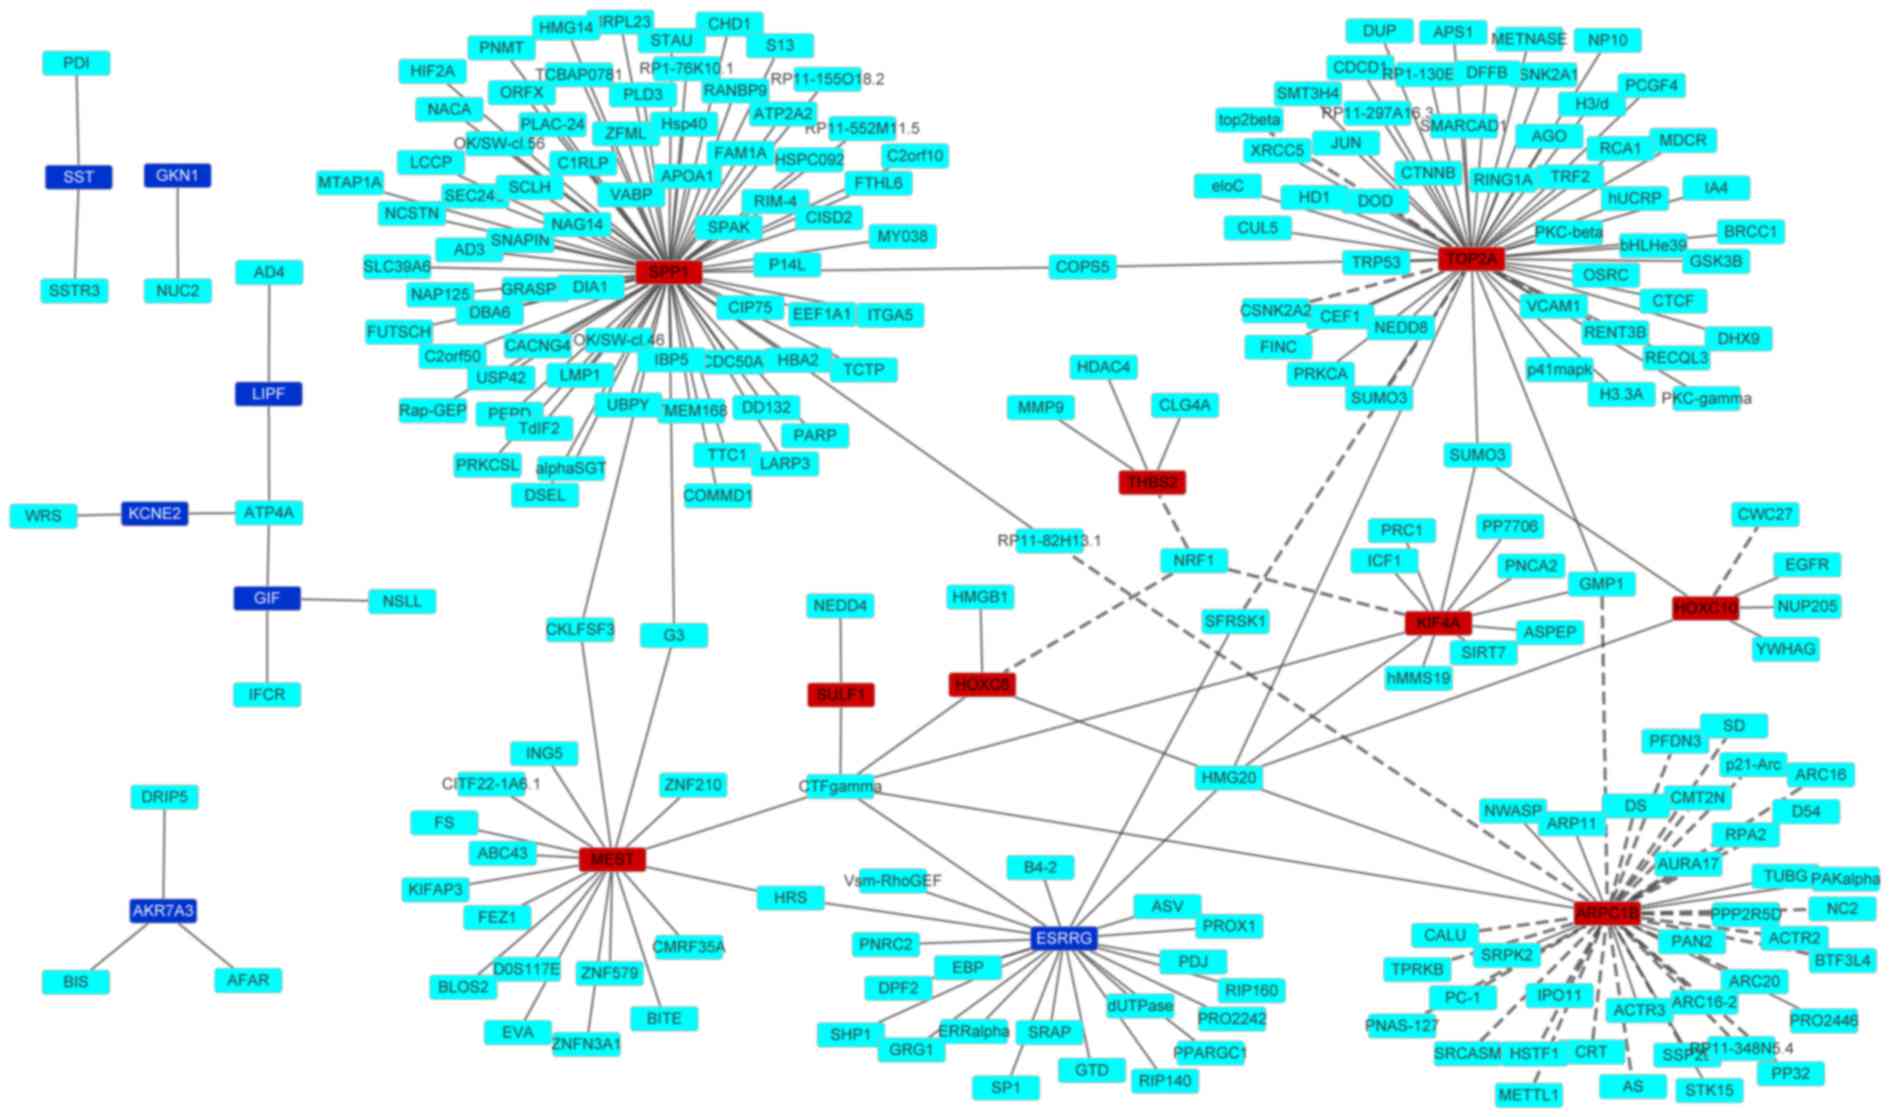
PPI network construction
A PPI network of the top 10 upregulated and
downregulated DEGs is shown in Fig.
2. The network consisted of 243 edges and 251 nodes. Generally,
nodes with a high degree, which measures how many neighbors a node
is directly connected to, are defined as hub proteins (29,30). Three
nodes, including SPP1, TOP2A and ARPC1B, showed the highest
degrees.
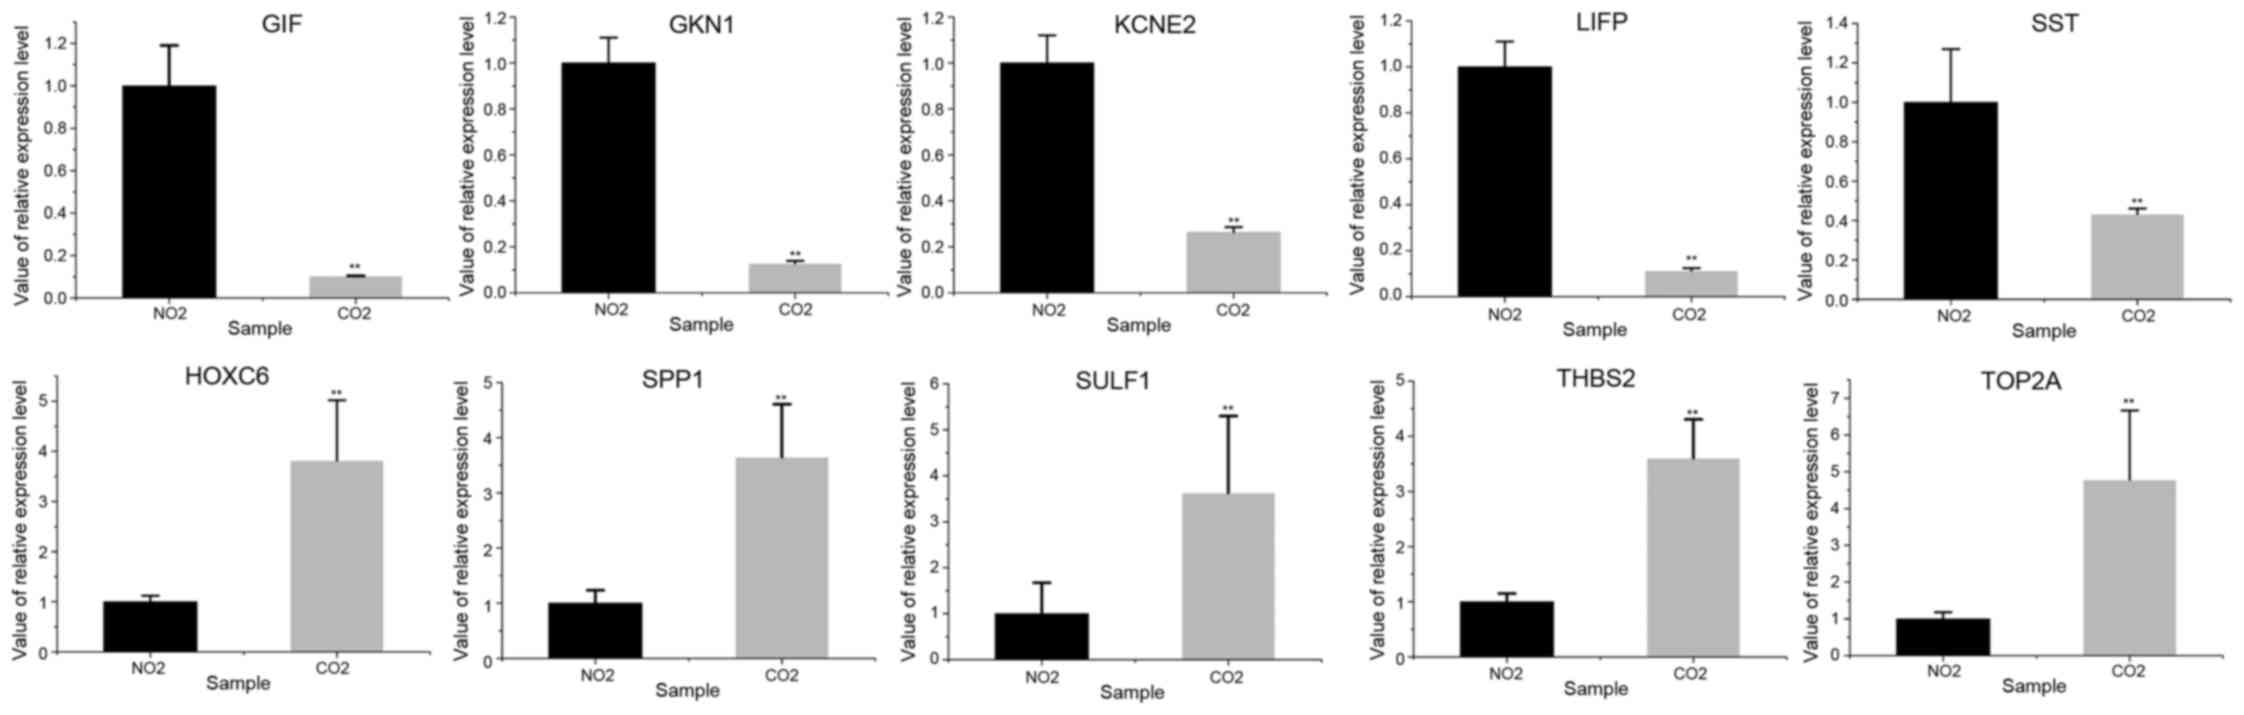
RT-qPCR validation
Five genes were randomly retrieved from the 10
upregulated and downregulated genes, respectively. It was shown
that the expression patterns of the selected genes in GC and normal
tissues in the RT-qPCR analysis were similar to those in the
integrated analysis (Fig. 3; Table V), and that the difference between the
GC patients and control samples were significantly different
(P<0.01). The expression of SULF1, SPP1, THBS2, TOP2A and HOXC6
was upregulated in GC tissues compared with normal tissues, while
the expression of GIF, KCNE2, SST, GKN1 and LIPF was downregulated
in GC tissues compared with normal tissues.
Discussion
Microarrays are powerful tools for revealing the
pathogenesis of human cancer and identify potential therapeutic
targets (12). Microarray-based
technology has been used in several studies to detect candidate
genes involved in the occurrence of GC (31–34). In
the present study, an integrated analysis of six transcriptome
datasets was conducted and 689 DEGs were identified based on 612
samples, including 202 upregulated genes and 487 downregulated
genes. The results of GO and KEGG analyses showed that the most
enriched pathways included protein digestion and absorption,
ECM-receptor interaction, and the metabolism of xenobiotics by
cytochrome P450. The results were consistent with previous research
(35,36), which identified DEGs with biological
functions that were mainly involved in cell adhesion and ECM
interactions.
Generally, it is accepted that, although the number
of dysfunctional genes in a cancer may be limited, a large number
of genes in related pathways may be affected at the expression
level, and this aberrant gene transcriptional expression network is
likely essential in the initiation and maintenance of the malignant
phenotype (37–39). Most of the 20 most significantly DEGs
have been reported to be involved in the oncogenesis and
development of GC (23–26), and the functional classification of
these genes was consistent with the results of GO and KEGG
analyses. Three genes, including SPP1, TOP2A and
ARPC1B, showed the highest connection in the PPI analysis
and may have key roles in GC. In addition, SUL1,
THBS2, HOXC6, SST, KCNE2, GIF,
GKN1 and LIPF were also linked with more than one
edge, indicating the potential role of these genes in the
pathogenesis of GC.
However, the expression levels of six genes
(MEST, GIF, CHIA, DUOX1, KIF4 and
AKR7A3) in clinical samples were either inconsistent or
ignored in previous studies (35,40). In
the current study, dysregulation of these DEGs suggests that they
serve roles in the oncogenesis and the development of GC. Among the
six genes, the associations between GC and MEST, GIF,
CHIA, and DUOX1 have never been reported. MEST
encodes a member of the α/β hydrolase fold family and has the
characteristic of isoform-specific imprinting. The aberrant
imprinting of this gene has been linked to certain types of cancer
and may be caused by promoter switching (41). GIF encodes intrinsic factor
(IF), also known as gastric IF, which is a glycoprotein secreted by
the parietal cells of the stomach that is necessary for the
absorption of vitamin B12 (cobalamin) in the small intestine
(35). CHIA may participate in
the defense against nematodes, fungi and other pathogens, and play
a role in the T-helper cell type 2 immune response; it is also
involved in the inflammatory response and in protecting cells
against apoptosis. Furthermore, CHIA is inhibited by allosamidin,
suggesting that the function of this protein is dependent on
carbohydrate binding (42–45). DUOX1 is the member of gp91phox
homologs family and produces reactive oxygen species in various
cells in response to stimuli, including growth factors, cytokines
and calcium. A key role for DUOX1 in lung cancer, but not in
GC, has been revealed (46). Although
further studies on these genes have not been conducted, the results
of the present study suggest that these genes may be considered as
novel indicators for GC in the clinic.
Except for the four genes that have not previously
been reported in GC, the expression levels of two genes in the
current study were different from those reported in previous
studies (40,47). Chromokinesin KIF4 is a member of the
KIF4 subfamily and has been reported as an essential factor
involved in multiple cellular process, including cell
proliferation, DNA damage responses, immune cell activation, viral
protein intracellular trafficking and neuronal survival in brain
development (48). The overexpression
of this subfamily was reported to inhibit GC cell proliferation
in vitro, as well as their ability to form tumors in
vivo (40). However, the
expression level of KIF4 was significantly upregulated in GC
samples in the current study. In addition, the expression of
AKR7A3, which was reported to be upregulated in Singaporean
GC patients (47), was downregulated
in the RT-qPCR validation in the present study. This discrepancy in
the results may be due to the heterogeneity of the GEO database,
although the results still suggest complicated functions of
KIF4 and AKR7A3 in the oncogenesis and development of
GC.
In conclusion, the current study demonstrated that
the analysis of expression profiles and RT-qPCR validation was able
to give an explicit elucidation of the dysexpression of genes in
GC. However, the results of the analysis of the expression profiles
varied from study to study. Based on our results, the expression
levels of six genes, including MEST, GIF,
CHIA, DUOX1, KIF4 and AKR7A3, were
found to be inconsistent with previous studies. These genes could
potentially be valuable in the clinical treatment of GC. The
present study may improve the understanding of the transcriptome
status of GC and lay a foundation for further investigation of the
mechanisms underlying this cancer of clinical and biological
significance.
References
|
1
|
Peek RM Jr and Blaser MJ: Helicobacter
pylori and gastrointestinal tract adenocarcinomas. Nat Rev Cancer.
2:28–37. 2002. View
Article : Google Scholar : PubMed/NCBI
|
|
2
|
Ferlay J, Shin HR, Bray F, Forman D,
Mathers C and Parkin DM: Estimates of worldwide burden of cancer in
2008: GLOBOCAN 2008. Int J Cancer. 127:2893–2917. 2010. View Article : Google Scholar : PubMed/NCBI
|
|
3
|
Wadhwa R, Song S, Lee JS, Yao Y, Wei Q and
Ajani JA: Gastric cancer-molecular and clinical dimensions. Nat Rev
Clin Oncol. 10:643–655. 2013. View Article : Google Scholar : PubMed/NCBI
|
|
4
|
Akhavan-Niaki H and Samadani AA: Molecular
insight in gastric cancer induction: An overview of cancer stemness
genes. Cell Biochem Biophys. 68:463–473. 2014. View Article : Google Scholar : PubMed/NCBI
|
|
5
|
Correa P, Camargo MC, Piazuelo MB, et al:
The biology of gastric cancers. Springer Ebooks; 2008
|
|
6
|
Figueiredo C, Garcia-Gonzalez MA and
Machado JC: Molecular pathogenesis of gastric cancer. Helicobacter.
18:(Suppl 1). S28–S33. 2013. View Article : Google Scholar
|
|
7
|
Conteduca V, Sansonno D, Lauletta G, Russi
S, Ingravallo G and Dammacco F: H. pylori infection and gastric
cancer: State of the art (review). Int J Oncol. 42:5–18.
2013.PubMed/NCBI
|
|
8
|
Yamashita K, Sakuramoto S, Nemoto M,
Shibata T, Mieno H, Katada N, Kikuchi S and Watanabe M: Trend in
gastric cancer: 35 years of surgical experience in Japan. World J
Gastroenterol. 17:3390–3397. 2011. View Article : Google Scholar : PubMed/NCBI
|
|
9
|
Wang Z, Xu J, Shi Z, Shen X, Luo T, Bi J
and Nie M: Clinicopathologic characteristics and prognostic of
gastric cancer in young patients. Scand J Gastroenterol.
51:1043–1049. 2016. View Article : Google Scholar : PubMed/NCBI
|
|
10
|
Lee S, Baek M, Yang H, Bang YJ, Kim WH, Ha
JH, Kim DK and Jeoung DI: Identification of genes differentially
expressed between gastric cancers and normal gastric mucosa with
cDNA microarrays. Cancer Lett. 184:197–206. 2002. View Article : Google Scholar : PubMed/NCBI
|
|
11
|
Meyerson M, Gabriel S and Getz G: Advances
in understanding cancer genomes through second-generation
sequencing. Nat Rev Genet. 11:685–696. 2010. View Article : Google Scholar : PubMed/NCBI
|
|
12
|
Mardis ER: A decade's perspective on DNA
sequencing technology. Nature. 470:198–203. 2011. View Article : Google Scholar : PubMed/NCBI
|
|
13
|
Volinia S, Calin GA, Liu CG, Ambs S,
Cimmino A, Petrocca F, Visone R, Iorio M, Roldo C, Ferracin M, et
al: A microRNA expression signature of human solid tumors defines
cancer gene targets. Proc Natl Acad Sci USA. 103:2257–2261. 2006.
View Article : Google Scholar : PubMed/NCBI
|
|
14
|
Ueda T, Volinia S, Okumura H, Shimizu M,
Taccioli C, Rossi S, Alder H, Liu CG, Oue N, Yasui W, et al:
Relation between microRNA expression and progression and prognosis
of gastric cancer: A microRNA expression analysis. Lancet Oncol.
11:136–146. 2010. View Article : Google Scholar : PubMed/NCBI
|
|
15
|
Wang Z, Gerstein M and Snyder M: RNA-Seq:
A revolutionary tool for transcriptomics. Nat Rev Genet. 10:57–63.
2009. View
Article : Google Scholar : PubMed/NCBI
|
|
16
|
Kahvejian A, Quackenbush J and Thompson
JF: What would you do if you could sequence everything? Nat
Biotechnol. 26:1125–1133. 2008. View
Article : Google Scholar : PubMed/NCBI
|
|
17
|
Zhang SN, Sun HH, Jin YM, Piao LZ, Jin DH,
Lin ZH and Shen XH: Identification of differentially expressed
genes in gastric cancer by high density cDNA microarray. Cancer
Genet. 205:147–155. 2012. View Article : Google Scholar : PubMed/NCBI
|
|
18
|
Hippo Y, Taniguchi H, Tsutsumi S, Machida
N, Chong JM, Fukayama M, Kodama T and Aburatani H: Global gene
expression analysis of gastric cancer by oligonucleotide
microarrays. Cancer Res. 62:233–240. 2002.PubMed/NCBI
|
|
19
|
Cheadle C, Vawter MP, Freed WJ and Becker
KG: Analysis of microarray data using Z score transformation. J Mol
Diagn. 5:73–81. 2003. View Article : Google Scholar : PubMed/NCBI
|
|
20
|
Trapnell C, Pachter L and Salzberg SL:
TopHat: Discovering splice junctions with RNA-Seq. Bioinformatics.
25:1105–1111. 2009. View Article : Google Scholar : PubMed/NCBI
|
|
21
|
Tabas-Madrid D, Nogales-Cadenas R and
Pascual-Montano A: GeneCodis3: A non-redundant and modular
enrichment analysis tool for functional genomics. Nucleic Acids
Res. 40:W478–W483. 2012. View Article : Google Scholar : PubMed/NCBI
|
|
22
|
Shannon P, Markiel A, Ozier O, Baliga NS,
Wang JT, Ramage D, Amin N, Schwikowski B and Ideker T: Cytoscape: A
software environment for integrated models of biomolecular
interaction networks. Genome Res. 13:2498–2504. 2003. View Article : Google Scholar : PubMed/NCBI
|
|
23
|
Bornstein P, Kyriakides TR, Yang Z,
Armstrong LC and Birk DE: Thrombospondin 2 modulates collagen
fibrillogenesis and angiogenesis. J Investig Dermatol Symp Proc.
5:61–66. 2000. View Article : Google Scholar : PubMed/NCBI
|
|
24
|
O'Rourke KM, Laherty CD and Dixit VM:
Thrombospondin 1 and thrombospondin 2 are expressed as both homo-
and heterotrimers. J Biol Chem. 267:24921–24924. 1992.PubMed/NCBI
|
|
25
|
Tsai SC, Valkov N, Yang WM, Gump J,
Sullivan D and Seto E: Histone deacetylase interacts directly with
DNA topoisomerase II. Nat Genet. 26:349–353. 2000. View Article : Google Scholar : PubMed/NCBI
|
|
26
|
Acampora D, D'Esposito M, Faiella A,
Pannese M, Migliaccio E, Morelli F, Stornaiuolo A, Nigro V, Simeone
A and Boncinelli E: The human HOX gene family. Nucleic Acids Res.
17:10385–10402. 1990. View Article : Google Scholar
|
|
27
|
Hewitt JE, Gordon MM, Taggart RT, Mohandas
TK and Alpers DH: Human gastric intrinsic factor: Characterization
of cDNA and genomic clones and localization to human chromosome 11.
Genomics. 10:432–440. 1991. View Article : Google Scholar : PubMed/NCBI
|
|
28
|
Livak KJ and Schmittgen TD: Analysis of
relative gene expression data using real-time quantitative PCR and
the 2(−Delta Delta C(T)). Methods. 25:402–408. 2001. View Article : Google Scholar : PubMed/NCBI
|
|
29
|
Fox A, Taylor D and Slonim DK: High
throughput interaction data reveals degree conservation of hub
proteins. Pac Symp Biocomput. 391–402. 2009.PubMed/NCBI
|
|
30
|
Lavi O, Skinner J and Gottesman MM:
Network features suggest new hepatocellular carcinoma treatment
strategies. BMC Syst Biol. 8:882014. View Article : Google Scholar : PubMed/NCBI
|
|
31
|
Tay ST, Leong SH, Yu K, Aggarwal A, Tan
SY, Lee CH, Wong K, Visvanathan J, Lim D, Wong WK, et al: A
combined comparative genomic hybridization and expression
microarray analysis of gastric cancer reveals novel molecular
subtypes. Cancer Res. 63:3309–3316. 2003.PubMed/NCBI
|
|
32
|
Wu CM, Lee YS, Wang TH, Lee LY, Kong WH,
Chen ES, Wei ML, Liang Y and Hwang TL: Identification of
differential gene expression between intestinal and diffuse gastric
cancer using cDNA microarray. Oncol Rep. 15:57–64. 2006.PubMed/NCBI
|
|
33
|
Dang Y, Wang YC and Huang QJ: Microarray
and next-generation sequencing to analyse gastric cancer. Asian Pac
J Cancer Prev. 15:8033–8039. 2014. View Article : Google Scholar : PubMed/NCBI
|
|
34
|
Song B, Du J, Deng N, Ren JC and Shu ZB:
Comparative analysis of gene expression profiles of gastric cardia
adenocarcinoma and gastric non-cardia adenocarcinoma. Oncol Lett.
12:3866–3874. 2016.PubMed/NCBI
|
|
35
|
Cui J, Chen Y, Chou WC, Sun L, Chen L, Suo
J, Ni Z, Zhang M, Kong X, Hoffman LL, et al: An integrated
transcriptomic and computational analysis for biomarker
identification in gastric cancer. Nucleic Acids Res. 39:1197–1207.
2011. View Article : Google Scholar : PubMed/NCBI
|
|
36
|
Bertucci F, Salas S, Eysteries S, Nasser
V, Finetti P, Ginestier C, Charafe-Jauffret E, Loriod B, Bachelart
L, Montfort J, et al: Gene expression profiling of colon cancer by
DNA microarrays and correlation with histoclinical parameters.
Oncogene. 23:1377–1391. 2004. View Article : Google Scholar : PubMed/NCBI
|
|
37
|
Koslowski M, Sahin U, Mitnacht-Kraus R,
Seitz G, Huber C and Türeci O: A placenta-specific gene ectopically
activated in many human cancers is essentially involved in
malignant cell processes. Cancer Res. 67:9528–9534. 2007.
View Article : Google Scholar : PubMed/NCBI
|
|
38
|
Bonome T, Lee JY, Park DC, Radonovich M,
Pise-Masison C, Brady J, Gardner GJ, Hao K, Wong WH, Barrett JC, et
al: Expression profiling of serous low malignant potential,
low-grade and high-grade tumors of the ovary. Cancer Res.
65:10602–10612. 2005. View Article : Google Scholar : PubMed/NCBI
|
|
39
|
Avdulov S, Li S, Michalek V, Burrichter D,
Peterson M, Perlman DM, Manivel JC, Sonenberg N, Yee D, Bitterman
PB and Polunovsky VA: Activation of translation complex eIF4F is
essential for the genesis and maintenance of the malignant
phenotype in human mammary epithelial cells. Cancer Cell.
5:553–563. 2004. View Article : Google Scholar : PubMed/NCBI
|
|
40
|
Gao J, Sai N, Wang C, Sheng X, Shao Q,
Zhou C, Shi Y, Sun S, Qu X and Zhu C: Overexpression of
chromokinesin KIF4 inhibits proliferation of human gastric
carcinoma cells both in vitro and in vivo. Tumor Biol. 32:53–61.
2011. View Article : Google Scholar
|
|
41
|
Nishita Y, Yoshida I, Sado T and Takagi N:
Genomic imprinting and chromosomal localization of the human MEST
gene. Genomics. 36:539–542. 1996. View Article : Google Scholar : PubMed/NCBI
|
|
42
|
Lunardi D, Abelli L, Panti C, Marsili L,
Fossi MC and Mancia A: Transcriptomic analysis of bottlenose
dolphin (Tursiops truncatus) skin biopsies to assess the effects of
emerging contaminants. Mar Environ Res. 114:74–79. 2016. View Article : Google Scholar : PubMed/NCBI
|
|
43
|
Hartl D, He CH, Koller B, Da Silva CA,
Homer R, Lee CG and Elias JA: Acidic mammalian chitinase is
secreted via an ADAM17/epidermal growth factor receptor-dependent
pathway and stimulates chemokine production by pulmonary epithelial
cells. J Biol Chem. 283:33472–33482. 2008. View Article : Google Scholar : PubMed/NCBI
|
|
44
|
Żurawska-Płaksej E, Ługowska A, Hetmańczyk
K, Knapik-Kordecka M and Piwowar A: Neutrophils as a source of
chitinases and chitinase-like proteins in type 2 diabetes. PLoS
One. 10:e01417302015. View Article : Google Scholar : PubMed/NCBI
|
|
45
|
Gooday GW, Brydon LJ and Chappell LH:
Chitinase in female onchocerca gibsoni and its inhibition by
allosamidin. Mol Biochem Parasitol. 29:223–225. 1988. View Article : Google Scholar : PubMed/NCBI
|
|
46
|
Kamata T: Roles of Nox1 and other Nox
isoforms in cancer development. Cancer Sci. 100:1382–1388. 2009.
View Article : Google Scholar : PubMed/NCBI
|
|
47
|
Nair NG, Blessantoli M and Vennila JJ:
Gene expression in gastric cancer for Singapore and UK population:
An Insilico comparative approach. Res J Recent Sci. 3:2014.
|
|
48
|
Taniwaki M, Takano A, Ishikawa N, Yasui W,
Inai K, Nishimura H, Tsuchiya E, Kohno N, Nakamura Y and Daigo Y:
Activation of KIF4A as a prognostic biomarker and therapeutic
target for lung cancer. Clin Cancer Res. 13:6624–6631. 2007.
View Article : Google Scholar : PubMed/NCBI
|