Introduction
Circulating tumor cells (CTCs) are shed from primary
and metastatic tumors, and maintain similar characteristics to
tumor tissue (1). CTCs are present at
a relatively low concentration of 1–10 cells/10 ml of patients'
blood (2). The majority of CTCs are
defined as cytokeratin (CK) 8, 18 and 19 positive and cluster of
differentiation (CD) 45 negative nucleated cells (3).
The genomic characteristics of cells differ between
metastatic and primary tumors, and metastases located at different
sites within the same patient are heterogeneous (4). Therefore, primary tumor biopsies may not
be representative of metastatic tumor genomes. Liquid biopsies,
whereby CTCs and cell-free circulating tumor DNA (ctDNA) are
genetically screened for mutations, has been suggested as a novel
method to identify therapeutic targets for the treatment of drug
resistant tumors. Liquid biopsy has the advantage of being
non-invasive and allows for reproducible access to tumor cells,
whilst providing real-time monitoring of tumor evolution throughout
treatment. ctDNA originates from the necrotic or apoptotic cancer
cells of patients, particularly patients who have undergone
chemotherapy. CTCs are resistant to chemotherapy; consequently, the
liquid biopsy of CTCs has been highlighted as an alternative tool
to tumor tissue biopsy (5).
The rarity of CTCs has been a challenge to CTC
research and several different CTC isolation technologies have been
developed to overcome this issue. CTC isolation technologies can be
distinguished into the following two categories: One based on
physical properties, including size, deformability, density and
electric charge; and the other on biological properties, such as
cell surface marker proteins (6).
CELLSEARCH® (Janssen Diagnostics, LCC, South Raritan,
NJ, USA) is the most well recognized CTC isolation technique and
captures CTCs using an immunomagnetic separation method with an
antibody directed against epithelial cell adhesion molecule (EpCAM)
(7). The limitation of this method is
the poor vailability of viable and intact cell specimens for use in
downstream analysis. In addition, the ferrofluid used in CELLSEARCH
technology causes dose-dependent cytotoxicity (8), and magnetic beads adversely affect cell
proliferation and metabolism (9).
Furthermore, EpCAM-positive selection is not suitable for the
enrichment of CTCs with low EpCAM expression (10,11).
Breast cancer is the most common type of malignancy
in women. The Surveillance, Epidemiology and End Results Program of
the National Cancer Institute (Bethesda, MD, USA) reports a breast
cancer incidence rate of 123.8/10,000 population/year (12). Targeted therapy, which inhibits
specific signaling pathways, is effective in the treatment of
breast cancer. Herceptin® and Tykerb®, which
target the human epidermal growth factor receptor 2 (HER2) gene,
are used in the treatment of breast cancer (13,14). The
genomic analysis of tumor cells is essential to make decisions
regarding the selection of therapeutic targets for cancer
treatment. In a recent study, tumor protein p53 (TP53) mutation was
detected through the genetic analysis of CTCs from metastatic
tumors in a patient with triple-negative breast cancer (15). In another recent study, CTCs were
analyzed at single cell level, which identified the heterogeneity
of phosphatidylinositol-4 5-bisphosphate 3-kinase catalytic subunit
alpha (PIK3CA) mutations (16).
In the present study, a novel CTC isolation
technique according to cell size, using a high-density microporous
(HDM) chip (Cytogen GmbH Co., Wetzlar, Germany) and a white blood
cell (WBC)-negative selection method was evaluated. In addition, a
cancer gene panel analysis of the CTCs that were isolated using
this technique was performed.
Materials and methods
Patient background
A total of 11 female patients with breast cancer
from the Asan Medical Center affiliated to the University of Uslan
College of Medicine (Seoul, Korea) were included in the present
study. The median age of the patients was 44 years old (range,
34–56 years old). Cancer stage, and histologic and nuclear grade
were evaluated based on the tumor-node-metastasis classification
(17) of the American Joint Committee
on Cancer (Table I). All medical data
used in the present study were anonymized and obtained following
approval of the present study by the Institutional Review Board of
Asan Medical Center (Seoul, Korea) (clearance no. 2013-1048).
 | Table I.Clinicopathological characteristics of
11 female patients with breast cancer. |
Table I.
Clinicopathological characteristics of
11 female patients with breast cancer.
| Clinicopathological
characteristic | Number of patients
(%) |
|---|
| TNM stage |
|
| IA | 1 (9.1) |
| IIB | 5 (45.5) |
| IIIA | 3 (27.3) |
| IIIB | 0 (0) |
| IIIC | 2 (18.2) |
| Histological
grade |
|
| 2 | 10 (90.9) |
| 3 | 1 (9.1) |
| Nuclear grade |
|
| 2 | 10 (90.9) |
| 3 | 1 (9.1) |
Blood collection and CTC enrichment
process
Blood (10 ml) from each patient was collected for a
month (December 2014) in Acid Citrate Dextrose tubes (BD
Vacutainer®; BD Biosciences, San Jose, CA, USA) and
processed within 4 h. Each blood sample was divided in half, with
the CTCs from one half undergoing immunofluorescent staining and
the CTCs from the other undergoing cancer gene panel analysis. CTC
isolation was performed using a SMART BIOPSY™ SYSTEM Isolation kit
(cat no. CIKW10; Cytogen, Inc., Seoul, Korea). Blood samples were
incubated with an antibody cocktail from the SMART BIOPSY SYSTEM
Isolation kit (Cytogen, Inc.) against WBCs and red blood cells for
20 min, and mixed with pre-activation buffer followed by density
gradient centrifugation at 400 × g for 30 min at room temperature.
The cell suspension containing CTCs was collected and gradually
diluted with dilution buffer (Cytogen, Inc.). Diluted cell
suspensions were filtered through a HDM chip (Cytogen, Inc.) as
previously described (18). Cells on
the HDM chip were collected and transferred to a microtube. An EVE™
Automated Cell counter (Nano EnTek, Inc., Seoul, Korea) was used to
measure cell size prior to and following HDM chip filtration. For
immunofluorescent staining, isolated cells were fixed on slides in
4% paraformaldehyde for 5 min at room temperature. For cancer gene
panel analysis, isolated cells were pelleted and kept at −80°C
until required.
Immunofluorescence staining
Cells on slides were permeabilized with 0.2% Triton
X-100 in PBS for 10 min and quenched with 0.3% hydrogen peroxide
for 30 min at room temperature. Cells were then blocked with 1%
bovine serum albumin in PBS for 30 min and incubated with primary
antibodies for 90 min at 37°C, followed by secondary antibody
incubation at same condition. The primary antibodies used were
mouse anti-EpCAM (dilution, 1:200; catalog no. #2929; CST
Biological Reagents Company Ltd., Shanghai, China) and rabbit
anti-CD45 (dilution, 1:50; catalog no. SC53047; Santa Cruz
Biotechnology, Inc., Dallas, TX, USA). EpCAM signaling was
amplified using the TSA™ kit (catalog no. T20922; Thermo Fisher
Scientific, Inc., Waltham, MA, USA), according to the
manufacturer's protocol. The secondary antibody used against CD45
was goat anti-rabbit Alexa Fluor® 594 (dilution, 1:100;
catalog no. A11012; Invitrogen; Thermo Fisher Scientific, Inc.).
The slides were mounted using Fluoroshield™ Mounting Medium with
DAPI (ImmunoBioScience Corp., Mukilteo, WA, USA). Stained cells
were observed and images captured using a fluorescent microscope
(Eclipse Ti; Nikon Corporation, Tokyo, Japan) with a 400X
objective. To identify EpCAM-positive and CD45-negative CTCs, the
PC9 (EpCAM-positive) and KG-1 (CD45-positive) cell lines were used
as positive controls.
Spike-in test with H358-green
fluorescent protein cells for confirmation of CTC capture
efficiency
A total of 100 H358-green fluorescent protein (GFP)
cells were spiked into 1 ml of healthy volunteers' blood, which
underwent the same CTC isolation protocol described above. The
isolated cell suspension was transferred to a new dish and the
number of GFP-positive cells were counted under a fluorescent
microscope (Eclipse Ti; Nikon Corporation) within 30 min.
Experiments were performed in triplicate. The CTC detection rate
was determined as follows: CTC detection rate (%)=(No. of CTCs
detected in patients/total patient no.)x100. CTC purity was
calculated as follows: CTC purity (%)=(Detection of CTC no./total
cell no.)x100.
MCF7 cell line culture as a positive
control
MCF-7 cells were obtained from Asan Medical Center
affiliated to the University of Uslan College of Medicine (Seoul,
Korea), and were routinely maintained in RPMI-1640 medium
(Gibco®; Thermo Fisher Scientific, Inc.) supplemented
with 10% fetal calf serum and 1% antibiotics at 37°C in humidified,
concentrated CO2 (5%) atmosphere.
Whole genome amplification (WGA)
CTC cell pellets from patients were amplified using
the REPLI-g Single Cell kit (Qiagen Inc., Valencia, CA, USA)
according to the manufacturer's protocol. Briefly, cell pellets
were mixed with denaturing buffer and incubated at 65°C for 10 min.
Following the addition of stop solution, denatured DNA samples were
mixed with REPLI-g sc DNA polymerase and reaction buffer, and
incubated at 30°C for 8 h, followed by further incubation at 65°C
for 3 min.
Cancer gene panel analysis
Genomic mutations were analyzed using the Ion
AmpliSeq™ Cancer Hotspot Panel v2 (Thermo Fisher Scientific, Inc.),
a next-generation sequencing assay that identifies multiple somatic
mutations [2,800 Catalogue of Somatic Mutations in Cancer (COSMIC)
mutations across 50 genes]. Genomic DNA was amplified using the
aforementioned WGA protocol and the amplicons were purified using
the Agencourt AM-Pure XP kit (Beckman Coulter, Inc., Brea, CA,
USA), followed by end repair and ligation using Ion Xpress™ Barcode
Adapters kit (catalog no., 4471250; Thermo Fisher Scientific,
Inc.). The median fragment size and concentration of the final
amplicon library were detected using a BioAnalyzer 2100 with
Agilent High Sensitivity DNA kit (Agilent Technologies, Inc., Santa
Clara, CA, USA).
The amplicon library was diluted to 10 pM with TE
buffer and 5 µl of the library was used for automatic PCR; the Ion
OneTouch™ system (catalog no. 4474779; Invitrogen; Thermo Fisher
Scientific, Inc.) performed emulsion PCR reactions using Ion PGM™
Template OT2 200 kit following the manufacturer's protocol. The
following cycling conditions were used: 80°C for 3 min; 18 cycles
of (99°C for 20 sec, 58°C for 30 sec, 72°C for 1 min, 99°C for 20
sec, 56°C for 30 sec and 70°C for 1 min); and 10 cycles of (99°C
for 20 sec, and 58°C for elongated durations from 3–20 min) with
heat cover at 85°C. Subsequently, the emulsion PCR product was
enriched using Dynabeads® MyOne™ Streptavidin C1 beads
(Invitrogen; Thermo Fisher Scientific, Inc.). The final enriched
ion spheres were mixed with a sequencing primer and polymerase, and
loaded onto five 316 chips (Ion PGM™ Sequencing 200 kit v2) in
total. Base calling was generated using Torrent Suite software
(version 3.0; Thermo Fisher Scientific, Inc.) with tmap-f3
indexing. BAM and FASTQ alignment files were generated based on the
base calling results and were used for variant calling, including
single nucleotide polymorphisms and insertions/deletions.
Statistical analysis
The software used for statistical analysis was IBM
SPSS version 24 (IBM Corp., Armonk, NY, USA) and Student's t-test
was performed. P<0.05 was considered to indicate a statistically
significant difference.
Results
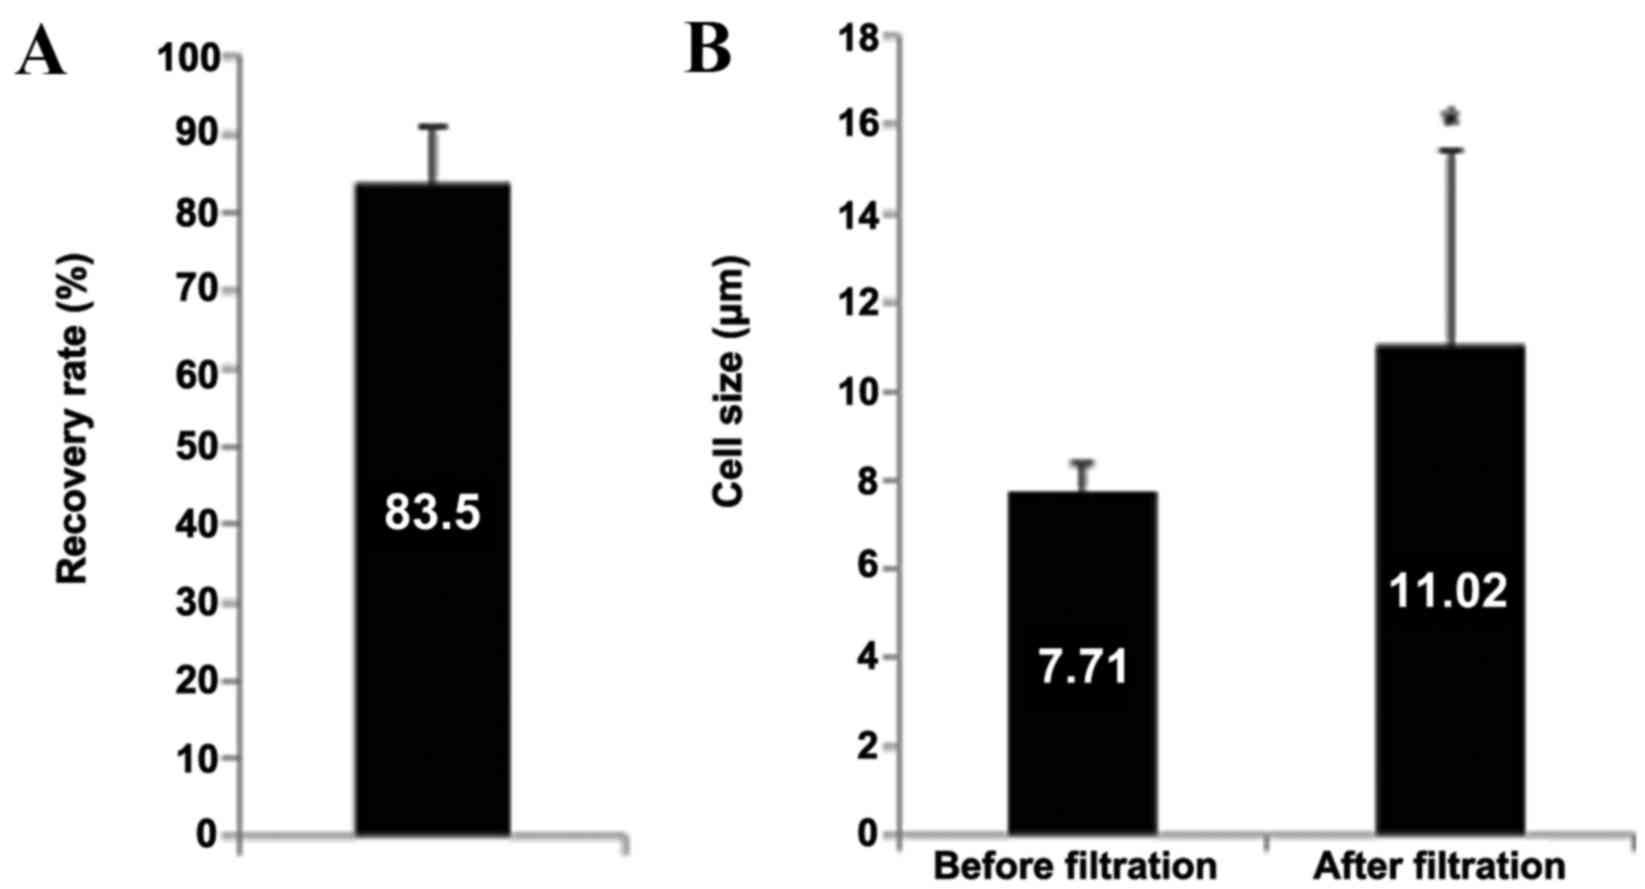
HDM cell recovery rate and CTC
size
To evaluate the cell recovery rate of the HDM chip
used, a spike-in test using H358-GFP cells was performed. This
identified a cell recovery rate of 83.5%. (Fig. 1A). Furthermore, the average CTC size
in the patients' blood prior to and following HDM chip filtration
was compared. The average CTC size prior to filtration was
7.84±0.87 µm, which increased to 13.99±3.67 µm following filtration
(Fig. 1B). This is in agreement with
a previous study that reported that the average size of CTCs from
patients with breast cancer was 13.1 µm (19), in addition to confirming that a HDM
chip with a 6.5 µm pore size effectively enriched for CTCs in the
present study.
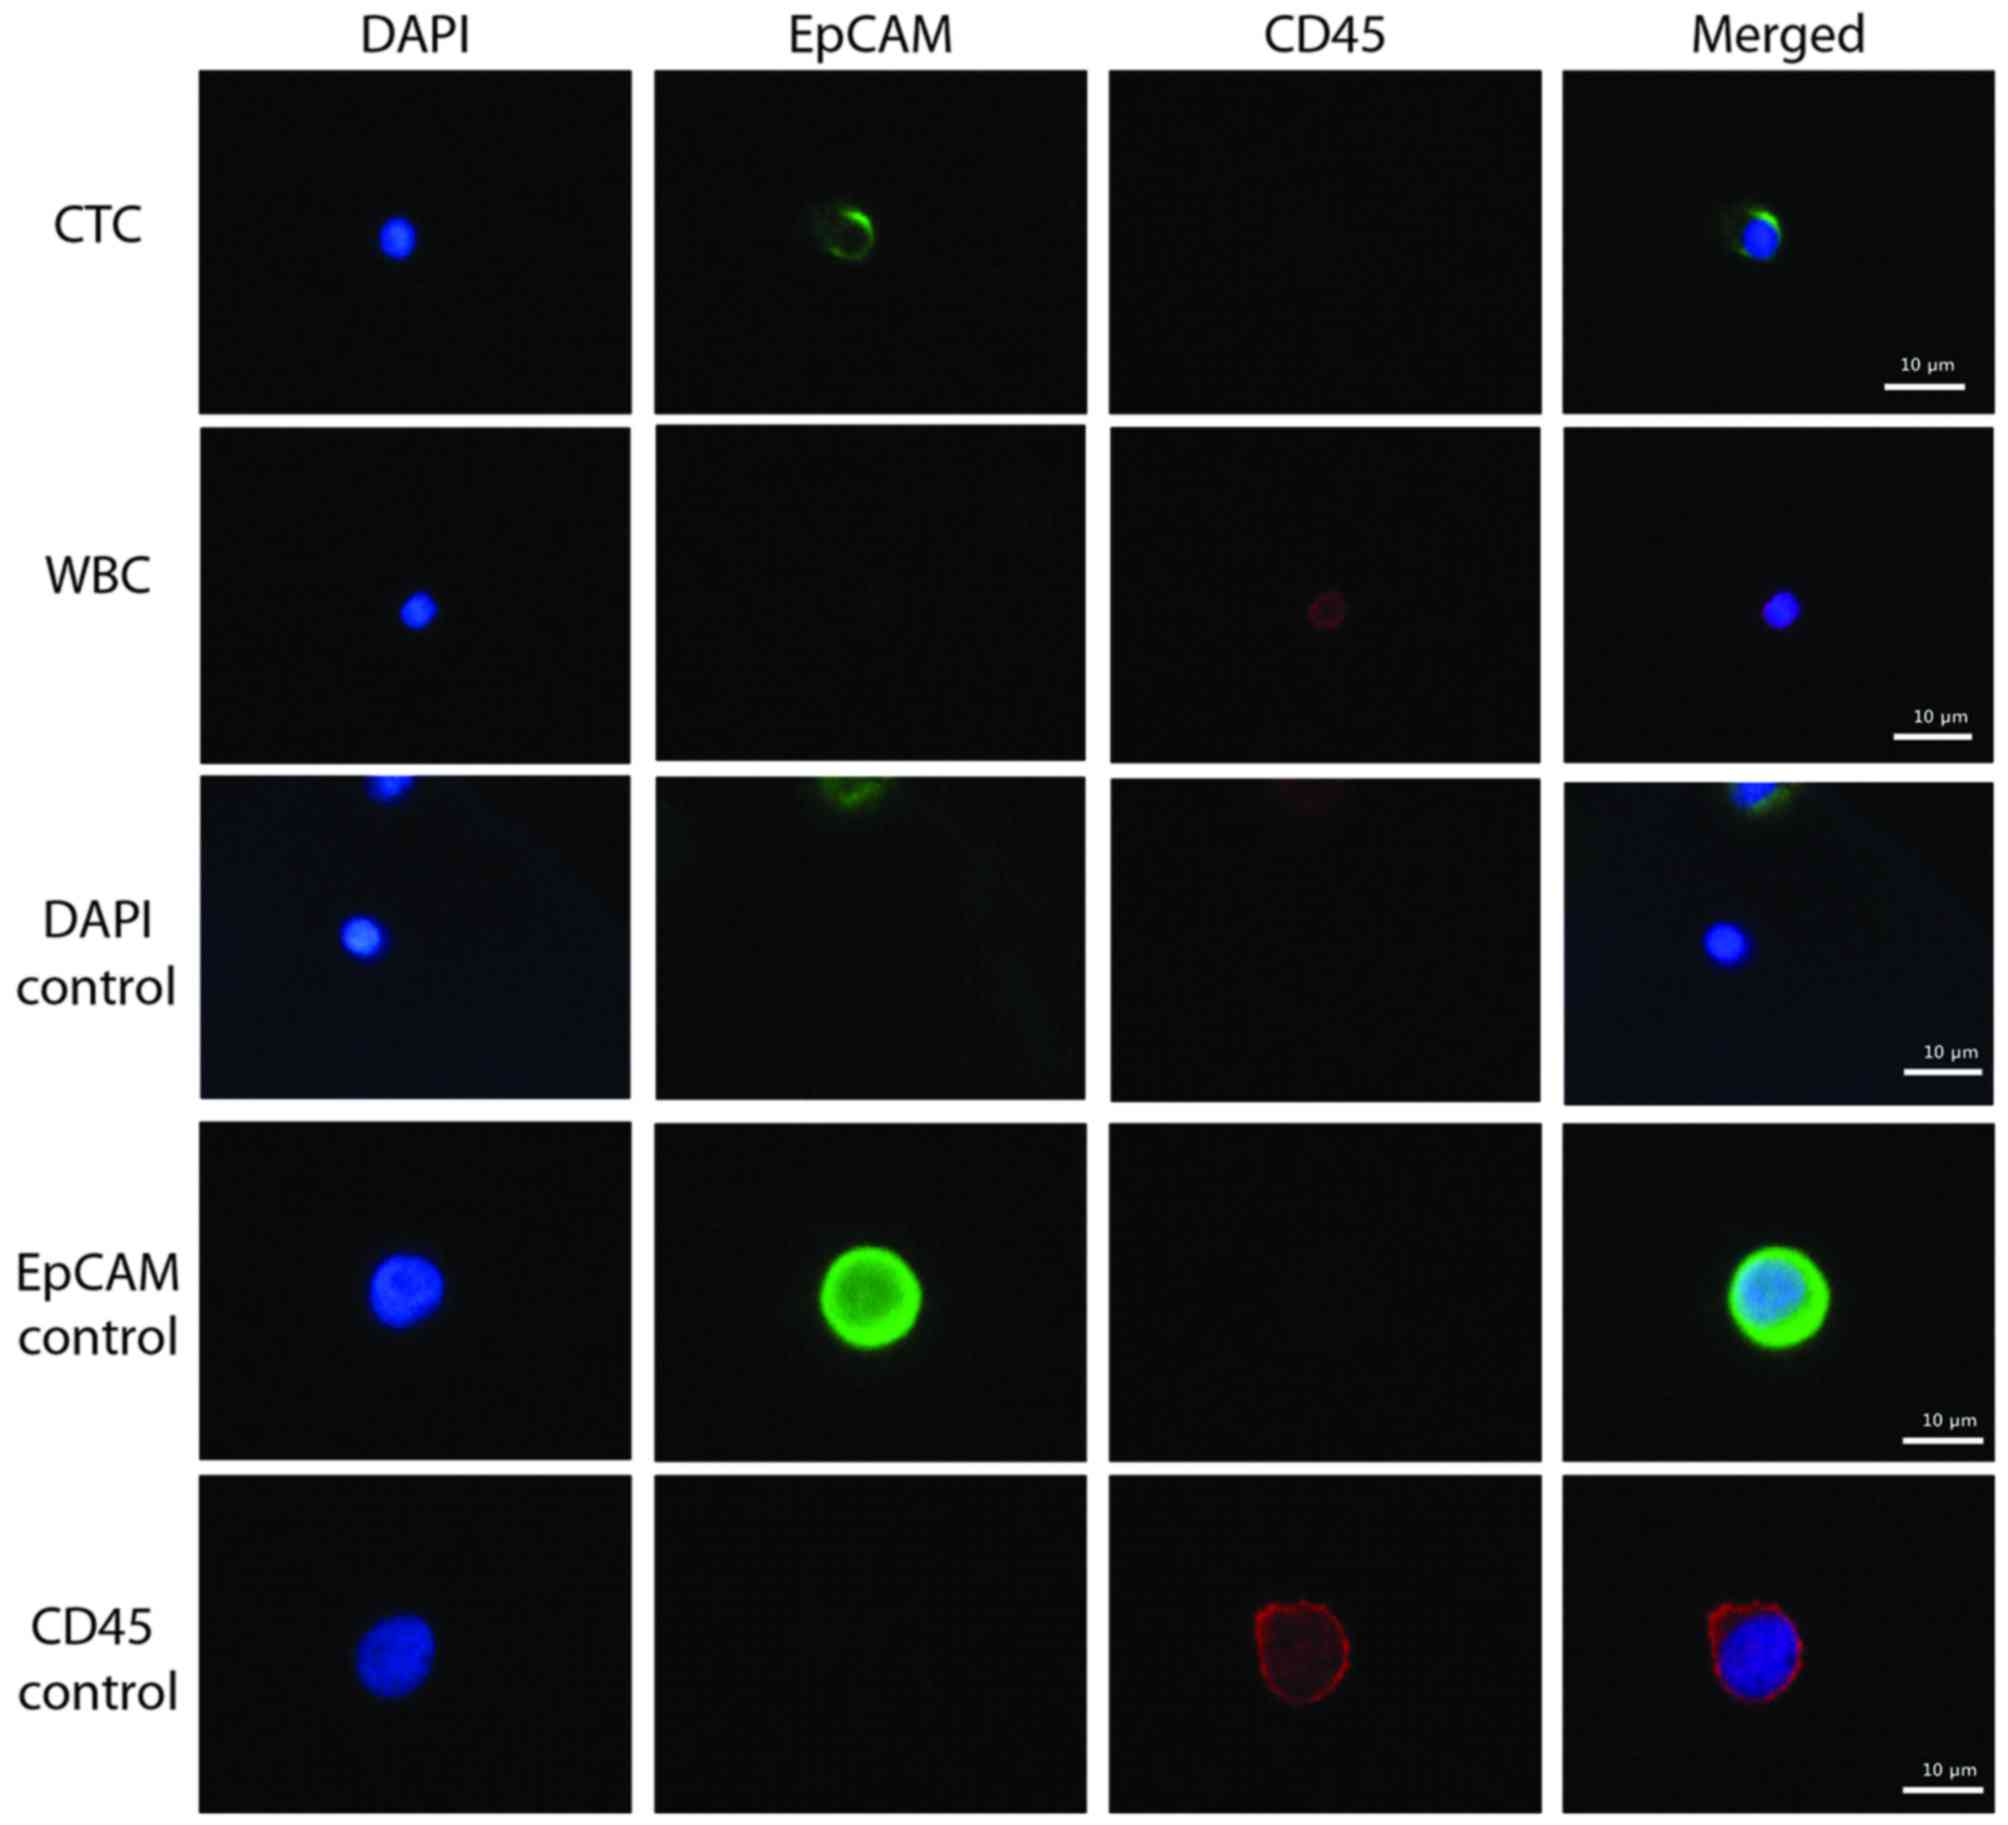
Efficiency of CTC isolation and
results of WGA
EpCAM-positive CTCs were detected in the blood
samples of patients with breast cancer (Fig. 2). PC9 (EpCAM-positive) and KG-1
(CD45-positive) cells were used as positive controls during this
immunostaining, in addition to WBCs. The average CTC count from the
11 patients was 3.9 in 5 ml blood and the detection rate was 90.9%
(10 out of 11) (Table II). The
purity of CTCs isolated with the protocol used in the current study
was 14.2% (range, 0–100; Table II).
The average amount of total DNA obtained following WGA was 28.6 µg
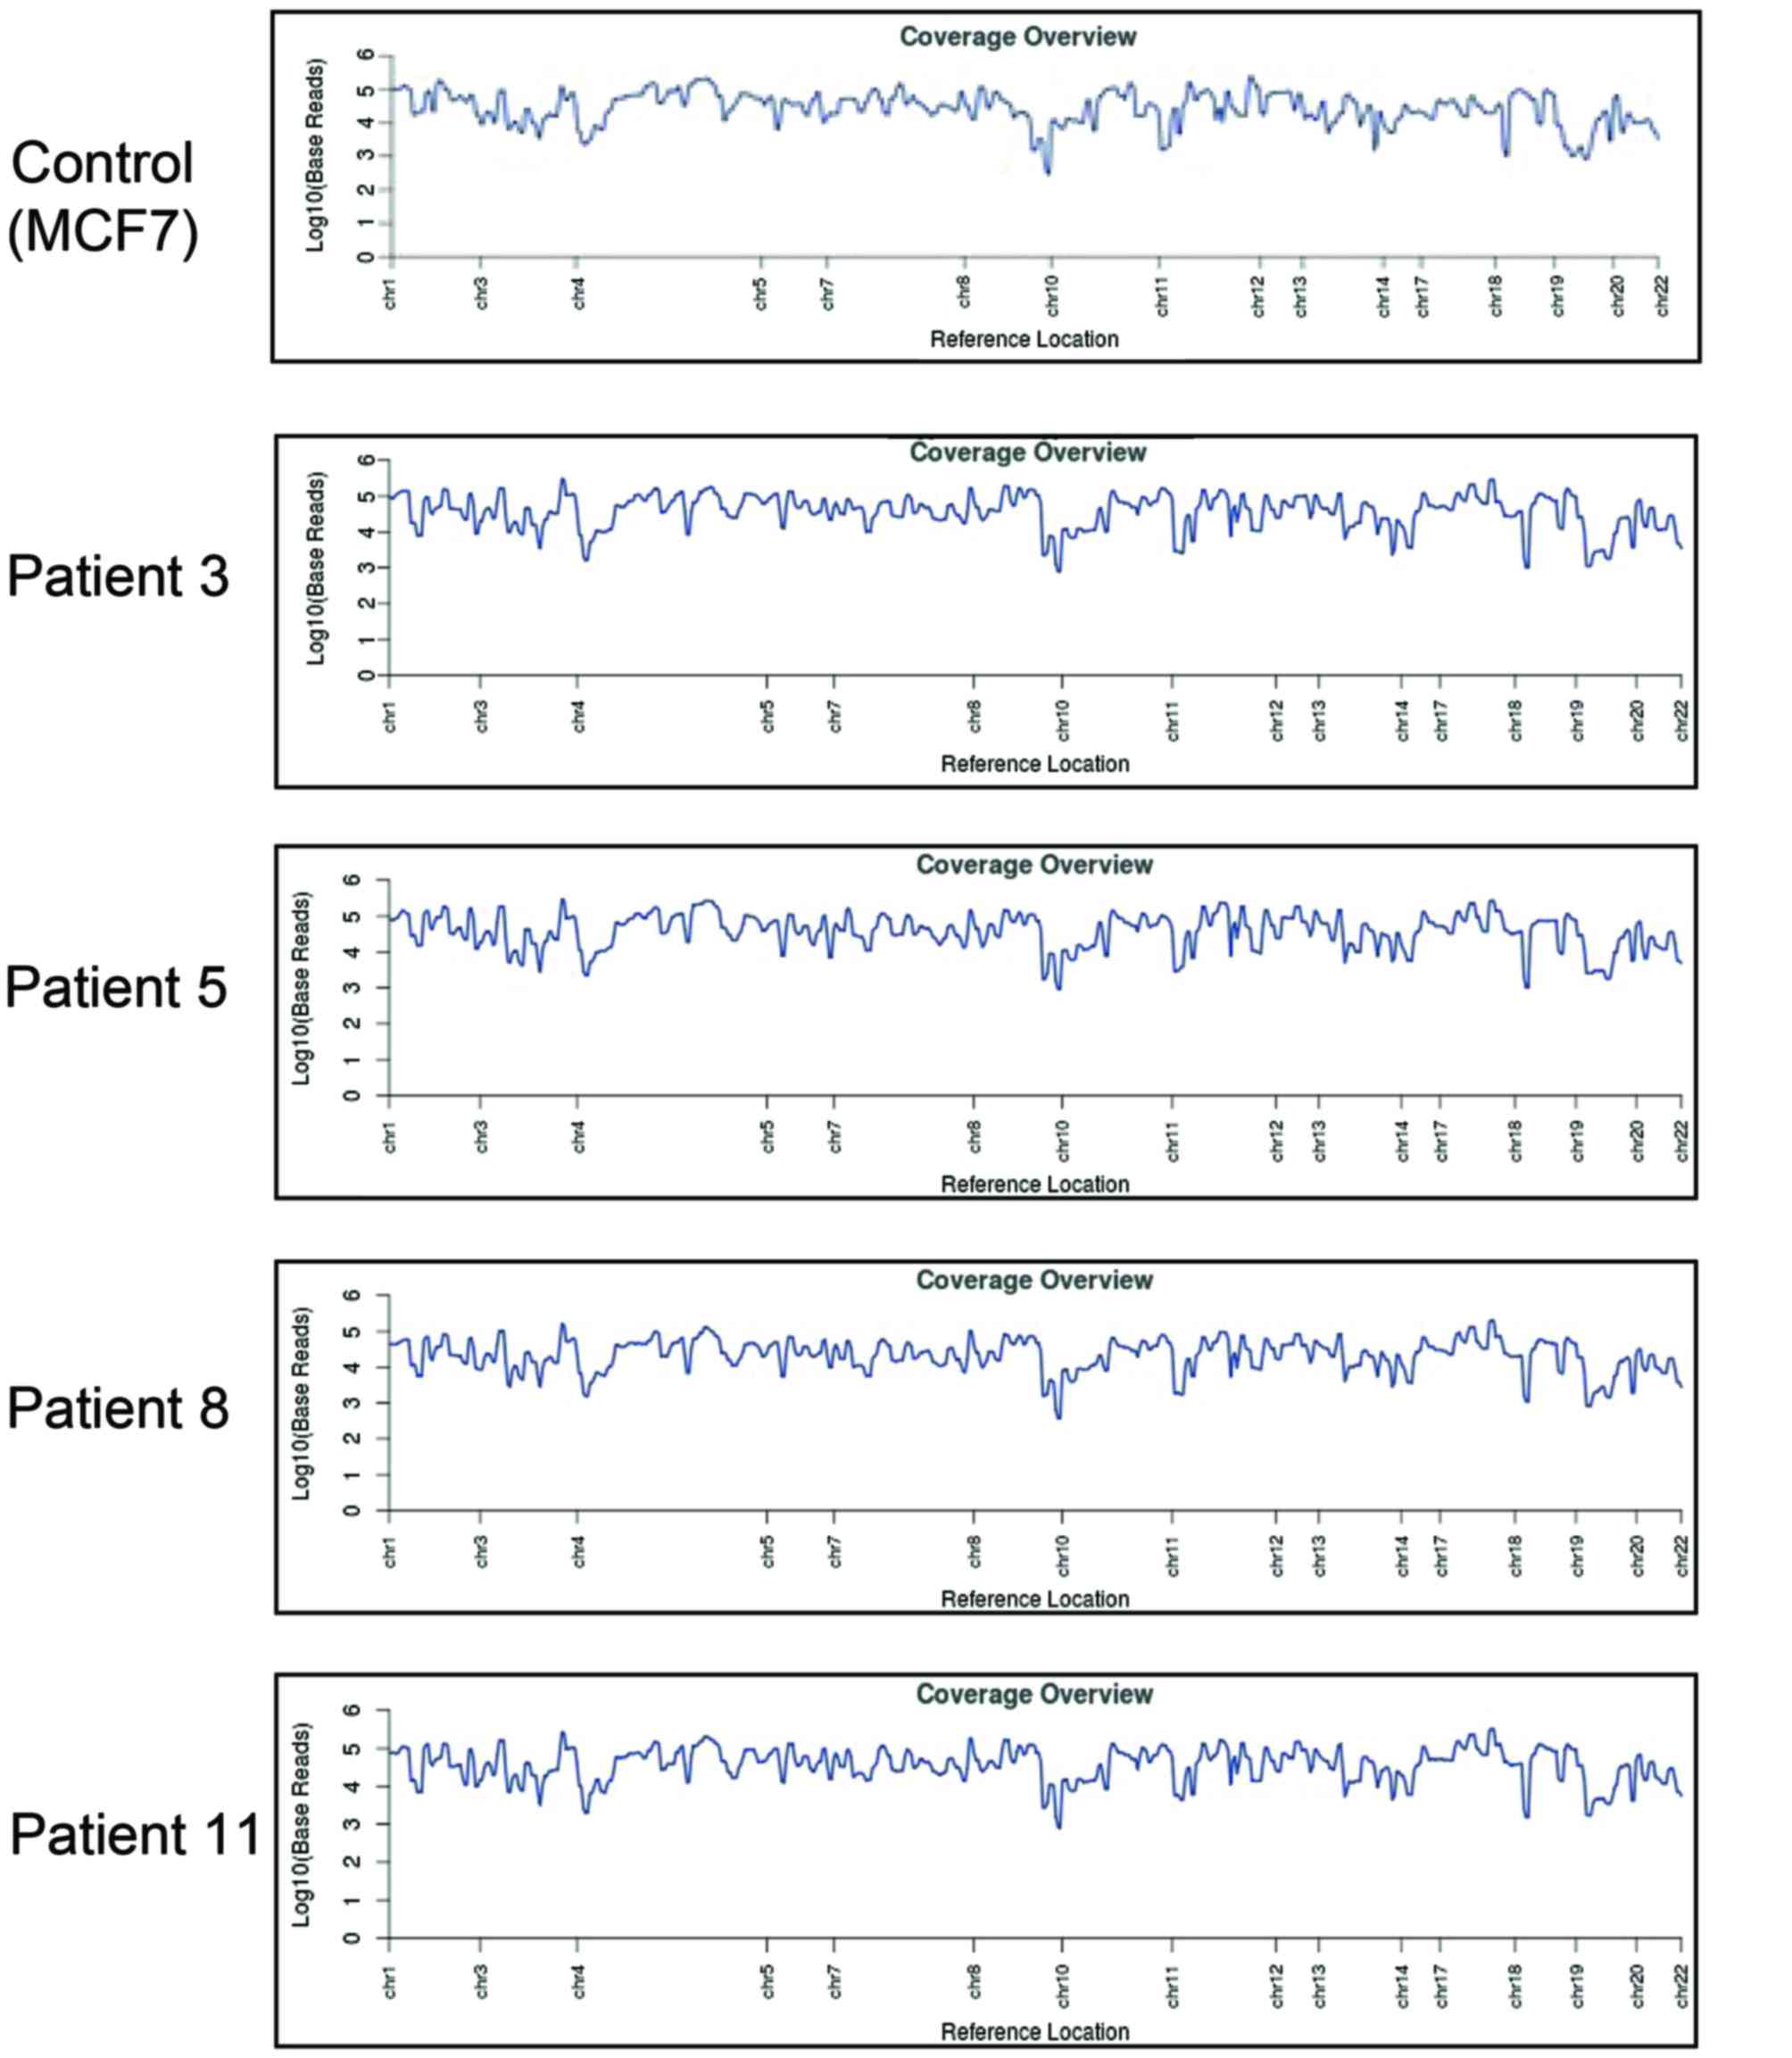
(range, 4.9–37.8 µg; Table II).
Reference coverage (the average number of reads that cover each
reference position) analysis demonstrated complete amplification of
CTC DNA compared with the MCF7 breast cancer cell line (Fig. 3).
| Table II.Efficiency of circulating tumor cell
isolation and whole genome amplification. |
Table II.
Efficiency of circulating tumor cell
isolation and whole genome amplification.
| Measure | Value |
|---|
| Total cell
number | 184.7±207.0
(1–636) |
| CTC (EpCAM-positive
cell) count | 3.9±5.5 (0–19) |
| CTC detection rate
(%) | 90.9±0.3 |
| CTC purity (%) | 14.2±29.4
(0–100) |
| DNA concentration
(ng/µl) | 571.4±171.9
(89–688) |
| Total DNA (µg) | 28.6±11.9
(4.9–37.9) |
Cancer gene panel analysis of CTCs
from patients with breast cancer
Cancer gene panel analysis was performed using the
Ion Ampliseq Cancer Hotspot Panel v2. In total, ≥10 ng of DNA can
be analyzed for 2,800 COSMIC mutations across 50 genes using this
panel. Mutations in MCF7 breast cancer cells were analyzed as a
control, with mutations detected in the following genes: PIK3CA,
APC, PTEN, IDH2 and TP53 (data not shown). In patient samples,
mutations were detected in the following genes: IDH2, TP53, NRAS,
IDH1, PDGFRA, HRAS, STK11, EGFR, PTEN, MLH1, PIK3CA, CDKN2A, KIT
and SMARCB1 (Table III). The median
allele frequency across all patients and genes was 4 (range,
1.7–100%). Mutations with allele frequencies of between 2 and 5%
were considered CTC-specific mutations and mutations with
frequencies >50% were considered germline mutations. Although
patient 6 tested negative for EpCAM-positive CTCs, COSMIC mutations
were detected in the sample. However, patient 9 tested negative for
all COSMIC mutations despite having the highest number of
EpCAM-positive cells: ERBB4, FGFR3, APC, CSF1R, FGFR1, RET, FLT3
and STK11 (not included in COSMIC and data not shown).
| Table III.Cancer gene panel analysis. |
Table III.
Cancer gene panel analysis.
| Patient | No. of EpCAM-positive
cells | Mutated gene | COSMIC ID no. | Amino acid
mutation | Allele frequency
(%) |
|---|
| 1 | 1 | IDH2 | 33733 | p.R172K | 4 |
|
|
| TP53 | 43753 | Unknown | 2.7 |
| 2 | 1 | NRAS | 564 | p.G12D | 21 |
|
|
| IDH1 | 28747 | p.R132C | 2 |
|
|
| PDGFRA | 22413 | p.V824V | 57.6 |
|
|
| HRAS | 249860 | p.H27H | 100 |
|
|
| IDH2 | 33733 | p.R172K | 4 |
|
|
| STK11 | 21378 | p.T32T | 48.6 |
| 3 | 1 | EGFR | 27110 | p.V786M | 1.8 |
|
|
| PTEN | 23626 | p.N323fs*2 | 2.3 |
|
|
| PTEN | 4994 | p.T321fs*3 | 2.3 |
|
|
| PTEN | 4990 | p.N323fs*2 | 2.3 |
|
|
| STK11 | 25851 | p.L282fs*3 | 4.9 |
|
|
| STK11 | 21360 | p.F354L | 62.5 |
| 4 | 1 | TP53 | 44547 | p.G226D | 1.7 |
|
|
| STK11 | 25851 | p.L282fs*3 | 18.1 |
| 5 | 3 | MLH1 | 26085 | p.V384D | 51.6 |
|
|
| PIK3CA | 14052 | p.K111R | 1.8 |
|
|
| STK11 | 25851 | p.L282fs*3 | 3.8 |
| 6 | 0 | CDKN2A | 14253 | p.H66R | 53.5 |
|
|
| IDH2 | 33733 | p.R172K | 2 |
| 7 | 1 | KIT | 28026 | p.M541L | 48.2 |
|
|
| SMARCB1 | 1090 | Unknown | 35.1 |
| 8 | 3 | PTEN | 23626 | p.N323fs*2 | 2.8 |
|
|
| PTEN | 4994 | p.T321fs*3 | 2.8 |
|
|
| PTEN | 4990 | p.N323fs*2 | 2.8 |
| 9 | 19 |
| N/A |
| 10 | 6 | HRAS | 249860 | p.H27H | 84.6 |
| 11 | 7 | KIT | 21983 | p.K546K | 52.9 |
Discussion
CTC isolation technologies are based upon the
physical or biological properties of CTCs. CELLSEARCH®,
the first and only US Food and Drug Administration approved system,
captures CTCs using antibodies directed against EpCAM, and defines
CTCs as CK8, 18 or 19-positive and CD45-negative cells (3). Therefore, this technology may isolate
fewer differentiated tumor cells. Rao et al (10) reported that the expression of EpCAM in
carcinoma cells decreases during epithelial-mesenchymal transition.
Furthermore, a recent report demonstrated that there are CTCs that
do not express EpCAM; therefore, EpCAM-based isolation technology
may fail to detect certain CTCs (11). The technique used in the present study
was able to isolate EpCAM-negative CTCs using size-based
filtration. In patient 6, no EpCAM-positive cells were observed but
mutations in CDKN2A and IDH2 genes were detected (Table III), indicating that there are
EpCAM-negative CTCs in patients with breast cancer.
The rarity of CTCs makes it difficult to obtain
sufficient amounts of DNA for analysis. Therefore, high purity
enrichment of CTCs from mixed cell populations is required for DNA
amplification using WGA. In the present study, 0–19 CTCs/5 ml blood
sample were detected (Table II) and
the amount of DNA following amplification was sufficient to carry
out cancer gene panel analysis (Table
III). The present study evaluated a novel approach to CTC
isolation and demonstrated that it is applicable to the genomic
analysis of CTCs from patients with breast cancer.
Previous studies have reported several genetic
mutations, including HER2, BRCA, PIK3CA, TP53, GATA3 and PTEN in
patients with breast cancer (20–25). In
the present study, mutations were detected in TP53, PIK3CA and PTEN
in the CTCs of patients with breast cancer, suggesting that genomic
analysis was successful. COSMIC mutations were identified in 10/11
patients; however, no COSMIC mutations were detected in patient 9,
who had 19 EpCAM-positive cells (Table
III). Although no COSMIC mutations were observed in patient 9,
mutations were identified in the following genes: ERBB4, FGFR3,
APC, CSF1R, FGFR1, RET, FLT3 and STK11. Among them, APC, FGFR1,
TP53 and SKT11 mutations have previously been reported as driver
mutations in breast cancer (26).
Further investigation with a larger cohort of patients may provide
useful information about the genetic mutations associated with
breast cancer and aid in the development of therapeutic strategies
for the treatment of this disease.
Liquid biopsies, followed by molecular profiling of
the CTCs isolated, may have applications in cancer diagnosis,
prediction of recurrence and metastasis, and aid in therapy
decision-making. In addition, CTCs can be obtained in a
non-invasive and reproducible manner. In conclusion, the present
study evaluated a novel approach to CTC isolation and demonstrated
its application in the genomic analysis of CTCs from patients with
breast cancer.
Acknowledgements
The present study was supported by the National
Research and Development Program of the Ministry of Trade, Industry
and Energy of Korea (grant no. 10045947). In addition, the authors
would like to thank Enago (www.enago.co.kr) for reviewing the English language of
the present study.
References
|
1
|
Pukazhendhi G and Glück S: Circulating
tumor cells in breast cancer. J Carcinog. 13:82014. View Article : Google Scholar : PubMed/NCBI
|
|
2
|
Alix-Panabieres C and Pantel K: Challenges
in circulating tumor cell research. Nat Rev Cancer. 14:623–631.
2014. View
Article : Google Scholar : PubMed/NCBI
|
|
3
|
Pantel K, Alix-Panabières C and Riethdorf
S: Cancer micrometastases. Nat Rev Clin Oncol. 6:339–351. 2009.
View Article : Google Scholar : PubMed/NCBI
|
|
4
|
Pantel K and Alix-Panabières C: Real-time
liquid biopsy in cancer patients: Fact or fiction? Cancer Res.
73:6384–6388. 2013. View Article : Google Scholar : PubMed/NCBI
|
|
5
|
Ilie M, Hofman V, Long E, Bordone O, Selva
E, Washetine K, Marquette CH and Hofman P: Current challenges for
detection of circulating tumor cells and cell-free circulating
nucleic acids, and their characterization in non-small cell lung
carcinoma patients. What is the best blood substrate for
personalized medicine? Ann Transl Med. 2:1072014.PubMed/NCBI
|
|
6
|
Alix-Panabieres C and Pantel K: The
circulating Tumor Cells: liquid biopsy of cancer. Klin Lab Diagn.
4:60–64. 2014.(In Russian).
|
|
7
|
Allard WJ, Matera J, Miller MC, Repollet
M, Connelly MC, Rao C, Tibbe AG, Uhr JW and Terstappen LW: Tumor
cells circulate in the peripheral blood of all major carcinomas but
not in healthy subjects or patients with nonmalignant diseases.
Clin Cancer Res. 10:6897–6904. 2004. View Article : Google Scholar : PubMed/NCBI
|
|
8
|
Sestier C, Lacava ZGM, Lacava LM, Da Silva
MF and Azevedo RB: In vitro toxicity of magnetic fluids evaluated
for macrophage cell lines. J Magn Magn Mater. 252:403–405. 2002.
View Article : Google Scholar
|
|
9
|
Tiwari A, Punshon G, Kidane A, Hamilton G
and Seifalian AM: Magnetic beads (Dynabead) toxicity to endothelial
cells at high bead concentration: Implication for tissue
engineering of vascular prosthesis. Cell Biol Toxicol. 19:265–272.
2003. View Article : Google Scholar : PubMed/NCBI
|
|
10
|
Rao CG, Chianese D, Doyle GV, Miller MC,
Russell T, Sanders RA Jr and Terstappen LW: Expression of
epithelial cell adhesion molecule in carcinoma cells present in
blood and primary and metastatic tumors. Int J Oncol. 27:49–57.
2005.PubMed/NCBI
|
|
11
|
Sieuwerts AM, Kraan J, Bolt J, van der
Spoel P, Elstrodt F, Schutte M, Martens JW, Gratama JW, Sleijfer S
and Foekens JA: Anti-epithelial cell adhesion molecule antibodies
and the detection of circulating normal-like breast tumor cells. J
Natl Cancer Inst. 101:61–66. 2009. View Article : Google Scholar : PubMed/NCBI
|
|
12
|
Johnson RH, Chien FL and Bleyer A:
Incidence of breast cancer with distant involvement among women in
the United States, 1976 to 2009. JAMA. 309:800–805. 2013.
View Article : Google Scholar : PubMed/NCBI
|
|
13
|
Vogel CL, Cobleigh MA, Tripathy D, Gutheil
JC, Harris LN, Fehrenbacher L, Slamon DJ, Murphy M, Novotny WF,
Burchmore M, et al: Efficacy and safety of trastuzumab as a single
agent in first-line treatment of HER2-overexpressing metastatic
breast cancer. J Clin Oncol. 20:719–726. 2002. View Article : Google Scholar : PubMed/NCBI
|
|
14
|
Spector NL, Xia W, Burris H III, Hurwitz
H, Dees EC, Dowlati A, O'Neil B, Overmoyer B, Marcom PK, Blackwell
KL, et al: Study of the biologic effects of lapatinib, a reversible
inhibitor of ErbB1 and ErbB2 tyrosine kinases, on tumor growth and
survival pathways in patients with advanced malignancies. J Clin
Oncol. 23:2502–2512. 2005. View Article : Google Scholar : PubMed/NCBI
|
|
15
|
Fernandez SV, Bingham C, Fittipaldi P,
Austin L, Palazzo J, Palmer G, Alpaugh K and Cristofanilli M: TP53
mutations detected in circulating tumor cells present in the blood
of metastatic triple negative breast cancer patients. Breast Cancer
Res. 16:4452014. View Article : Google Scholar : PubMed/NCBI
|
|
16
|
Pestrin M, Salvianti F, Galardi F, De Luca
F, Turner N, Malorni L, Pazzagli M, Di Leo A and Pinzani P:
Heterogeneity of PIK3CA mutational status at the single cell level
in circulating tumor cells from metastatic breast cancer patients.
Mol Oncol. 9:749–757. 2015. View Article : Google Scholar : PubMed/NCBI
|
|
17
|
American Joint Committee on Cancer: AJCC
Cancer Staging Manual. 7th. Springer; New York, NY: 2010
|
|
18
|
Kim EH, Lee JK, Kim BC, Rhim SH, Kim JW,
Kim KH, Jung SM, Park PS, Park HC, Lee J and Jeon BH: Enrichment of
cancer cells from whole blood using a microfabricated porous
filter. Anal Biochem. 440:114–116. 2013. View Article : Google Scholar : PubMed/NCBI
|
|
19
|
Columns FA, van Dalum G, Beck M and
Terstappen LW: Filter characteristics influencing circulating tumor
cell enrichment from whole blood. PLoS One. 8:e617702013.
View Article : Google Scholar : PubMed/NCBI
|
|
20
|
Kallioniemi OP, Kallioniemi A, Kurisu W,
Thor A, Chen LC, Smith HS, Waldman FM, Pinkel D and Gray JW: ERBB2
amplification in breast cancer analyzed by fluorescence in situ
hybridization. Proc Natl Acad Sci USA. 89:5321–5325. 1992.
View Article : Google Scholar : PubMed/NCBI
|
|
21
|
Gretarsdottir S, Thorlacius S,
Valgardsdottir R, Gudlaugsdottir S, Sigurdsson S, Steinarsdottir M,
Jonasson JG, Anamthawat-Jonsson K and Eyfjörd JE: BRCA2 and p53
mutations in primary breast cancer in relation to genetic
instability. Cancer Res. 58:859–862. 1998.PubMed/NCBI
|
|
22
|
Janku F, Wheler JJ, Westin SN, Moulder SL,
Naing A, Tsimberidou AM, Fu S, Falchook GS, Hong DS, Garrido-Laguna
I, et al: PI3K/AKT/mTOR inhibitors in patients with breast and
gynecologic malignancies harboring PIK3CA mutations. J Clin Oncol.
30:777–782. 2012. View Article : Google Scholar : PubMed/NCBI
|
|
23
|
Arnold JM, Choong DY and Thompson ER:
kConFab, Waddell N, Lindeman GJ, Visvader JE, Campbell IG and
Chenevix-Trench G: Frequent somatic mutations of GATA3 in
non-BRCA1/BRCA2 familial breast tumors, but not in BRCA1-, BRCA2-
or sporadic breast tumors. Breast Cancer Res Treat. 119:491–496.
2010. View Article : Google Scholar : PubMed/NCBI
|
|
24
|
Hu T and Li C: Convergence between
Wnt-β-catenin and EGFR signaling in cancer. Mol Cancer. 9:2362010.
View Article : Google Scholar : PubMed/NCBI
|
|
25
|
Augello MA, Burd CJ, Birbe R, McNair C,
Ertel A, Magee MS, Frigo DE, Wilder-Romans K, Shilkrut M, Han S, et
al: Convergence of oncogenic and hormone receptor pathways promotes
metastatic phenotypes. J Clin Invest. 123:493–508. 2013. View Article : Google Scholar : PubMed/NCBI
|
|
26
|
Stephens PJ, Tarpey PS, Davies H, Van Loo
P, Greenman C, Wedge DC, Nik-Zainal S, Martin S, Varela I, Bignell
GR, et al: The landscape of cancer genes and mutational processes
in breast cancer. Nature. 486:400–404. 2012.PubMed/NCBI
|