Introduction
Gallbladder carcinoma (GBC) is the most common
biliary tract cancer and a common type of cancer of the
gastrointestinal tract (1). The
incidence and distribution of GBC differs by region (2,3); for
example, the prevalence of GBC in South and East Asia is increased
compared with that in Europe and the Americas (4). Surgical resection is the only treatment
for GBC; however, the majority of patients are not candidates for
curative resection when they are diagnosed, and patients with
advanced stages of the disease are likely to exhibit recurrences
following surgery (5). Although there
have been advances in chemotherapy, the prognosis of GBC remains
poor (6). The mean survival ranges
between 5.2 and 24.4 months (7–10). The
majority of patients with GBC succumb to metastasis and recurrence
following surgery. Although previous studies have reported that
accumulated genomic damage promotes GBC progression (11,12), the
underlying molecular mechanisms of GBC progression remain
unclear.
Previous studies have identified non-coding RNAs
(ncRNAs) as principal components of the human transcriptome
(13,14). According to their length, ncRNAs may
be divided into two types: Long ncRNAs (lncRNAs) and small
regulatory RNAs. lncRNAs have lengths of between 200 bp and 100 kb
(15). Increasing evidence in
previous years has determined that ncRNAs serve important
regulatory roles in cellular physiological processes and diseases
(16), including Huntington's disease
(17), Alzheimer's disease (18), and glioma, lung, colorectal, breast
cancer and hepatocellular cancer (19–22).
Accordingly, lncRNA dysregulation, including metastasis-associated
lung adenocarcoma transcript 1, colon cancer-associated transcript
1, homeobox transcript antisense RNA (HOTAIR) and low expression in
tumor, is also associated with GBC (23–26).
Although numerous lncRNAs have been discovered over the previous
decade, the biological functions of lncRNAs in GBC and their
underlying molecular mechanisms remain unclear. Using microarray
analysis, 654 lncRNAs and 1,057 mRNAs that were markedly aberrantly
expressed in GBC and paired peri-carcinomatous tissue samples were
identified. The results were validated using the reverse
transcription-quantitative polymerase chain reaction (RT-qPCR) and
were consistent with the data analysis of the profiles.
Co-expression networks of lncRNAs and mRNAs, as well as Gene
Ontology (GO) and Kyoto Encyclopedia of Genes and Genomes (KEGG)
pathway analyses, were used to determine the biological processes
for lncRNAs. The results of the present study demonstrated that
aberrantly expressed lncRNAs may serve a role in the occurrence and
development of GBC.
Materials and methods
Ethics statement
All aspects of the present study were approved by
the Zhongshan Hospital Research Ethics Committee (Zhongshan
Hospital, Fudan University, Shanghai, China). All patients provided
written informed consent for the use of their surgical specimens in
the present study in accordance with the Committee's regulations.
The clinical characteristics of the patients with GBC are presented
in Table I. Tissue specimens were
selected randomly from Zhongshan Hospital, Fudan University
(Shanghai, China) between April and September 2014.
 | Table I.Clinical characteristics of 23
gallbladder carcinoma cases. |
Table I.
Clinical characteristics of 23
gallbladder carcinoma cases.
| Patient no. | Age, years | Gender | T | N | M | TNM stage |
|---|
| P1 | 69 | F | 3 | 0 | 0 | IIIA |
| P2 | 51 | M | 2 | 0 | 0 | II |
| P3 | 62 | M | 3 | 1 | 0 | IIIB |
| P3 | 50 | F | 3 | 0 | 0 | IIIA |
| P4 | 40 | M | 1 | 0 | 0 | I |
| P5 | 50 | F | 3 | 0 | 0 | IIIA |
| P6 | 41 | F | 1b | 0 | 0 | I |
| P7 | 50 | F | 3 | 0 | 0 | IIIA |
| P8 | 71 | F | 4 | 1 | 0 | IVA |
| P9 | 60 | F | 4 | 2 | 1 | IVB |
| P10 | 51 | F | 1b | 0 | 0 | I |
| P11 | 57 | F | 1b | 0 | 0 | I |
| P12 | 65 | F | 3 | 0 | 0 | IIIA |
| P13 | 66 | M | 3 | 1 | 0 | IIIB |
| P14 | 57 | F | 2 | 2 | 0 | IVB |
| P15 | 78 | F | 1b | 0 | 0 | I |
| P16 | 68 | F | 2 | 0 | 0 | II |
| P17 | 41 | M | 3 | 1 | 0 | IIIB |
| P18 | 49 | M | 3 | 0 | 0 | IIIA |
| P19 | 76 | M | 3 | 1 | 0 | IIIB |
| P20 | 67 | F | 3 | 0 | 0 | IIIA |
| P21 | 62 | F | 4 | 2 | 1 | IVB |
| P22 | 66 | M | 3 | 0 | 0 | IIIA |
| P23 | 75 | M | 3 | 0 | 0 | IIIA |
Extraction of total RNA and
RT-qPCR
Paired tissues of GBC and peri-carcinomatous tissues
from each patient were quick-frozen in liquid nitrogen immediately
following resection and stored at −80°C. Total RNA was isolated
using TRIzol® reagent (Invitrogen; Thermo Fisher
Scientific, Inc., Waltham, MA, USA) according to the manufacturer's
protocol. A BioPhotometer® plus 6132 instrument
(Eppendorf, Hamburg, Germany) was used to measure RNA
concentrations. Total RNA (1 µg) was reverse transcribed using
Moloney murine leukaemia virus reverse transcriptase (Fermentas;
Thermo Fisher Scientific, Inc.). The lncRNA expression levels were
determined using RT-qPCR (27) with
an Applied Biosystems® 7500 fast real-time PCR thermal
cycler instrument (Applied Biosystems; Thermo Fisher Scientific,
Inc.), and three replicate PCRs were performed. The PCR kit was
purchased from Tiangen Biotech Co., Ltd. (Beijing, China) and 250
ng cDNA was added to each PCR tube. The primers used in the present
study are listed in Table II.
β-Actin and 18s were used as an endogenous reference (the β-actin
primers were purchased from Sangon Biotech Co., Ltd., Shanghai,
China). The amplification conditions were as follows: Reverse
transcription reaction at 42°C for 30 min per cycle. The PCR
cycling conditions were as follows: Enzyme activation at 95°C for
10 sec per 40 cycles, and annealing and extension at 60°C for 32
sec.
| Table II.Primers used for reverse
transcription-quantitative polymerase chain reaction. |
Table II.
Primers used for reverse
transcription-quantitative polymerase chain reaction.
| lncRNA | Forward primer
(5′-3′) | Reverse primer
(5′-3′) |
|---|
| β-actin |
CCAAGCAGCATGAAGATCAA |
TCTGCTGGAAGGTGCTGAG |
| 18s |
TTGGTCTGTTTAGCGAGGTG |
ACGCTGAGCCAGTCAGTGTA |
| CRNDE |
CAAATGGAAGCCAGAGGAAA |
ATTCAGCACAAGGCAAGGAT |
| CTA-941F9.9 |
CTCCGTTTCTTCTCTGAGACTTC |
GAGGCACTTCCTTGTGACTT |
lncRNA and mRNA microarray expression
profiling
Microarray hybridization was carried out by the
CapitalBio Corporation (Shanghai, China) on behalf of the present
study. Ribosomal RNA was removed from total RNA using an mRNA-ONLY™
Eukaryotic mRNA Isolation kit (Epicentre; Illumina, Madison, WI,
USA), according to the manufacturer's protocol, and discarded. Each
mRNA sample was transcribed into complementary RNA (cRNA)
containing cyanine-3-cytidine 5′-triphosphate fluorescent labels
(Agilent Technologies, Inc., Santa Clara, CA, USA). Klenow enzyme
labeling strategy was adopted following reverse transcription using
CbcScript II reverse transcriptase. Labeled cDNA was produced by
Eberwine's linear RNA amplification method and subsequent enzymatic
reaction. This procedure has been previously described, and the
procedure has been improved by using CapitalBio cRNA Amplification
and Labeling kit (CapitalBio, Beijing, China) for producing higher
yields of labeled cDNA (28). The
labeled cRNAs were hybridized on the Human lncRNA array V4.0
(4×180K, Agilent Technologies, Inc.), which contained the global
profiles of 108,458 transcripts (78,243 ncRNAs and 30,215 coding
RNAs). The microarrays were washed with two consecutive solutions
(0.2% SDS, 2xSSC at 42°C for 5 min, and 0.2xSSC for 5 min at room
temperature) and scanned using an Agilent G2505C Microarray Scanner
system (Agilent Technologies, Inc.), according to the
manufacturer's protocol. The raw data were analyzed using Feature
Extraction software (version 10.7.1.1; Agilent Technologies, Inc.)
and then normalized using percentile normalization. Aberrantly
expressed lncRNAs and mRNAs (fold-change ≥2.0 or ≤0.5; P<0.05)
were selected for further study. To identify lncRNAs and mRNAs
expression patterns, hierarchical clustering was performed on six
tissue samples using Cluster 3.0 (Stanford University School of
Medicine, Stanford, CA, USA) and Treeview 2.0 (Baryshnikova Lab,
Princeton University, NJ, USA). The results were compared with the
microarray data deposited in the National Center for Biotechnology
Information Gene Expression Omnibus (GEO) [gene sequence expression
series (GSE) accession number GSE62335, www.ncbi.nlm.nih.gov/geo/query/acc.cgi?acc=GSE62335].
Functional group analysis
To identify the biological functions of the 1,057
aberrantly expressed mRNAs determined as described above, GO and
KEGG analyses were used to determine the signaling pathways. The
mRNA data were uploaded into the Database for Annotation,
Visualization and Integrated Discovery (david.abcc.ncifcrf.gov/tools.jsp) prior to analyzing
the enrichment. Fisher's exact test was used to determine the
significance of the GO term enrichment for differentially expressed
genes. P<0.05 was considered to indicate a statistically
significant difference. A false discovery rate (FDR) <0.05
determined the significance of the association of the pathways with
the conditions.
Co-expression network
construction
An lncRNA-mRNA co-expression network was constructed
to determine their association, and the algorithm was as follows:
i) The data were preprocessed for median gene expression values of
all transcripts from the same coding gene, without special
treatment for lncRNAs; ii) data for aberrantly expressed lncRNAs
and mRNAs were removed following screening; iii) Pearson's
correlation coefficient (PCC) was calculated and the R value was
used to calculate the PCC between lncRNAs and mRNAs; and iv) the
data were screened and data for which the PCC was >0.99 were
selected. The gene co-expression network was constructed using
Cytoscape software version 3.1.1 (U.S. National Institute of
General Medical Sciences, Washington, DC, USA).
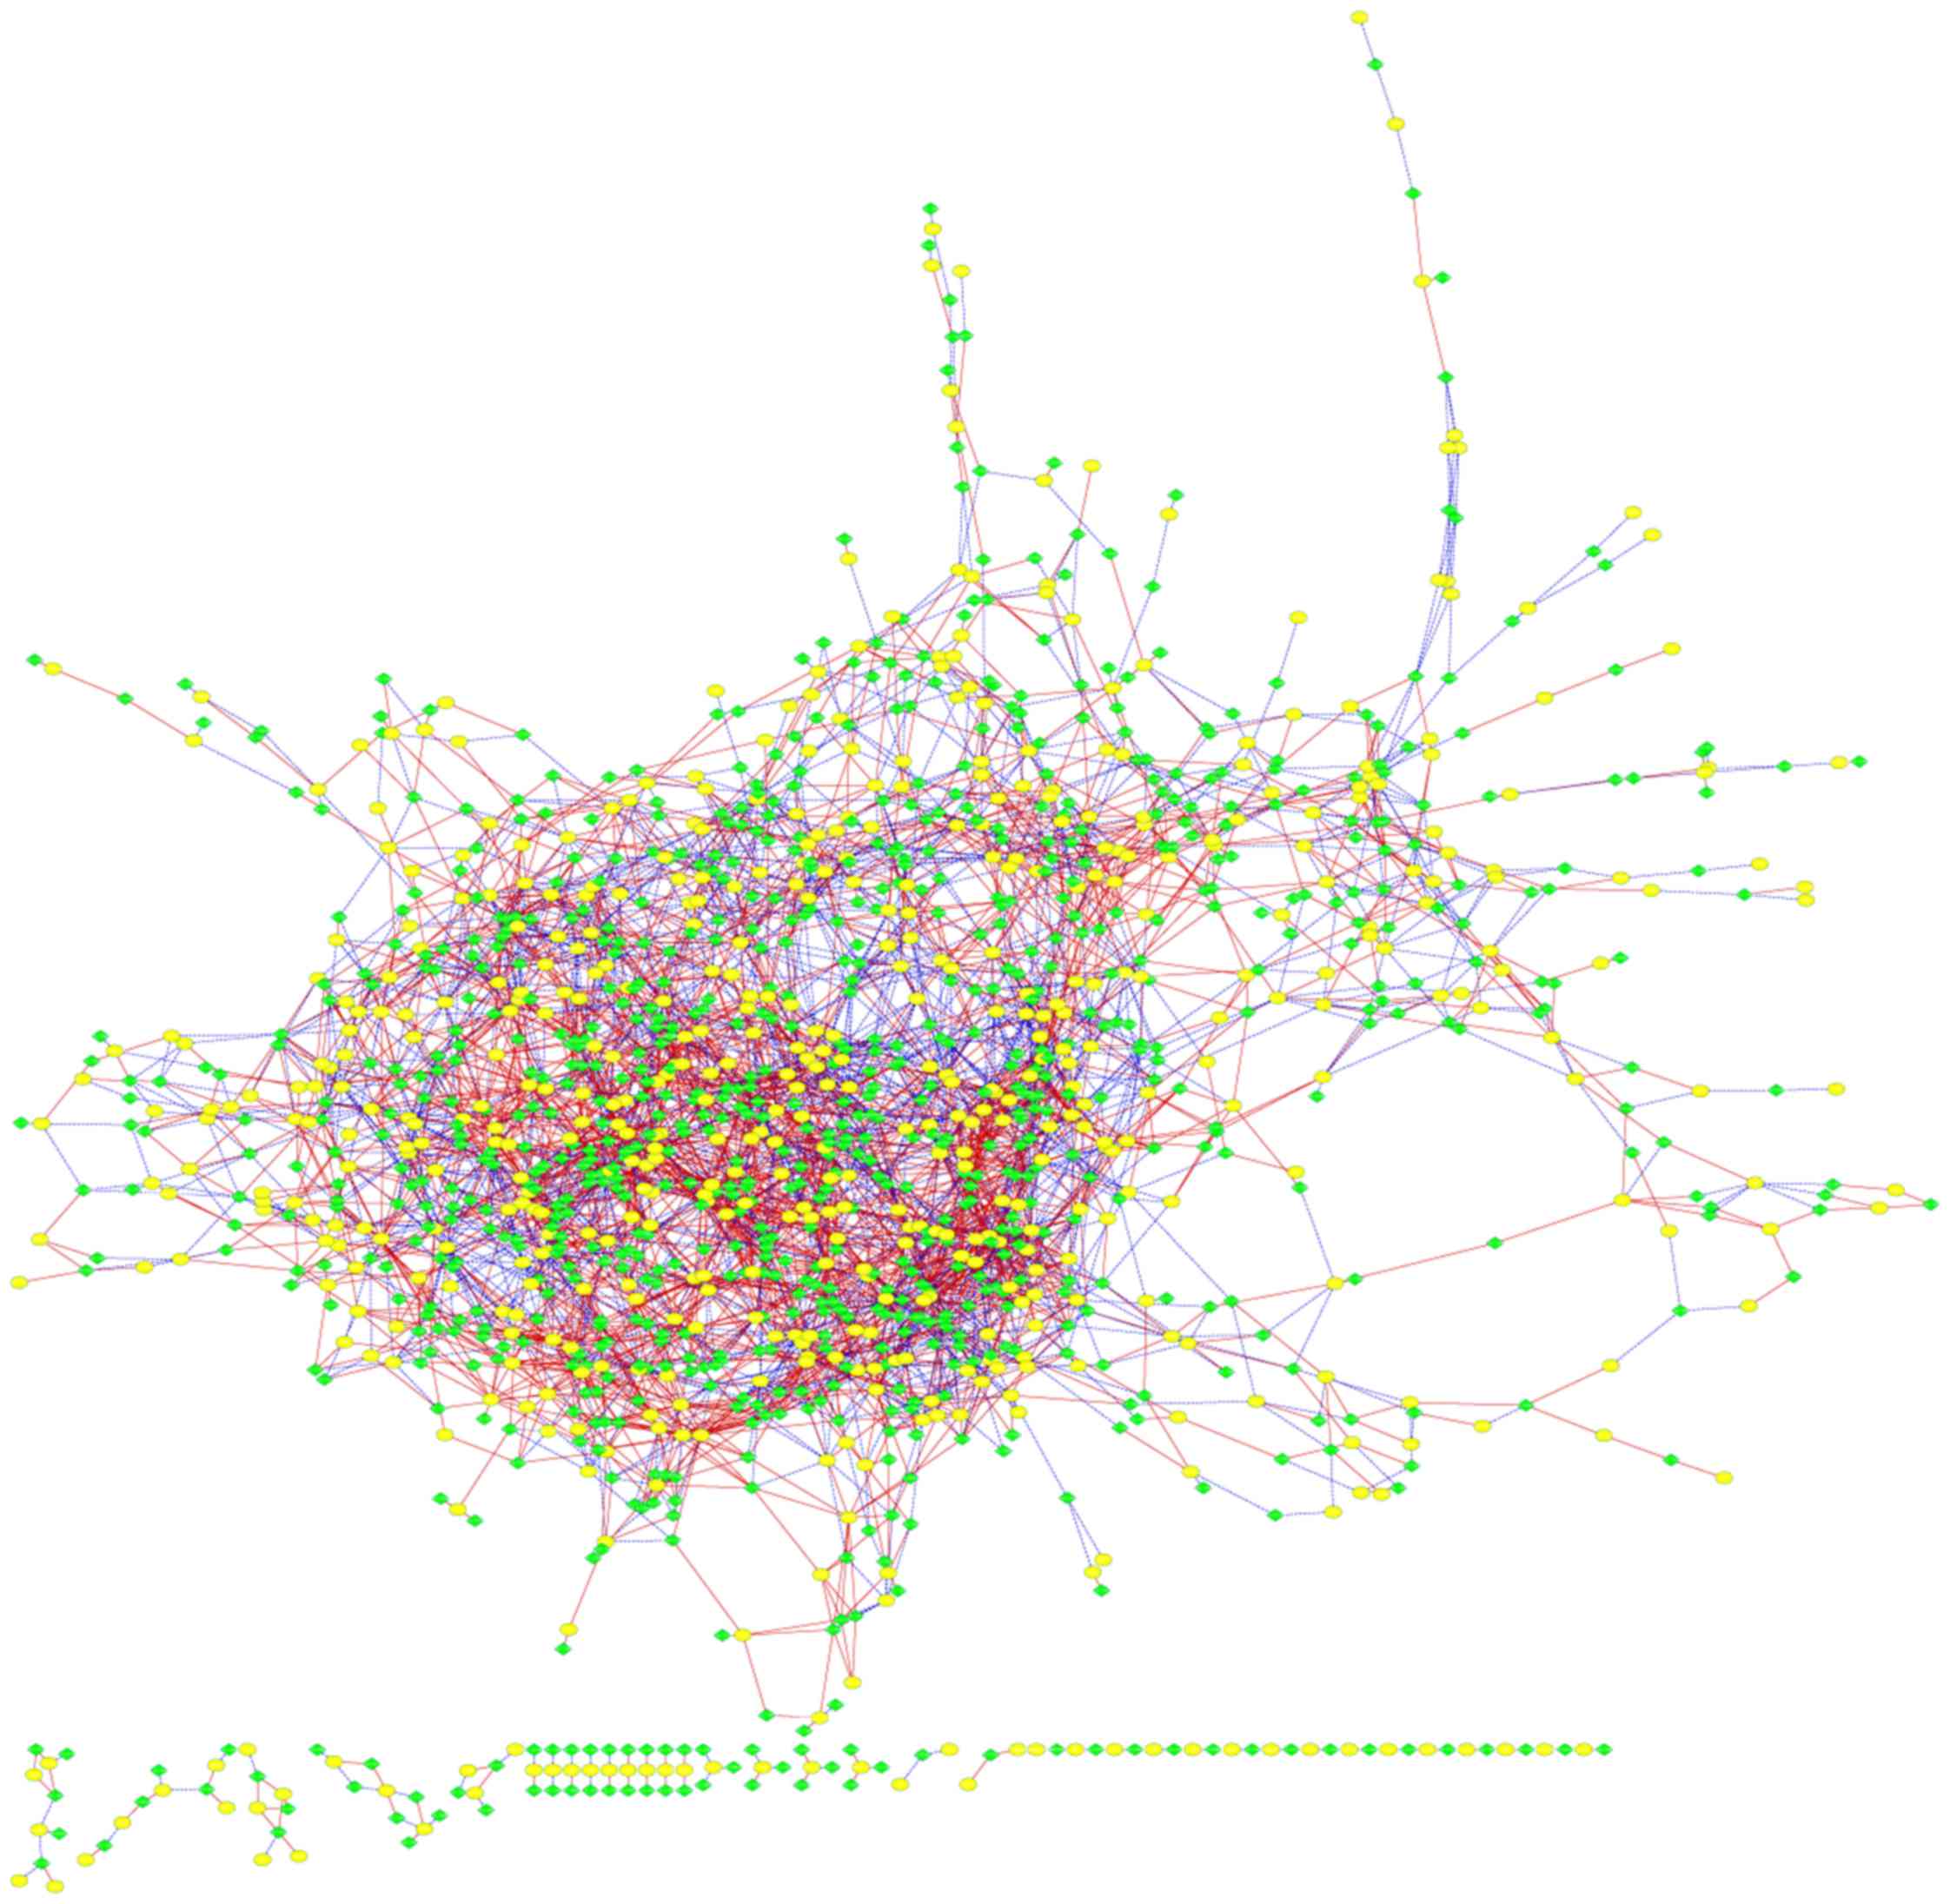
In the network, yellow nodes represented the lncRNAs
and green nodes represented the mRNAs. Circular nodes represented
lncRNAs and diamond nodes represented the mRNAs. Continuous lines
indicated a positive association and dashed lines indicated a
negative association.
Cell culture
The human GBC cell line SGC-996 was provided by the
Tumor Cytology Research Unit (Medical College, Tongji University,
Shanghai, China). Human GBC cell line GBC-SD was purchased from the
Type Culture Collection of the Chinese Academy of Sciences
(Shanghai, China). Cell lines were maintained in Dulbecco's
modified Eagle's medium (DMEM, Gibco; Thermo Fisher Scientific,
Inc.) containing 10% fetal bovine serum (Gibco; Thermo Fisher
Scientific, Inc.), 100 mg/ml streptomycin and 100 units/ml
penicillin. Cells were cultured at 37°C in a humidified atmosphere
containing 5% CO2.
siRNA transfection
RP5-899B16.2-specific siRNAs and non-silencing
negative control siRNA were purchased from Guangzhou RiboBio Co.,
Ltd. (Guangzhou, China; product ID siP01001). The target sequences
of RP5-899B16.2 were 5′-GGAUAGAUACAUUGACACUdTdT-3′ (siRNA-1) and
5′-GGAUAGAAUCAGGUUCCAUdTdT-3′ (siRNA-2). SGC-996 and GBC-SD cells
were transfected with Lipofectamine® 2000 reagent
(Invitrogen; Thermo Fisher Scientific, Inc.), according to the
manufacturer's protocol.
Cell viability
Transfected and non-transfected SGC-996 cells and
GBC-SD cells were seeded into 96-well plates at a concentration of
3×10³ cells/well and 2.5×10³ cells/well,
respectively. Between days 1 and 5, 10 µl MTT solution with solvent
PBS was added to each well of one plate, followed by incubation at
37°C for 4 h. The absorbance at 490 nm was measured using a
microplate reader. The assay was performed in triplicate.
Statistical analysis
All statistical analyses were performed using SPSS
software (version 18.0; SPSS, Inc., Chicago, IL, USA). For
comparison, a two-tailed Student's t-test was performed, when
appropriate. Data in Fig. 2 were
presented as log2-transformed median fold-changes in expression ±
standard error, and results in Fig. 5
were presented as the mean ± standard error of the mean. All
histograms were constructed using Prism for Windows (version 5.0;
GraphPad Software, Inc., La Jolla, CA, USA). P<0.05 was
considered to indicate a statistically significant difference.
Results
lncRNA and mRNA expression profiles in
GBC
To analyze the expression profiles of lncRNAs
between tumor tissue and PCT (para-carcinoma tissue), fold-changes
(tumor tissue vs. PCT), P-values and FDRs were used to assess the
normalized expression of genes. According to the microarray data,
<17,032 lncRNAs and <22,848 mRNAs expressed in the three
pairs of GBC and PCT were detected, which included 654 lncRNAs (229
upregulated and 425 downregulated) and 1,057 mRNAs (394 upregulated
and 663 downregulated) with markedly different expression. In
addition, 112 lncRNAs and 184 mRNAs were identified as consistently
upregulated in all three GBC groups, whereas 283 lncRNAs and 427
mRNAs were consistently downregulated. The 30 most marked
differentially expressed lncRNAs and mRNAs identified using
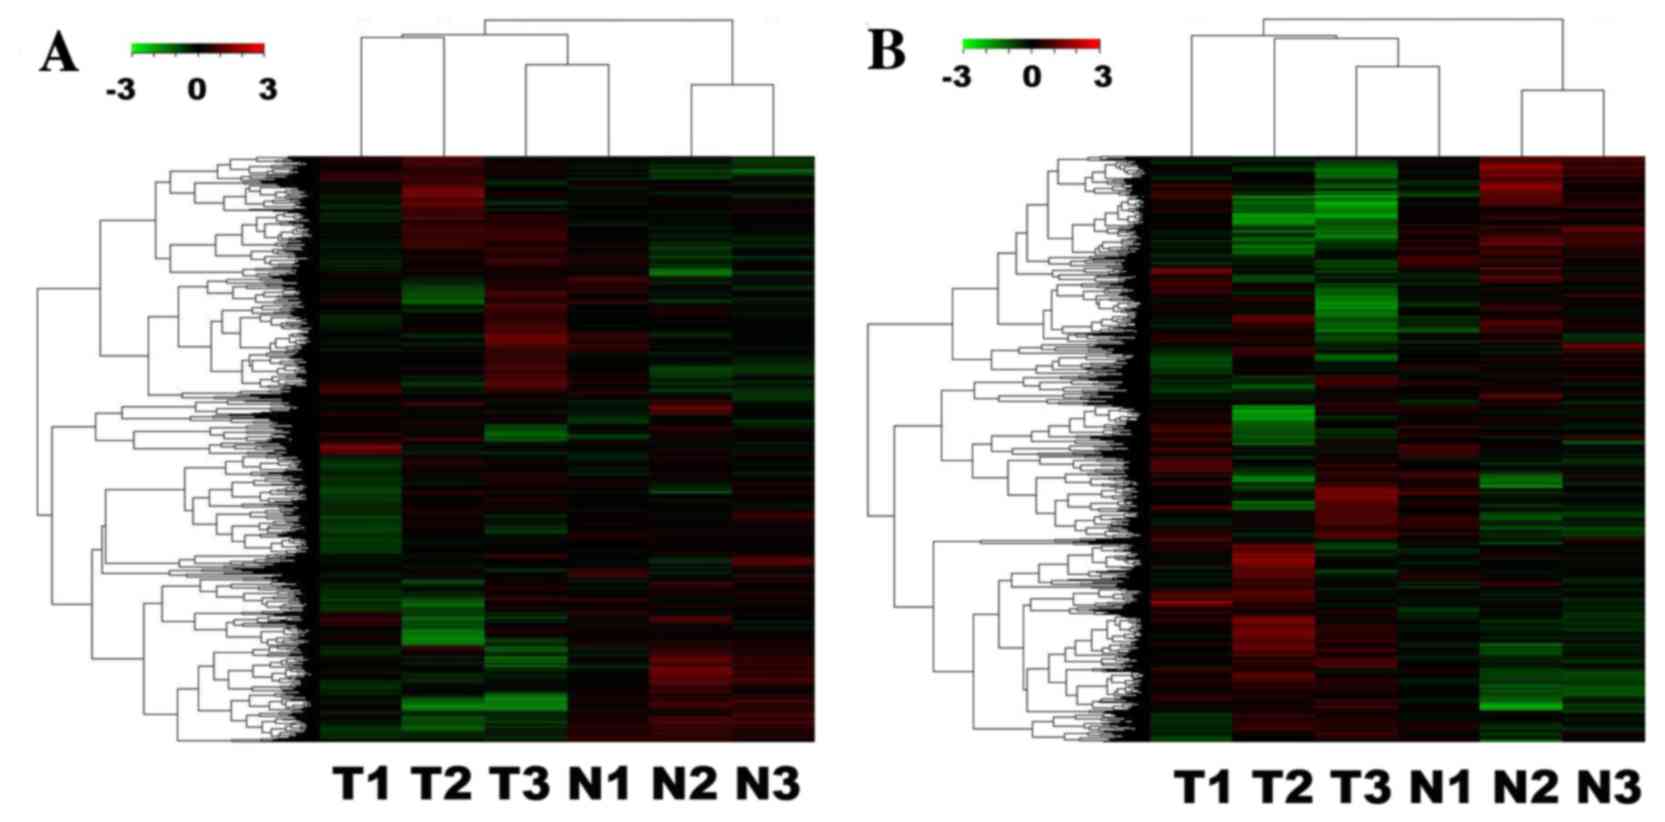
microarray analysis are presented in Tables III and IV. The hierarchical clustering analysis
dendrograms indicated that the samples exhibited associations among
the lncRNA and mRNA expression patterns (Fig. 1A and B). Among the aberrantly
expressed lncRNA transcripts, RP11-152P17.2-006 (log2
fold-change tumor/wild-type=10.57) was the most markedly
upregulated, whereas the expression of CTA-941F9.9 (log2
fold-change tumor/wild-type=−15.00) was the most markedly
downregulated. Subsequently, the results were compared with the
microarray data deposited in the GEO, which demonstrated that 1,212
lncRNAs and 1,213 mRNAs were aberrantly expressed between five
pairs of GBC and adjacent non-tumor samples (fold-change ≥1.25,
P<0.05 and FDR<0.05). Three pairs of analogous samples were
further analyzed, and 654 lncRNAs and 1,057 mRNAs aberrantly
expressed in three GBC tissues compared with the adjacent non-tumor
samples were identified (fold-change ≥2.0, P<0.05 and
FDR<0.05), which used a different fold-change threshold compared
with previous results. If the fold-change was defined to be ≥1.5,
the aberrant expression gene numbers were 1,565 lncRNAs and 2,321
mRNAs.
| Table III.Microarray analysis of the 30 most
aberrantly regulated lncRNAs in three pairs of gallbladder
carcinoma tissues. |
Table III.
Microarray analysis of the 30 most
aberrantly regulated lncRNAs in three pairs of gallbladder
carcinoma tissues.
| Probe name | lncRNA ID | Gene symbol | P-value | FC | Regulation | Chromosome |
|---|
| p11051 |
ENST00000422971.1 | CTA-941F9.9 | 0.017 | 15.00 | Down | 22(−):
46000311–46001501 |
| p7473 |
ENST00000591222.1 | NA | 0.014 | 13.99 | Down | 17(+):
66186024–66188943 |
| p3312 |
ENST00000551672.1 | NA | 0.021 | 13.56 | Down | 12(−):
80849274–80852604 |
| p13773 |
ENST00000514158.1 | CTC-454M9.1 | 0.009 | 13.45 | Down | 5(+):
88185276–88237187 |
| p14911 |
ENST00000449672.1 | AOAH-IT1 | 0.016 | 12.84 | Down | 7(−):
36637439–36639726 |
| p21662 | TCONS_00029197 | NA | 0.025 | 12.24 | Down | 21(+):
17979036–17979674 |
| p20932 | TCONS_00004443 | NA | 0.013 | 11.75 | Down | 2(−):
130324222–130351825 |
| p35139_v4 |
ENST00000515376.1 | NA | 0.023 | 11.23 | Down | 4(+):
174451610–174512475 |
| p35137_v4 |
ENST00000512246.1 | NA | 0.026 | 11.14 | Down | 4(+):
174451608–174462981 |
| p2150 |
ENST00000436715.1 | H19 | 0.019 | 11.02 | Down | 11(−):
2016668–2017801 |
| p1587 |
ENST00000454837.1 | ANTXRLP1 | 0.033 | 10.94 | Down | 10(−):
47620144–47640809 |
| p15883 |
ENST00000520594.1 | NA | 0.039 | 10.57 | Up | 8(−):
106797231–107072695 |
| p16513 |
ENST00000594708.1 | NA | 0.027 | 9.97 | Down | 9(−):
72808912–72873782 |
| p36138_v4 | TCONS_00010091 | NA | 0.025 | 9.44 | Down | 5(+):
130589969–130593098 |
| p43626_v4 | XR_430247.1 | NA | 0.040 | 9.30 | Down | 19(+):
42060081–42061684 |
| p22857 | TCONS_00009823 | NA | 0.042 | 9.29 | Down | 5(−):
178365677–178368084 |
| p43270_v4 | XR_429785.1 | NA | 0.000 | 9.12 | Down | 16(+):
85196766–85199924 |
| p15702 |
ENST00000523786.1 | NA | 0.002 | 8.87 | Down | 8(−):
57432677–57472056 |
| p15932 |
ENST00000517869.1 | NA | 0.033 | 8.87 | Down | 8(−):
126934766–126963394 |
| p7444 |
ENST00000580515.1 | BZRAP1-AS1 | 0.026 | 8.87 | Down | 17(+):
56406298–56429790 |
| p35142_v4 |
ENST00000515345.1 | NA | 0.029 | 8.51 | Down | 4(+):
174451624–174458566 |
| p33555 |
ENST00000460744.1 | NA | 0.022 | 8.06 | Down | 3(+):
111011565–111261149 |
|
RNA33675|snoRNA_scaRNA_271_77 | RNA33675|
snoRNA_scaRNA_271_77 | NA | 0.012 | 7.72 | Down | NA |
| p38655_v4 |
ENST00000458974.1 | NA | 0.024 | 7.63 | Down | 14(+):
101364256–101364333 |
| p12993 |
ENST00000509866.1 | NA | 0.036 | 7.62 | Down | 4(+):
174451612–174458842 |
| p13228 |
ENST00000503568.1 | NA | 0.004 | 7.61 | Down | 5(−):
74343543–74348468 |
| p34010_v4 |
ENST00000415582.1 | NA | 0.048 | 7.55 | Up | 1(−):
201969228–201970411 |
|
RNA143553|tRNA_470_66 |
RNA143553|tRNA_470_66 | NA | 0.018 | 7.45 | Down | NA |
| p4096 |
ENST00000436329.1 | GPC6-AS1 | 0.020 | 7.44 | Down | 13(−):
94806446–94840245 |
| p40958_v4 | XR_427898.1 | NA | 0.028 | 7.43 | Down | 6(−):
25015198–25036372 |
| Table IV.Microarray analysis of the 30 most
aberrantly regulated mRNAs in three pairs of gallbladder carcinoma
tissues. |
Table IV.
Microarray analysis of the 30 most
aberrantly regulated mRNAs in three pairs of gallbladder carcinoma
tissues.
| Probe name | Ensembl ID | Gene symbol | P-value | FC | Regulation | Chromosome |
|---|
| A_23_P390700 |
ENST00000550305 | CNTN1 | 0.037 | 21.52 | Down | 12:
41414156–41414215 |
| A_23_P134347 |
ENST00000542995 | CPVL | 0.003 | 18.15 | Down | 7:
29105730–29105671 |
| A_33_P3265749 |
ENST00000370934 | PTGER3 | 0.020 | 14.64 | Down | 1:
71478048–71477989 |
| A_23_P168993 |
ENST00000345060 | ADRB3 | 0.049 | 13.94 | Down | 8:
37821117–37821058 |
| A_23_P150457 |
ENST00000438354 | LYVE1 | 0.028 | 12.52 | Down | 11:
10580104–10580045 |
| A_24_P236935 |
ENST00000424910 | KLK6 | 0.006 | 12.00 | Up | 19:
51466784–51466725 |
| A_33_P3397865 |
ENST00000291901 | TNNT1 | 0.019 | 11.51 | Up | 19:
55644255–55644196 |
| A_33_P3290239 | NA | DUOXA1 | 0.017 | 11.51 | Up | 15:
45411363–45411304 |
| A_33_P3275801 |
ENST00000373960 | DES | 0.031 | 11.51 | Down | 2:
220291400–220291459 |
| A_24_P261760 |
ENST00000356986 | KLRG1 | 0.007 | 11.49 | Down | 12:
9147774–9147833 |
| A_33_P3254844 |
ENST00000401731 | CEACAM7 | 0.005 | 11.48 | Up | 19:
42178513–42178454 |
| A_33_P3256997 |
ENST00000398984 | NA | 0.029 | 11.05 | Down | 11:
59980755–59980696 |
| A_33_P3265739 |
ENST00000306666 | PTGER3 | 0.021 | 10.98 | Down | 1:
71436629–71436570 |
| A_33_P3248405 |
ENST00000536164 | NRK | 0.038 | 10.96 | Down | X:
105139249–105139308 |
| A_23_P145718 |
ENST00000483864 | AOAH | 0.017 | 10.92 | Down | 7:
36570069–36561708 |
| A_33_P3294533 |
ENST00000321728 | PRKCB | 0.040 | 10.62 | Down | 16:
24231495–24231554 |
| A_23_P339588 |
ENST00000338313 | TAGAP | 0.011 | 10.37 | Down | 6:
159460015–159459956 |
| A_24_P40626 |
ENST00000318160 | GREM2 | 0.013 | 10.08 | Down | 1:
240654036–240653977 |
| A_21_P0010449 |
ENST00000422971 | XLOC_014399 | 0.012 | 10.05 | Down | 22:
46000392–46000333 |
| A_33_P3406196 |
ENST00000344825 | KLRD1 | 0.036 | 9.97 | Down | 12:
10462019–10462078 |
| A_24_P156490 |
ENST00000286627 | KCNMA1 | 0.006 | 9.84 | Down | 10:
78644826–78644767 |
| A_33_P3225760 |
ENST00000412923 | PCDH18 | 0.014 | 9.29 | Down | 4:
138453085–138453026 |
| A_33_P3220015 |
ENST00000390341 | NA | 0.028 | 9.25 | Down | 7:
38339480–38339421 |
| A_23_P64898 |
ENST00000538029 | KLRG1 | 0.047 | 9.24 | Down | 12:
9162594–9162653 |
| A_21_P0005574 | NA | XLOC_006224 | 0.028 | 9.12 | Down | 7:
123284900–123284959 |
| A_33_P3240512 |
ENST00000377474 | KCTD12 | 0.043 | 8.94 | Down | 13:
77454410–77454351 |
| A_33_P3249872 |
ENST00000262722 | FBLN1 | 0.031 | 8.54 | Down | 22:
45959173–45959232 |
| A_23_P145606 |
ENST00000320658 | CHRM2 | 0.041 | 8.51 | Down | 7:
136700790–136700849 |
| A_33_P3257027 |
ENST00000377614 | FGF7 | 0.025 | 8.51 | Down | 15:
49776810–49776869 |
| A_23_P342641 |
ENST00000536707 | SLC44A5 | 0.021 | 8.42 | Up | 1:
75679412–75677201 |
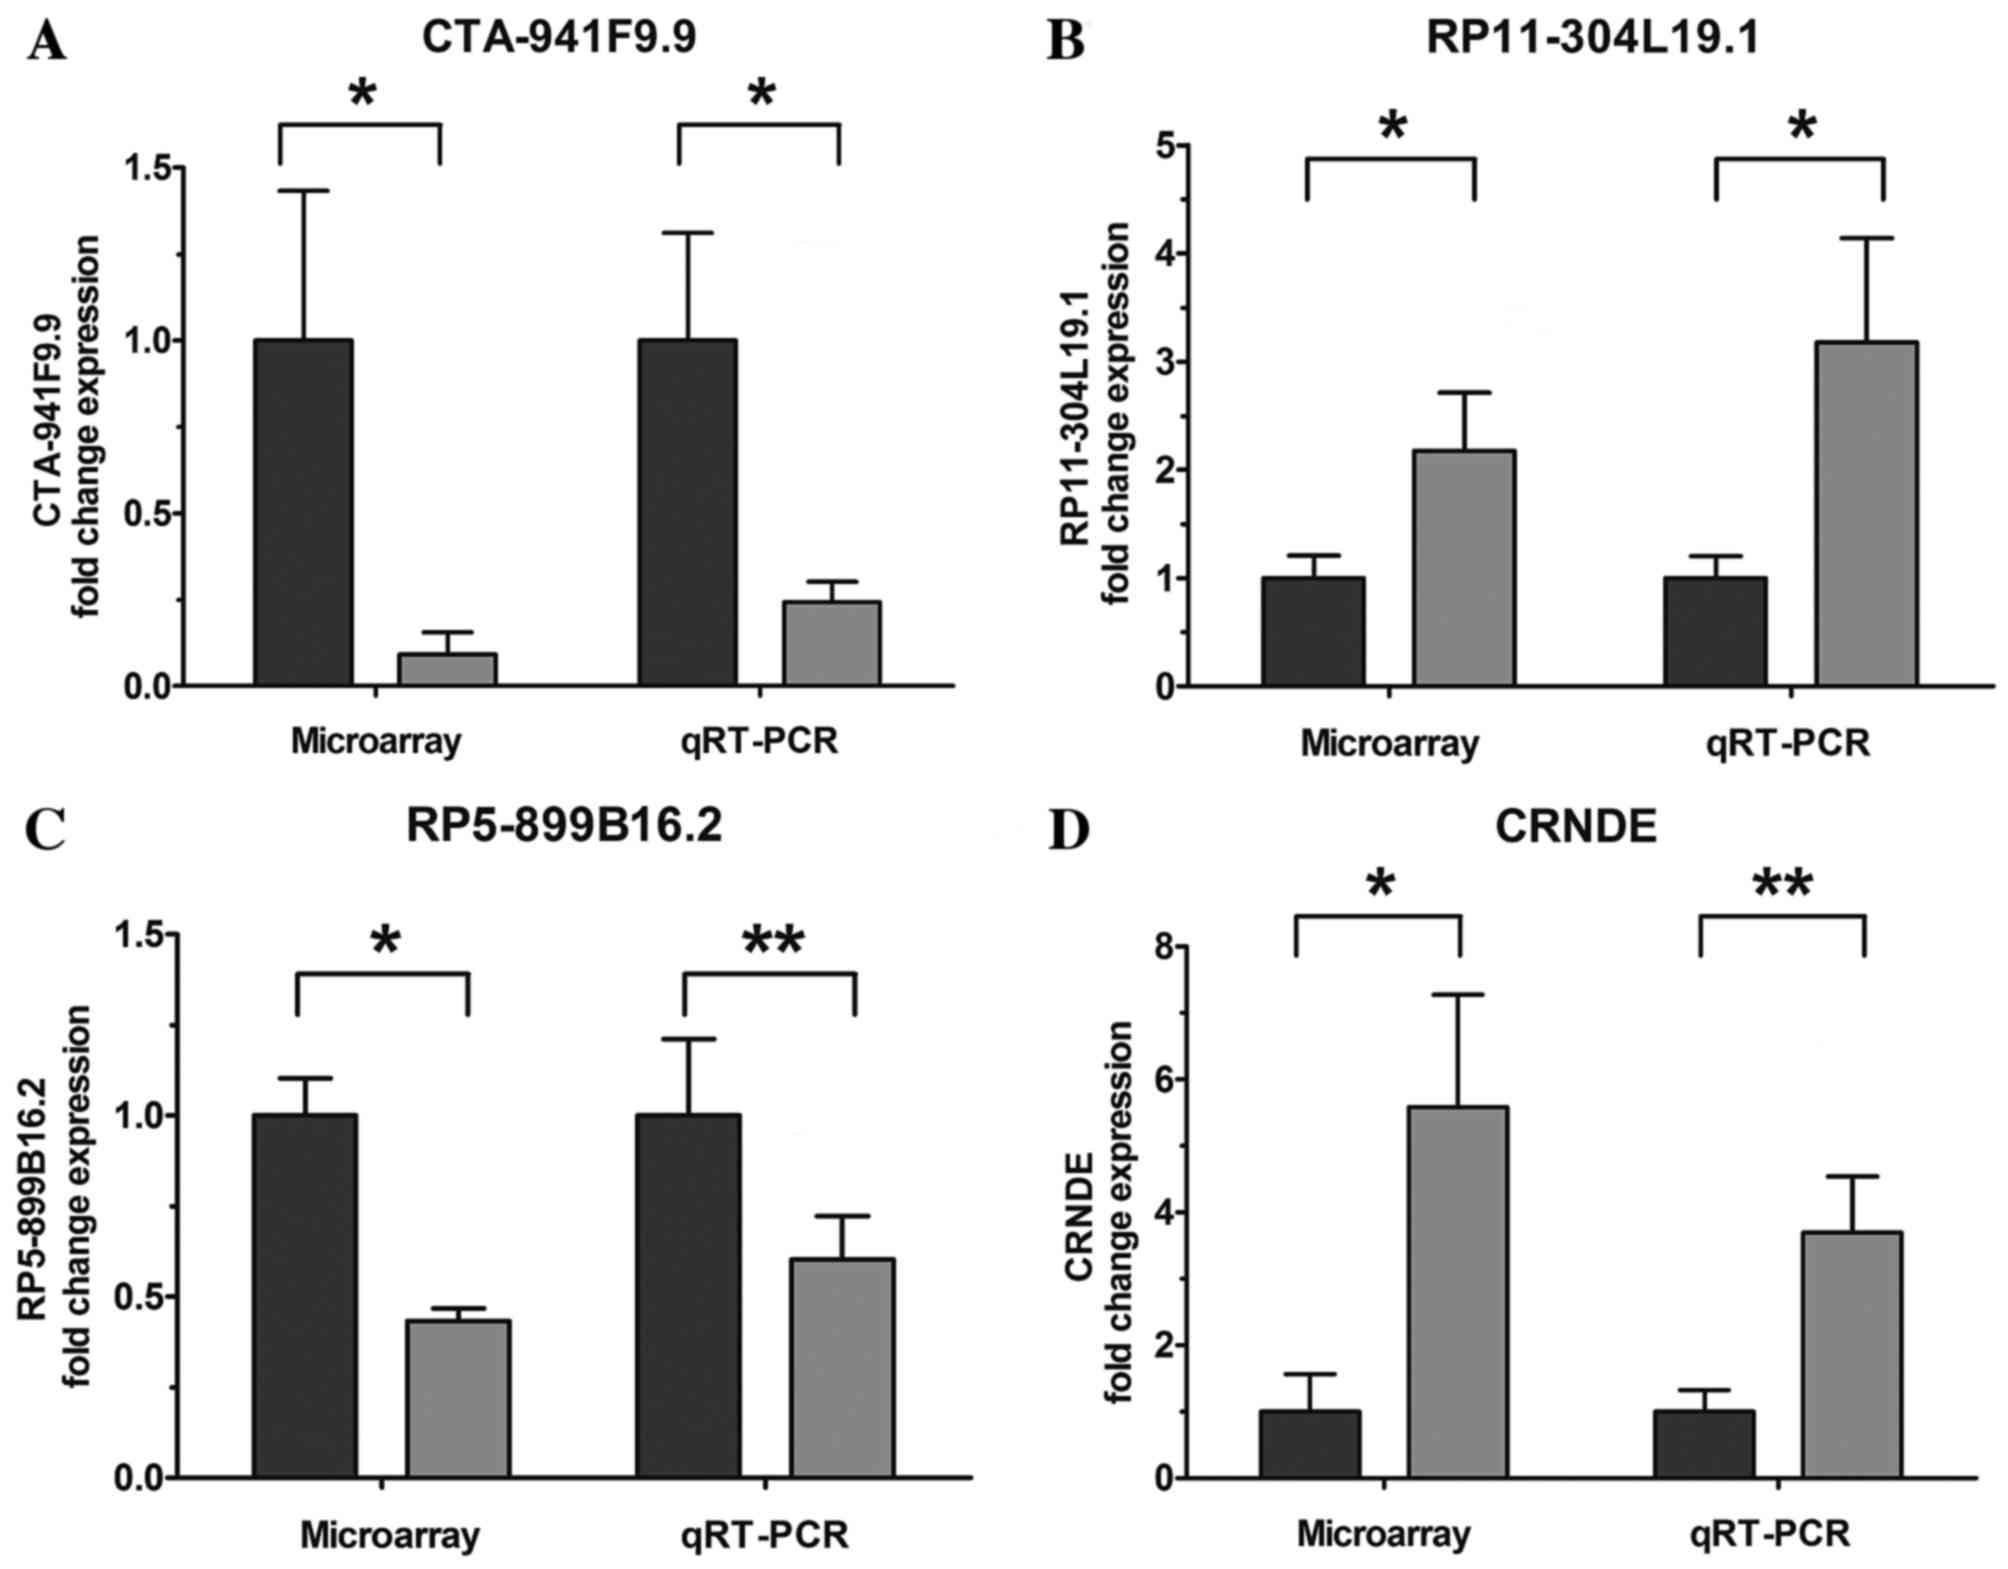
Validation of the microarray data
using RT-qPCR
To validate the microarray analysis results, four
upregulated/downregulated lncRNAs were randomly selected for
validation using RT-qPCR. The results demonstrated that lncRNAs
RP11-304L19.1 and colorectal neoplasia differentially expressed
(CRNDE) were upregulated and CTA-941F9.9 and RP5-899B16.2 were
downregulated in the tumor samples compared with PCT samples
(Fig. 2). These RT-qPCR results were
consistent with the microarray data.
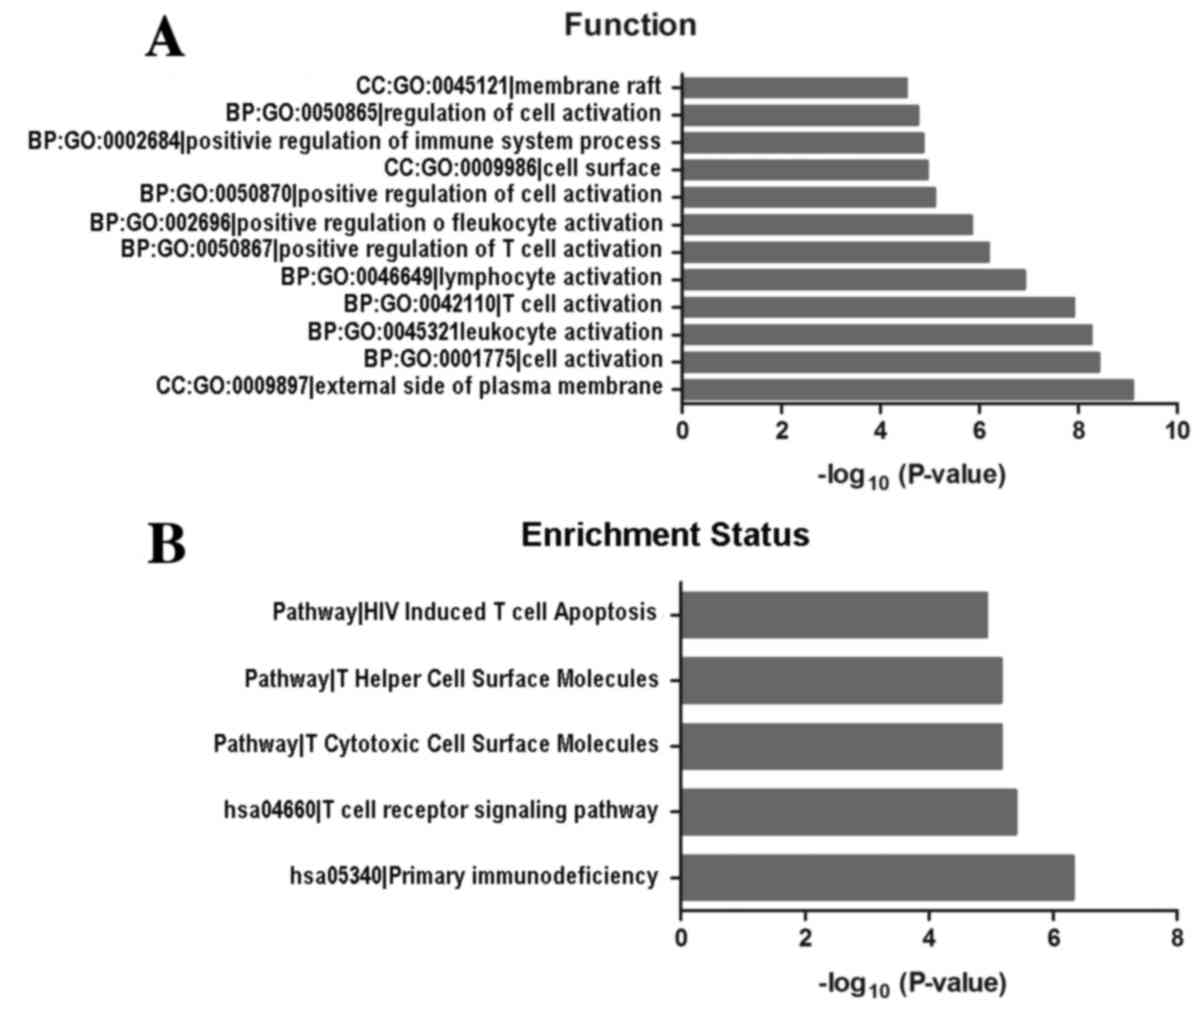
GO and KEGG pathway analyses
To investigate potential gene and gene product
enrichment in biological processes, cellular components and
molecular functions, GO analysis was performed with the
differentially expressed mRNAs. An FDR ≤0.05 (Bonferroni
correction) was used to determine significant changes in the
differentially expressed gene list and the GO annotation list. The
results suggested that a number of functional signaling pathways
were enriched, including those involved in the regulation of cell
activation, external side of the plasma membrane, membrane rafts
and regulation of immune system processes. In addition, the cell
surfaces exhibited the most increased enrichment of GO terms within
GBC (Fig. 3A). Pathway analyses
indicated that five pathways corresponded to differentially
expressed transcripts and were the human immunodeficiency
virus-induced T cell apoptosis, T cytotoxic cell-surface molecules,
T helper cell-surface molecules, primary immunodeficiency and the T
cell receptor signaling pathways (Fig.
3B).
Construction of a co-expression
network
To explore the association between lncRNAs
differentially expressed in GBC and targeted mRNAs, a co-expression
network was constructed. Using PCC ≥0.99 and P<0.0001, 5,679
pairs of co-expressed lncRNAs and mRNAs composed of 922 mRNAs
(87.2% of all differentially expressed mRNAs) and 602 lncRNAs
(92.0% of all differentially expressed lncRNAs) were identified,
and 3,366 pairs demonstrated a positive association (Fig. 4). The results suggested that the
lncRNA-mRNA pairs exhibiting the most marked positive correlation
coefficiency included XR_429508.1 and CD3γ. ENST00000451584.1 and
transcription factor activator protein 2Aα exhibited the most
marked negative correlation coefficiency. This co-expression
network indicated that 1 lncRNA may target ≤29 coding genes and
that one coding gene may associate with ≤3 lncRNAs. For example,
this network indicated that CRNDE was associated with cell division
cycle-associated 7-like (CDCA7L) and solute carrier 44A5
(SLC44A5).
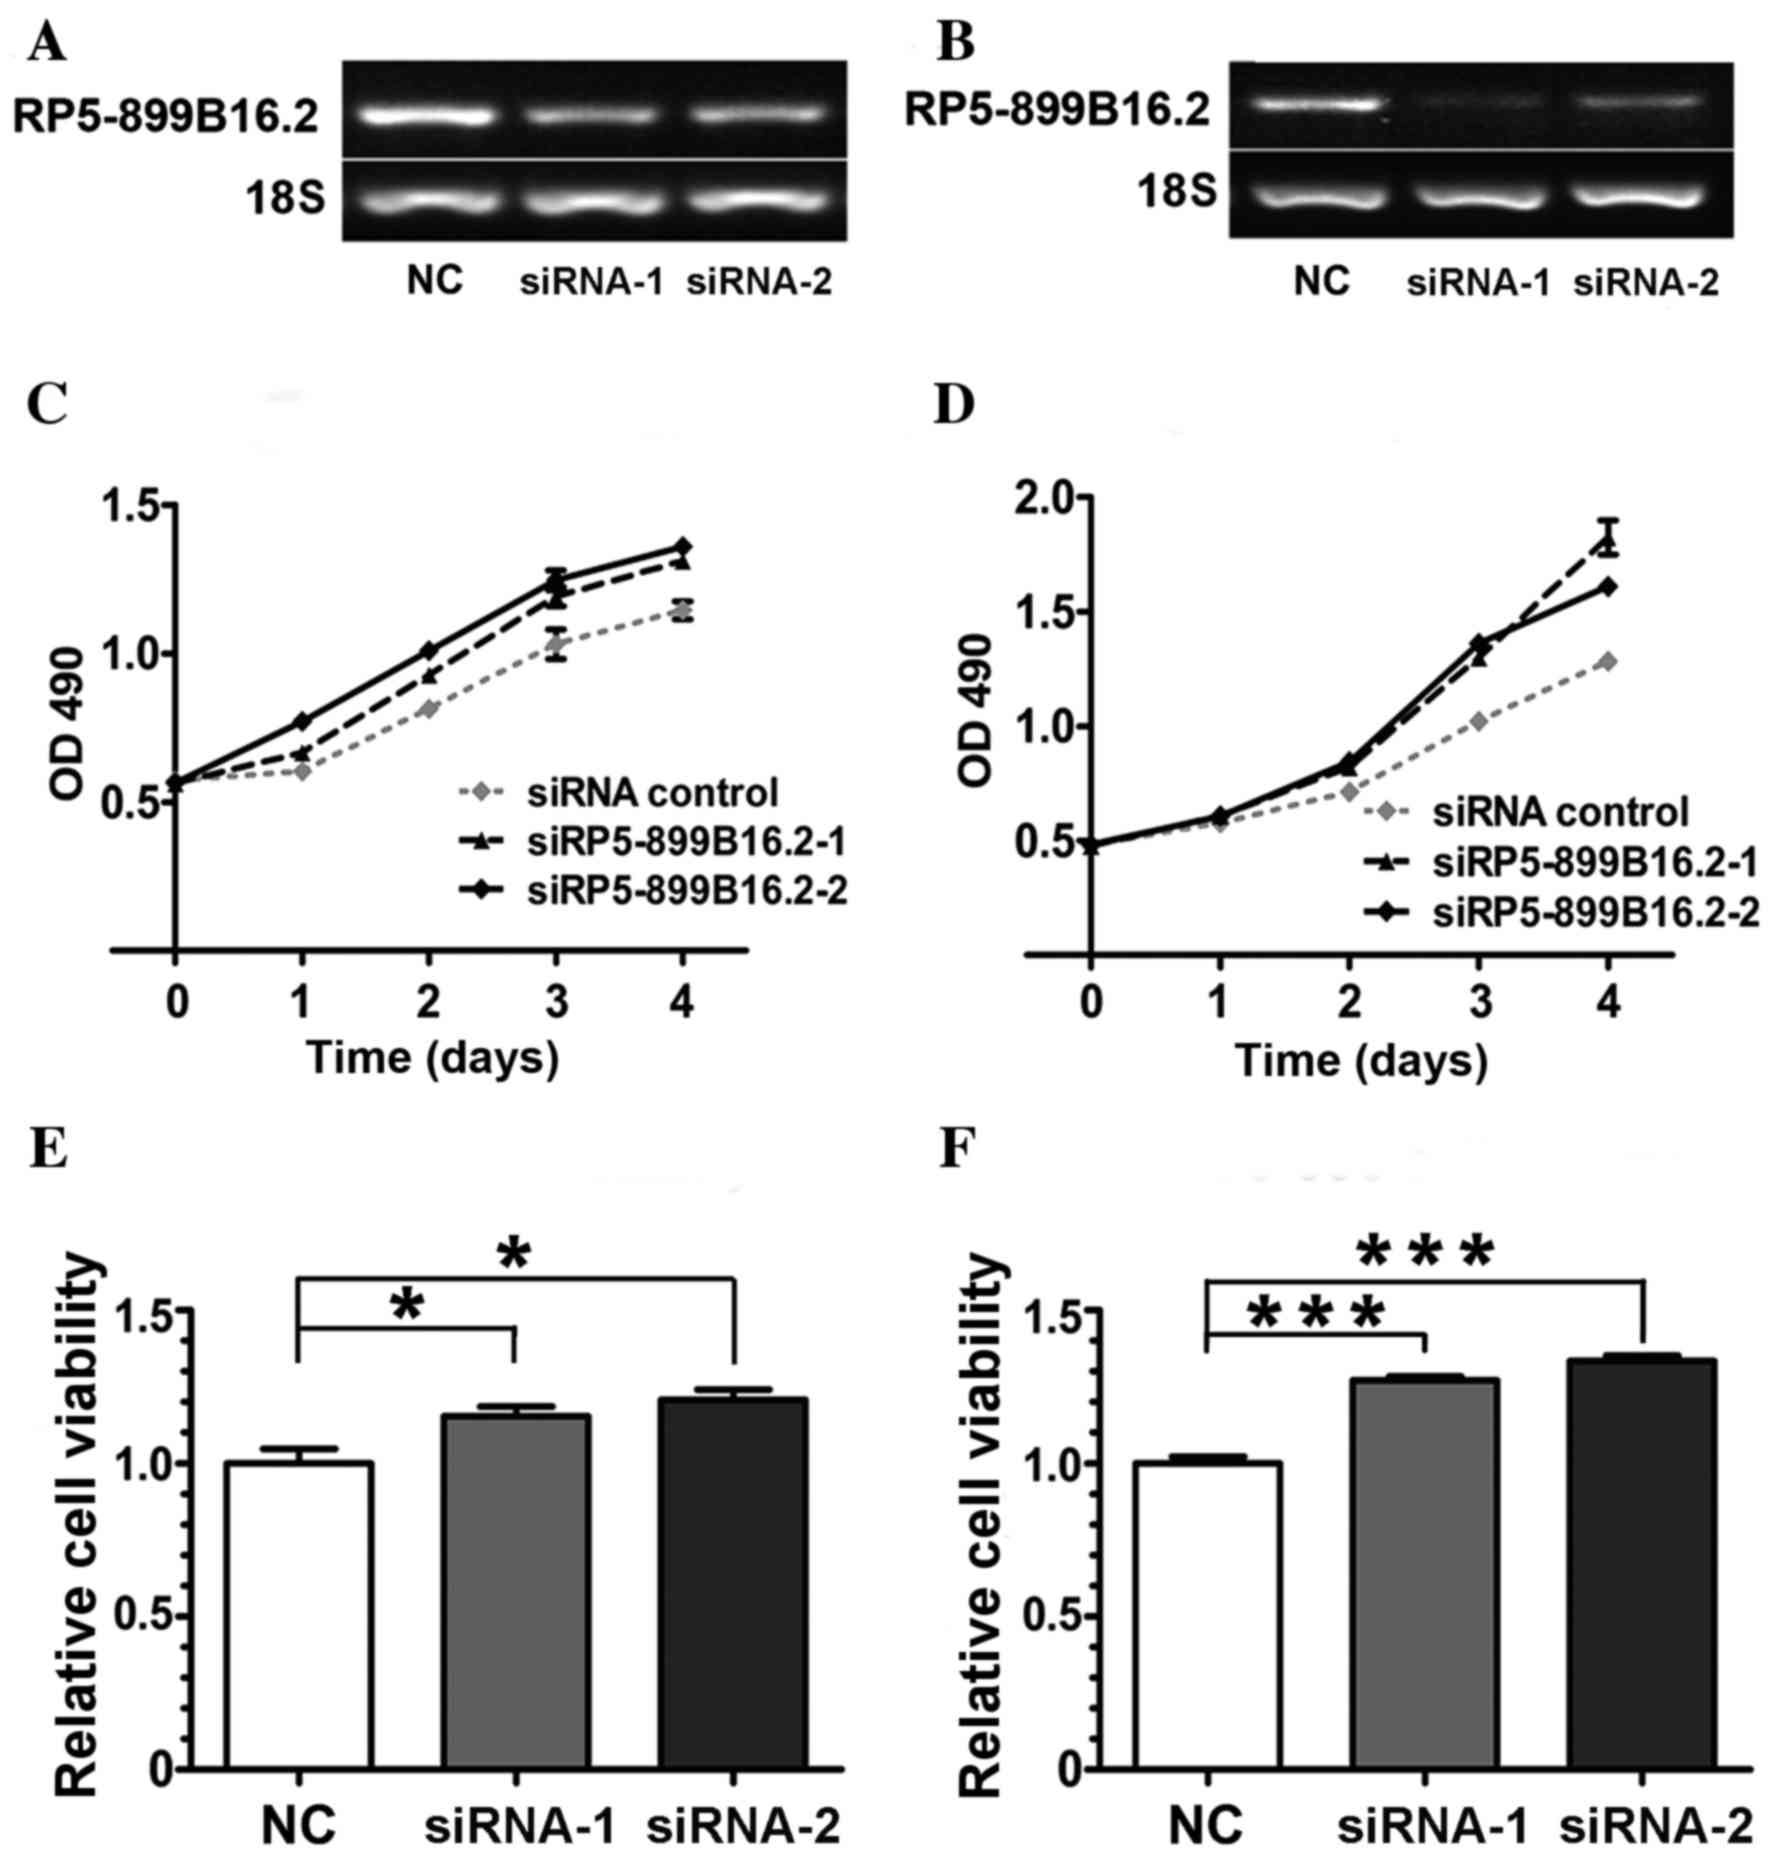
Silencing of RP5-899B16.2 increased
GBC cell viability
To further confirm the functional relevance of
lncRNA expression, SGC-996 and GBC-SD cell lines were transfected
with RP5-899B16.2-specific siRNAs and non-silencing negative
control siRNA. The RT-qPCR results indicated that RP5-899B16.2
expression was markedly downregulated at the mRNA level in the two
transfected cells compared with the control (Fig. 5A and B).
The frequent dysregulation of RP5-899B16.2 in GBC
tissues and cell lines suggested that this gene may serve an
important role in GBC. To investigate the effects of STMN1
deficiency, an MTT assay was performed and cell viability curves
were constructed. It was demonstrated that the viability of the GBC
cell lines increased markedly following the silencing of
RP5-899B16.2 (Fig. 5C-F).
Discussion
The carcinogenesis of GBC is a complex process
(1). Despite advances in research in
recent decades, its pathogenesis remains unclear, and further
studies are required. The association between lncRNAs and tumors
has been frequently investigated: Previous studies have indicated
that lncRNAs serve important roles in regulating gene expression
and are associated with cancer development (29,30),
including HOTAIR in breast cancer (22), digestive system cancer (31) and urothelial cancer (32). The maternally expressed gene 3 was
downregulated in several cancers and was demonstrated to inhibit
tumor growth (33,34). CRNDE was upregulated in colorectal
adenoma, adenocarcinoma and glioma (35,36). The
majority of the aforementioned lncRNAs were also identified in the
present study. However, studies on the association of lncRNA
expression with GBC are limited (23–26).
Therefore, it is important to understand the association between
lncRNA expression and GBC to identify its pathogenesis. These
results suggested that lncRNAs are potential targets for novel
therapies.
In the present study, lncRNA and mRNA expression
profiles in GBC were investigated using microarray chips. The
results demonstrated that >100 lncRNA expression levels were
changed compared with matched adjacent non-cancerous tissues.
Currently, to the best of our knowledge, there are no studies on
lncRNA expression profiles in GBC. The discrepancy between the data
of the present study and GEO data may be due to differences in
tumor tissues. Furthermore, the platform that was used was the
Human lncRNA array V4.0 (4×180K), whereas the platform for the GEO
data was the Affymetrix Human Gene 2.0 ST Array. The difference
between the two platforms in array content, gene coverage
availability, specific exon or splice junction probes, labeling
systems and systematic lncRNA classification may lead to the
difference in results. Therefore, novel lncRNAs were identified
outside the scope of the GEO data. This avoided the elimination of
lncRNAs that serve important roles in GBC.
In the previous decade, studies have suggested that
a number of lncRNAs contribute to important functions, including
the regulation of gene expression, serve an important role in cell
development and metabolism, and are aberrant in a variety of
diseases (13,37). To elucidate the underlying molecular
mechanisms of lncRNA function, a co-expression network was further
constructed by combining aberrantly expressed lncRNAs and mRNAs.
Multiple lncRNAs were demonstrated to be markedly associated with
mRNAs. CRNDE is an intergenic lncRNA located on chromosome 16,
which is also overexpressed in colorectal carcinomas, gliomas and
leukemias (35,38). CDCA7L is a target gene for cellular
Myc proto-oncogene protein (c-Myc) that is involved in cell
proliferative and apoptotic signaling pathways (39). However, SLC44A5 codes for a choline
transporter-like protein that is associated with cell
proliferation. Therefore, it was hypothesized that CRNDE may be a
direct or indirect target gene of CDCA7L and SLC44A5. This lncRNA
and mRNA co-expression network provides a strong foundation for
predicting the function of lncRNAs. The malfunction of regulating
this co-expression network may be an important step for the
development and progression of GBC. The underlying molecular
mechanisms of GBC progression remain unclear. Furthermore, GO
analysis and pathway analysis were used to investigate the
biological functions of lncRNA in the occurrence and development of
GBC. More research is required to elucidate the functions of
lncRNAs.
In conclusion, the expression profiles of lncRNAs
and mRNAs in GBC with microarray analyses were determined, and 654
lncRNAs and 1,057 mRNAs were identified; the majority of which were
novel identifications in GBC. Additionally, an lncRNA-mRNA
co-expression network was constructed and it was demonstrated that
CRNDE was associated with the c-Myc protein CDCA7L. lncRNAs may
function by interacting with mRNAs or proteins in GBC. Accurate
signaling pathways warrant further study and are critical for
identifying novel methods for the early diagnosis and treatment of
GBC. Further functional studies may provide potential therapeutic
targets or molecular biomarkers of GBC. The results of the present
study suggest useful evidence for investigating potential
therapeutic targets for GBC.
Acknowledgements
The Microarray data are publicly accessible via the
Gene Expression Omnibus, no. GSE74048. The present study was
supported by the National Natural Science Foundation of China
(grant no. 81272728).
Glossary
Abbreviations
Abbreviations:
|
GBC
|
gallbladder carcinoma
|
|
lncRNA
|
long non-coding RNA
|
|
RT-qPCR
|
reverse transcription-quantitative
polymerase chain reaction
|
|
GO
|
Gene Ontology
|
|
KEGG
|
Kyoto Encyclopedia of Genes and
Genomes
|
|
PCT
|
para-carcinoma tissue
|
References
|
1
|
Zhu AX, Hong TS, Hezel AF and Kooby DA:
Current management of gallbladder carcinoma. Oncologist.
15:168–181. 2010. View Article : Google Scholar : PubMed/NCBI
|
|
2
|
Miller G and Jarnagin WR: Gallbladder
carcinoma. Eur J Surg Oncol. 34:306–312. 2008. View Article : Google Scholar : PubMed/NCBI
|
|
3
|
Randi G, Franceschi S and La Vecchia C:
Gallbladder cancer worldwide: Geographical distribution and risk
factors. Int J Cancer. 118:1591–1602. 2006. View Article : Google Scholar : PubMed/NCBI
|
|
4
|
Misra S, Chaturvedi A, Misra NC and Sharma
ID: Carcinoma of the gallbladder. Lancet Oncol. 4:167–176. 2003.
View Article : Google Scholar : PubMed/NCBI
|
|
5
|
Yamaguchi K, Chijiiwa K, Saiki S,
Nishihara K, Takashima M, Kawakami K and Tanaka M: Retrospective
analysis of 70 operations for gallbladder carcinoma. Br J Surg.
84:200–204. 1997. View Article : Google Scholar : PubMed/NCBI
|
|
6
|
Grobmyer SR, Lieberman MD and Daly JM:
Gallbladder cancer in the twentieth century: Single institution's
experience. World J Surg. 28:47–49. 2004. View Article : Google Scholar : PubMed/NCBI
|
|
7
|
Wu XS, Shi LB, Li ML, Ding Q, Weng H, Wu
WG, Cao Y, Bao RF, Shu YJ, Ding QC, et al: Evaluation of two
inflammation-based prognostic scores in patients with resectable
gallbladder carcinoma. Ann Surg Oncol. 21:449–457. 2014. View Article : Google Scholar : PubMed/NCBI
|
|
8
|
Bartlett DL, Fong Y, Fortner JG, Brennan
MF and Blumgart LH: Long-term results after resection for
gallbladder cancer. Implications for staging and management. Ann
Surg. 224:639–646. 1996. View Article : Google Scholar : PubMed/NCBI
|
|
9
|
Butte JM, Matsuo K, Gönen M, D'Angelica
MI, Waugh E, Allen PJ, Fong Y, DeMatteo RP, Blumgart L, Endo I, et
al: Gallbladder cancer: Differences in presentation, surgical
treatment, and survival in patients treated at centers in three
countries. J Am Coll Surg. 212:50–61. 2011. View Article : Google Scholar : PubMed/NCBI
|
|
10
|
Cziupka K, Partecke LI, Mirow L, Heidecke
CD, Emde C, Hoffmann W, Siewert U, van den Berg N, von Bernstorff W
and Stier A: Outcomes and prognostic factors in gallbladder cancer:
A single-centre experience. Langenbecks Arch Surg. 397:899–907.
2012. View Article : Google Scholar : PubMed/NCBI
|
|
11
|
Ooi A, Suzuki S, Nakazawa K, Itakura J,
Imoto I, Nakamura H and Dobashi Y: Gene amplification of Myc and
its coamplification with ERBB2 and EGFR in gallbladder
adenocarcinoma. Anticancer Res. 29:19–26. 2009.PubMed/NCBI
|
|
12
|
Nagahashi M, Ajioka Y, Lang I, Szentirmay
Z, Kasler M, Nakadaira H, Yokoyama N, Watanabe G, Nishikura K,
Wakai T, et al: Genetic changes of p53, K-ras, and microsatellite
instability in gallbladder carcinoma in high-incidence areas of
Japan and Hungary. World J Gastroenterol. 14:70–75. 2008.
View Article : Google Scholar : PubMed/NCBI
|
|
13
|
Ponting CP, Oliver PL and Reik W:
Evolution and functions of long noncoding RNAs. Cell. 136:629–641.
2009. View Article : Google Scholar : PubMed/NCBI
|
|
14
|
An integrated encyclopedia of DNA elements
in the human genome. Nature. 489:57–74. 2012. View Article : Google Scholar : PubMed/NCBI
|
|
15
|
Nagano T and Fraser P: No-nonsense
functions for long noncoding RNAs. Cell. 145:178–181. 2011.
View Article : Google Scholar : PubMed/NCBI
|
|
16
|
Prensner JR and Chinnaiyan AM: The
emergence of lncRNAs in cancer biology. Cancer Discov. 1:391–407.
2011. View Article : Google Scholar : PubMed/NCBI
|
|
17
|
Faghihi MA, Modarresi F, Khalil AM, Wood
DE, Sahagan BG, Morgan TE, Finch CE, St Laurent G III, Kenny PJ,
Wahlestedt C, et al: Expression of a noncoding RNA is elevated in
Alzheimer's disease and drives rapid feed-forward regulation of
beta-secretase. Nat Med. 14:723–730. 2008. View Article : Google Scholar : PubMed/NCBI
|
|
18
|
Johnson R: Long non-coding RNAs in
Huntington's disease neurodegeneration. Neurobiol Dis. 46:245–254.
2012. View Article : Google Scholar : PubMed/NCBI
|
|
19
|
Zhang J, Zhang P, Wang L, Piao HL and Ma
L: Long non-coding RNA HOTAIR in carcinogenesis and metastasis.
Acta Biochim Biophys Sin (Shanghai). 46:1–5. 2014. View Article : Google Scholar : PubMed/NCBI
|
|
20
|
Vikram R, Ramachandran R and Abdul KS:
Functional significance of long non-coding RNAs in breast cancer.
Breast Cancer. 21:515–521. 2014. View Article : Google Scholar : PubMed/NCBI
|
|
21
|
Tu ZQ, Li RJ, Mei JZ and Li XH:
Down-regulation of long non-coding RNA GAS5 is associated with the
prognosis of hepatocellular carcinoma. Int J Clin Exp Pathol.
7:4303–4309. 2014.PubMed/NCBI
|
|
22
|
Gupta RA, Shah N, Wang KC, Kim J, Horlings
HM, Wong DJ, Tsai MC, Hung T, Argani P, Rinn JL, et al: Long
non-coding RNA HOTAIR reprograms chromatin state to promote cancer
metastasis. Nature. 464:1071–1076. 2010. View Article : Google Scholar : PubMed/NCBI
|
|
23
|
Wu XS, Wang XA, Wu WG, Hu YP, Li ML, Ding
Q, Weng H, Shu YJ, Liu TY, Jiang L, et al: MALAT1 promotes the
proliferation and metastasis of gallbladder cancer cells by
activating the ERK/MAPK pathway. Cancer Biol Ther. 15:806–814.
2014. View Article : Google Scholar : PubMed/NCBI
|
|
24
|
Ma M, Kong X, Weng M, Zhang MD, Qin YY,
Gong W, Zhang WJ and Quan ZW: Long non-coding RNA-LET is a positive
prognostic factor and exhibits tumor-suppressive activity in
gallbladder cancer. Mol Carcinogen. 54:1397–1406. 2015. View Article : Google Scholar
|
|
25
|
Ma MZ, Li CX, Zhang Y, Weng MZ, Zhang MD,
Qin YY, Gong W and Quan ZW: Long non-coding RNA HOTAIR, a c-Myc
activated driver of malignancy, negatively regulates miRNA-130a in
gallbladder cancer. Mol Cancer. 13:1562014. View Article : Google Scholar : PubMed/NCBI
|
|
26
|
Ma MZ, Chu BF, Zhang Y, Weng MZ, Qin YY,
Gong W and Quan ZW: Long non-coding RNA CCAT1 promotes gallbladder
cancer development via negative modulation of miRNA-218-5p. Cell
Death Dis. 6:e15832015. View Article : Google Scholar : PubMed/NCBI
|
|
27
|
Livak KJ and Schmittgen TD: Analysis of
relative gene expression data using real-time quantitative PCR and
the 2(−Delta DeltaC(T)) method. Methods. 25:402–408. 2001.
View Article : Google Scholar : PubMed/NCBI
|
|
28
|
Patterson TA, Lobenhofer EK,
Fulmer-Smentek SB, Collins PJ, Chu TM, Bao W, Fang H, Kawasaki ES,
Hager J, Tikhonova IR, et al: Performance comparison of one-color
and two-color platforms within the MicroArray Quality Control
(MAQC) project. Nat Biotechnol. 24:1140–1150. 2006. View Article : Google Scholar : PubMed/NCBI
|
|
29
|
Khachane AN and Harrison PM: Mining
mammalian transcript data for functional long non-coding RNAs. PLoS
One. 5:e103162010. View Article : Google Scholar : PubMed/NCBI
|
|
30
|
Pan YF, Feng L, Zhang XQ, Song LJ, Liang
HX, Li ZQ and Tao FB: Role of long non-coding RNAs in gene
regulation and oncogenesis. Chin Med J (Engl). 124:2378–2383.
2011.PubMed/NCBI
|
|
31
|
Cheng Y, Jutooru I, Chadalapaka G, Corton
JC and Safe S: The long non-coding RNA HOTTIP enhances pancreatic
cancer cell proliferation, survival and migration. Oncotarget.
6:10840–10852. 2015. View Article : Google Scholar : PubMed/NCBI
|
|
32
|
Heubach J, Monsior J, Deenen R, Niegisch
G, Szarvas T, Niedworok C, Schulz WA and Hoffmann MJ: The long
noncoding RNA HOTAIR has tissue and cell type-dependent effects on
HOX gene expression and phenotype of urothelial cancer cells. Mol
Cancer. 14:1082015. View Article : Google Scholar : PubMed/NCBI
|
|
33
|
Zhang X, Zhou Y, Mehta KR, Danila DC,
Scolavino S, Johnson SR and Klibanski A: A pituitary-derived MEG3
isoform functions as a growth suppressor in tumor cells. J Clin
Endocrinol Metab. 88:5119–5126. 2003. View Article : Google Scholar : PubMed/NCBI
|
|
34
|
Gibb EA, Brown CJ and Lam WL: The
functional role of long non-coding RNA in human carcinomas. Mol
Cancer. 10:382011. View Article : Google Scholar : PubMed/NCBI
|
|
35
|
Graham LD, Pedersen SK, Brown GS, Ho T,
Kassir Z, Moynihan AT, Vizgoft EK, Dunne R, Pimlott L, Young GP, et
al: Colorectal neoplasia differentially expressed (CRNDE), a novel
gene with elevated expression in colorectal adenomas and
adenocarcinomas. Genes Cancer. 2:829–840. 2011. View Article : Google Scholar : PubMed/NCBI
|
|
36
|
Ellis BC, Molloy PL and Graham LD: CRNDE:
A long non-coding RNA involved in CanceR, neurobiology and
DEvelopment. Front Genet. 3:2702012. View Article : Google Scholar : PubMed/NCBI
|
|
37
|
Taft RJ, Pang KC, Mercer TR, Dinger M and
Mattick JS: Non-coding RNAs: Regulators of disease. J Pathol.
220:126–139. 2010. View Article : Google Scholar : PubMed/NCBI
|
|
38
|
Zhang X, Sun S, Pu JK, Tsang AC, Lee D,
Man VO, Lui WM, Wong ST and Leung GK: Long non-coding RNA
expression profiles predict clinical phenotypes in glioma.
Neurobiol Dis. 48:1–8. 2012. View Article : Google Scholar : PubMed/NCBI
|
|
39
|
Goto Y, Hayashi R, Muramatsu T, Ogawa H,
Eguchi I, Oshida Y, Ohtani K and Yoshida K: JPO1/CDCA7, a novel
transcription factor E2F1-induced protein, possesses intrinsic
transcriptional regulator activity. Biochim Biophys Acta.
1759:60–68. 2006. View Article : Google Scholar : PubMed/NCBI
|