Introduction
Pancreatic cancer is one of the most lethal types of
cancer, with the majority of patients suffering from inoperable
disease at the time of diagnosis (1).
Despite tremendous efforts in developing novel therapies for
pancreatic cancer, particularly in the past two decades, the
overall 5-year survival rate remains <5% and the median survival
period is 6 months following diagnosis (2). Given that one of the growth
promoter/survival signaling pathways upregulated during pancreatic
tumorigenesis is that of epidermal growth factor receptor (EGFR),
targeting EGFR activity is considered to be a promising strategy
for the treatment of pancreatic cancer, in addition to cytotoxic
chemotherapy. To date, erlotinib, a small molecule tyrosine kinase
inhibitor (TKI) for EGFR, in combination with gemcitabine
chemotherapy, has been approved as a first-line therapy for locally
advanced and metastatic pancreatic cancer. Although this regimen
has prolonged the median survival period of patients with
pancreatic cancer, the benefit is quite modest owing to the therapy
resistance of this malignancy. Furthermore, only 25–30% of patients
respond to this regimen and eventually exhibit cancer progression
due to chemoresistance (3). In this
regard, pancreatic cancer remains an intractable and recurrent
metastatic cancer despite notable improvements in chemotherapeutic
approaches. Therefore, there is a clear and distinct requirement to
understand the underlying molecular mechanisms and biology of
pancreatic cancer, including the genomic or metabolomic alterations
responsible for chemoresistance, which is an essential issue to
address in order to develop effective novel therapies for
pancreatic cancer.
Metabolomics is an approach that enables the better
understanding of the physiological or pathophysiological states of
humans, animals or plants by identifying and/or quantifying known
or novel metabolites in biological specimens, followed by
statistical interpretation of changes in the metabolites in
association with their biological systems. Over the last decade,
publications in metabolomics for human urine, blood and cell
culture samples have markedly increased (4,5) in order
to facilitate the understanding of human biology in health and
disease. In particular, cell culture metabolomics serves a key role
in enhancing the understanding of cell properties and functions
depending on specific cellular phenotypes (5). Mass spectrometry (MS) is an important
tool in metabolomics, because of the superior metabolite coverage
made available by the technique due to improved sensitivity and
reproducibility (4,6). Thus, MS is the most appropriate approach
for cell culture metabolomics, although its applications with cell
lysates remain limited to in vitro measurement (5).
In the current study, erlotinib-resistant human
pancreatic adenocarcinoma cells (HPAC-ER) were established in order
to obtain the relevant metabolic signatures for the early detection
of chemoresistance to erlotinib. To achieve this, the metabolic
characteristics between erlotinib-sensitive (HPAC) and
erlotinib-resistant (HPAC-ER) pancreatic cancer cells were compared
by MS-based targeted metabolic profiling. The targeted metabolic
analysis was performed with a commercial kit using a MS-based flow
injection analysis (FIA) and an MS-based liquid chromatography (LC)
to quantify the following five metabolite groups: Acylcarnitines;
amino acids and biogenic amines, glycerophospholipids;
sphingolipids; and monosaccharides. Throughout the use of this
metabolomic approach, the deregulation of metabolic signaling
pathways induced by the acquisition of resistance to erlotinib in
pancreatic cancer was investigated.
Materials and methods
Materials
Erlotinib was purchased from LC Laboratories
(Woburn, MA, USA). Halt™ Protease/Phosphatase Inhibitors Cocktail
(100X), EDTA (100X) and the BCA protein assay kit were purchased
from Thermo Fisher Scientific, Inc. (Waltham, MA, USA). MTT was
purchased from Sigma-Aldrich (Merck KGaA, Darmstadt, Germany). The
AbsoluteIDQ® p180 kit was obtained from Biocrates Life
Sciences AG (Innsbruck, Austria). All solvents used for MS were of
high-performance liquid chromatography grade.
Cell culture
The human pancreatic adenocarcinoma cell line HPAC
was obtained from the American Type Culture Collection (Manassas,
VA, USA) and cultured in RPMI-1640 medium with L-glutamine
supplemented with 10% FBS (Gibco; Thermo Fisher Scientific, Inc.)
and 1% penicillin/streptomycin (Hyclone; GE Healthcare Life
Sciences, Logan, UT, USA). Erlotinib-resistant HPAC cells (HPAC-ER)
were generated through continuous exposure of parental HPAC cells
to erlotinib for >6 months. Starting with an erlotinib
concentration of 0.1 µM, the exposure dose was doubled every 2
weeks until a final concentration of 10 µM was achieved. HPAC-ER
cells were cultured in the same medium, with the addition of 1 µM
erlotinib. All cells were cultured as monolayers at 37°C in a
humidifier incubator with 5% CO2.
Cell viability assay
Cell viability was measured using the MTT assay.
HPAC or HPAC-ER cells (1×10³ cells/well) were treated with 0.1–10
µM of erlotinib and incubated for 72 h at 37°C. Following this, the
media was replaced with the fresh RPMI-1640 medium supplemented MTT
(0.5 mg/ml MTT; 100 µl/well) and incubated for 4 h at 37°C. The
medium was subsequently aspirated from the wells, 100 µl dimethyl
sulfoxide (DMSO) added and the plates agitated for 3 min. The
absorbance at 565 nm was then read using a Tecan
Infinite® F200 PRO plate reader (Promega Corporation,
Madison, WI, USA). Results are presented as the percentage of
absorbance relative to cells incubated with DMSO alone.
Soft agar colony formation assay
HPAC or HPAC-ER cells (8×10³ cells/well) were
suspended in Basal Medium Eagle (BME; 1 ml with 10% FBS and 0.33%
bacto agar) and plated over a layer of solidified agar (BME with
10% FBS and 0.5% bacto agar). The cultures were maintained at 37°C
in an incubator with 5% CO2 for 7 days, and the colonies
were observed using a light microscope (magnification, ×40).
Metabolomic analysis
For the determination of intracellular metabolites,
cell culture lysates were prepared using a modified extraction
protocol, as described previously (7). Following removal of the media, the HPAC
and HPAC-ER cells were washed two times with ice-cold PBS and lyzed
in 10 mM phosphate buffer (Sigma-Aldrich; Merck KGaA). Then, three
cycles of sonication (40 kHz; 25°C; 15 sec) followed by a
freeze-thaw cycle (liquid nitrogen for 30 sec followed by instantly
thawing in a 98°C heat block) were performed, and the samples were
centrifuged to collect the cell lysates (20,000 × g, 10 min,
4°C).
The metabolomic analysis in the prepared cell
lysates was performed using the AbsoluteIDQ p180 kit, which allowed
the simultaneous quantification of a total of 186 metabolites (40
acylcarnitines, 41 amino acids and biogenic amines, 90
glycerophospholipids and 15 sphingolipids) and a sum of hexoses
(including glucose), including glucose (Table I). The kit was used with a 4000
QTRAP® Mass Spectrometer (AB Sciex, Framingham, MA, USA)
in multiple reaction monitoring detection mode with electrospray
ionization (ESI) at Inha University Hospital Clinical Trial Center
(Incheon, Korea). Amino acids and biogenic amines were injected
into the mass spectrometer using FIA and the other groups of
metabolites were injected via LC. The kit was validated using
MetVal™ software (Biocrates Life Sciences AG) and the analytical
results were processed using Analyst™ (version 1.6.2; AB Sciex) and
MetVal™ software (Biocrates Life Sciences AG). The quantitative
metabolite results were normalized to total protein concentrations
of cell lysates, which were determined using the BCA Protein assay
kit.
 | Table I.Number of metabolites investigated in
HPAC and HPAC-ER cells. |
Table I.
Number of metabolites investigated in
HPAC and HPAC-ER cells.
| Metabolite group | Total number of
metabolites | Number of semi-
quantified metabolites | Number of
significantly changed metabolites (HPAC vs. HPAC-ER cells) |
| Acylcarnitines | 40 | 5 | 2 |
| Amino acids and
biogenic amines | 41 | 33 | 5 |
|
Glycerophospholipids | 90 | 84 | 37 |
| Sphingolipids | 15 | 14 | 1 |
| Monosaccharides | 1 | 1 | 0 |
| Total | 187 | 137 | 45 |
Statistical analysis
Statistical analysis of the quantitative metabolite
results was performed using Mass Profiler Professional software
(version B.12.6.1; Agilent Technologies, Inc., Santa Clara, CA,
USA). The comparison of metabolites between the HPAC and HPAC-ER
cells was performed using multivariate analysis with principal
component analysis (PCA) and partial least squares discriminant
analysis (PLS-DA). A Student's t-test or one-way analysis of
variance with a multiple testing correction (Benjamini-Hochberg
false discovery rate) were used to determine significant
differences in the quantitative results of the metabolites, with a
log2 fold-change >1 and P-value ≤0.001 considered to
indicate a statistically significant difference. Based on these
criteria, a volcano plot was generated. A heat map was also
produced by the unsupervised hierarchical clustering of metabolite
signatures.
Results and discussion
Successful establishment of HPAC-ER
cells
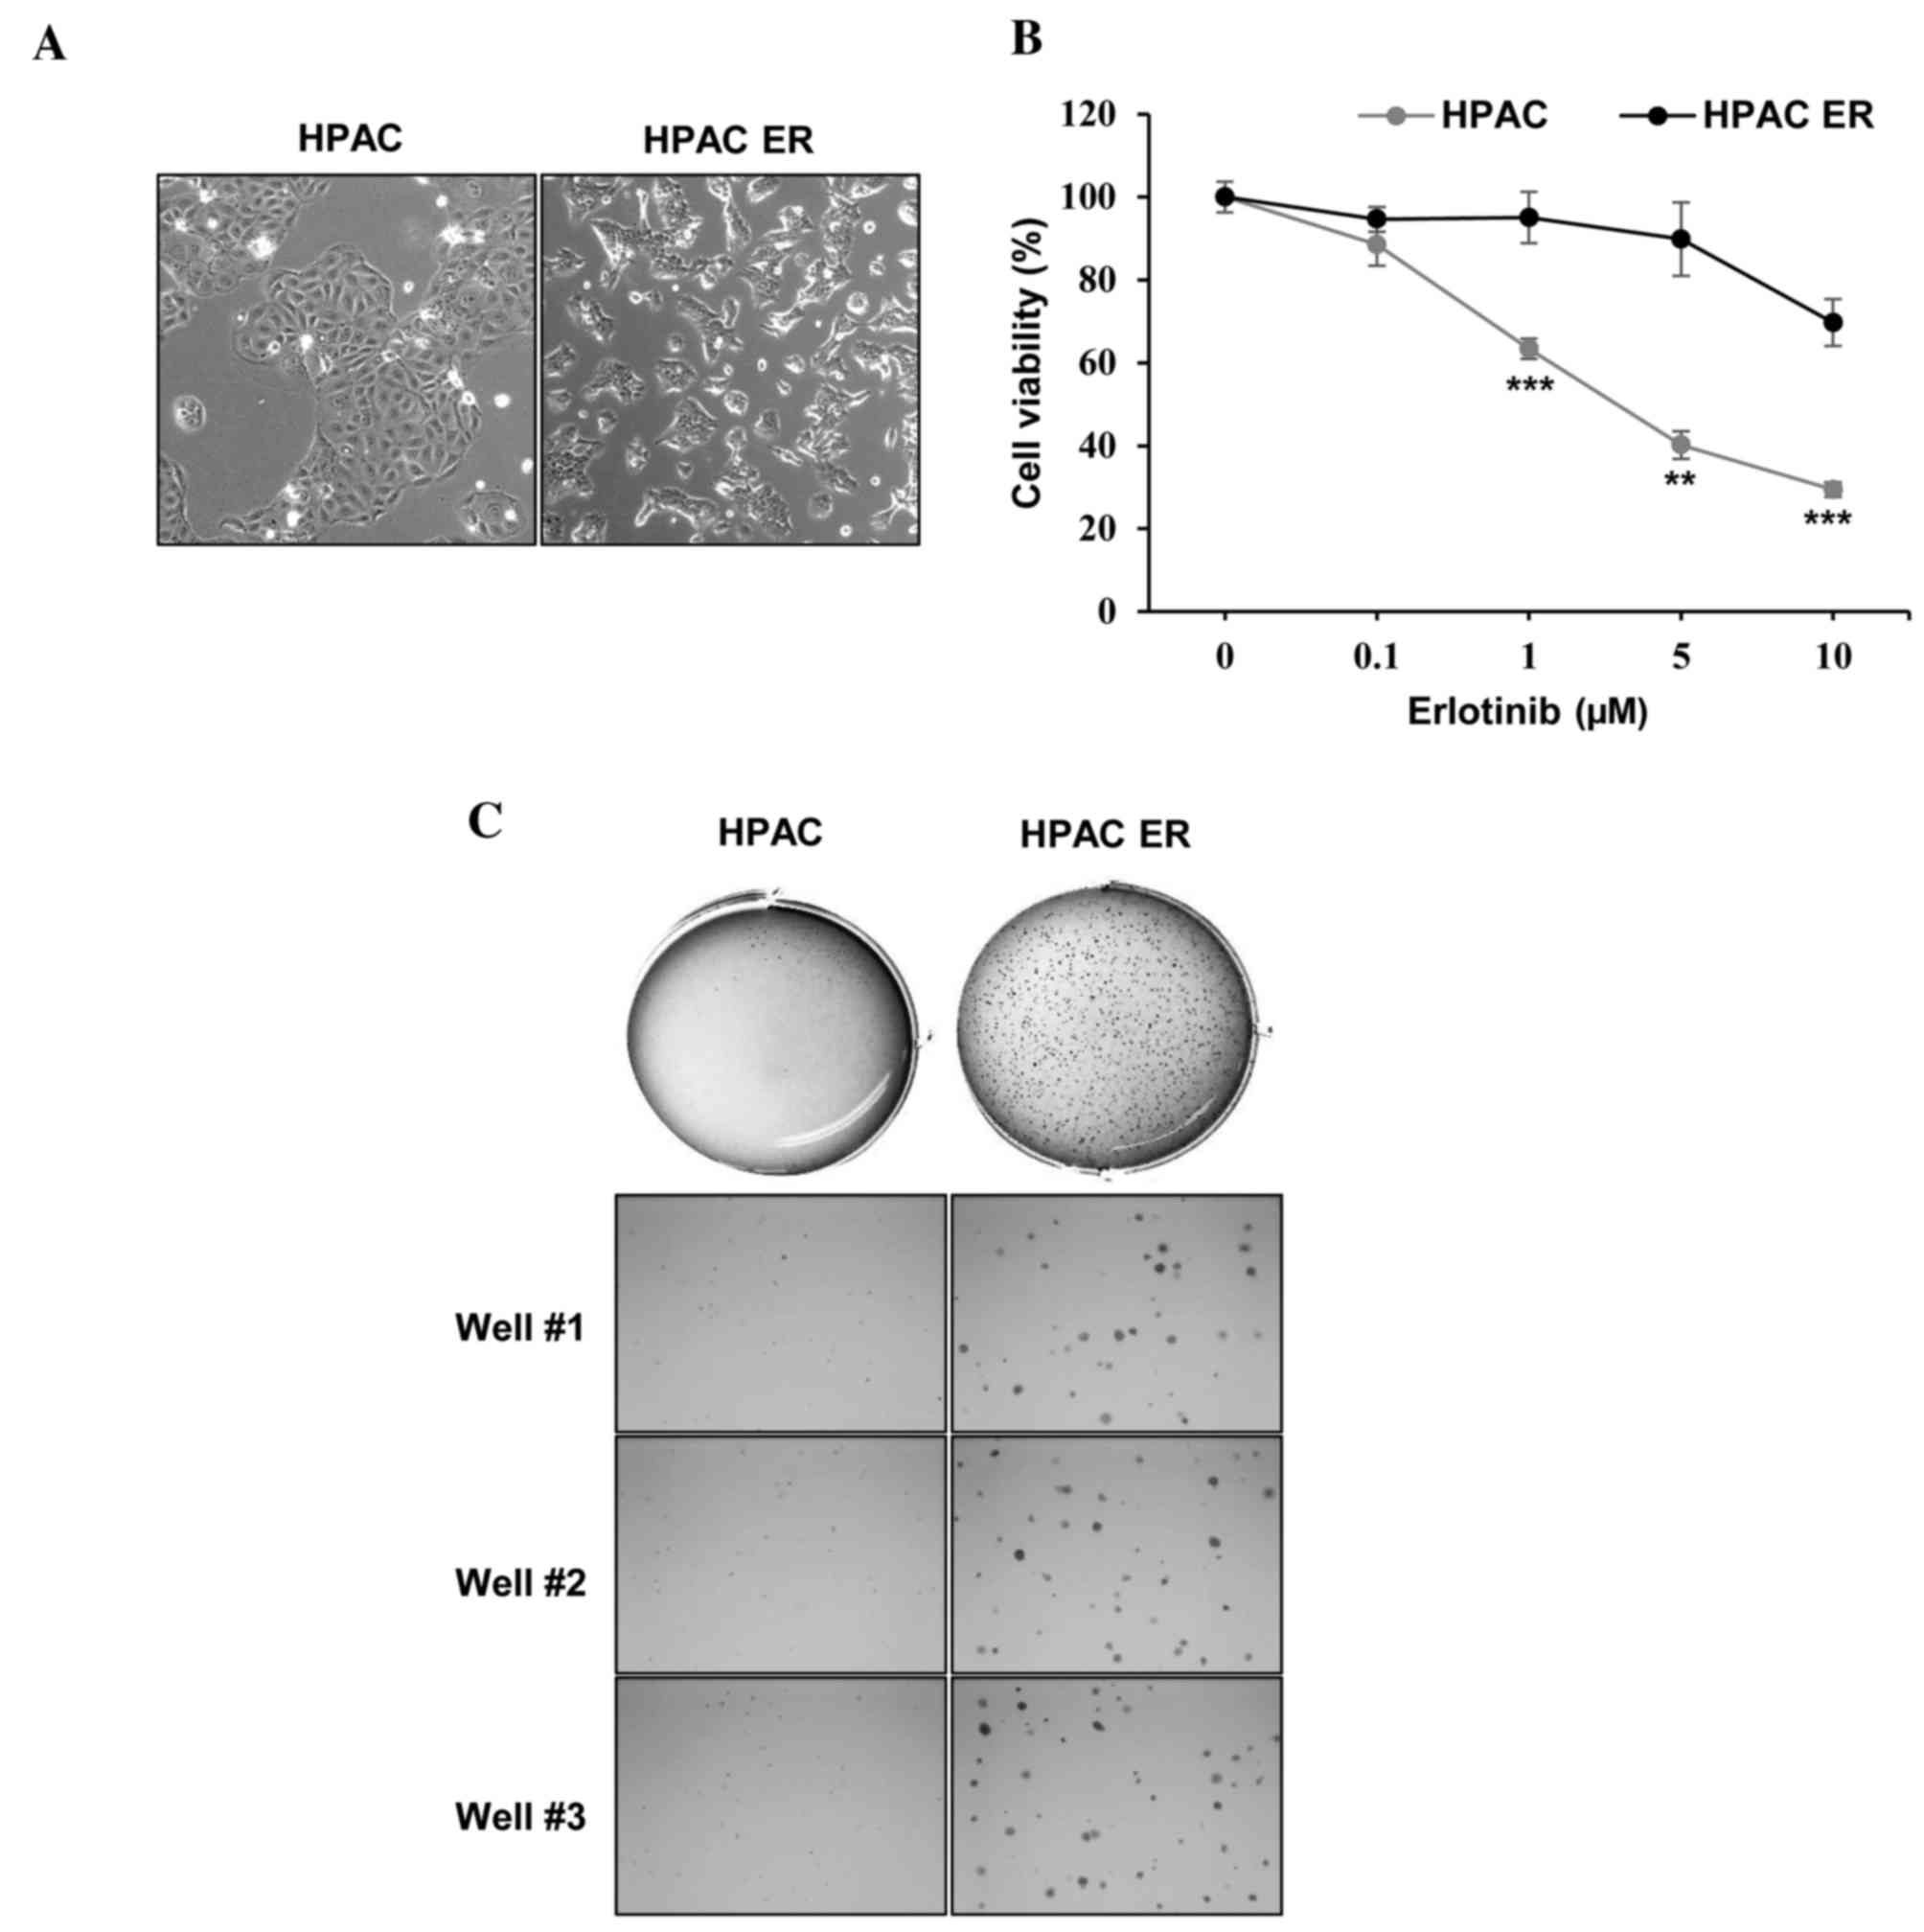
To establish the HPAC-ER cell line, HPAC cells were
cultured using a stepwise selection method, with media containing
an increasing erlotinib concentration (0.01–10 µM). The resultant
HPAC-ER cells were characterized by distinct morphological changes,
including a loss of cell-cell adhesion and scattered pattern of
distribution compared with their parental cell line, HPAC (Fig. 1A). The quantification of cell
viability at different concentrations of erlotinib also verified
the successful generation of erlotinib-resistance (Fig. 1B). The viability of HPAC cells
gradually decreased to <50% following treatment with 1–5 µM
range of erlotinib, whereas the viability of HPAC-ER cells remained
relatively unchanged; the HPAC-ER cells were significantly more
resistant to erlotinib (>1 µM) compared with their parental
cells.
HPAC-ER cells have increased
colony-forming ability
The ability of transformed cells to form colonies in
soft agar is associated with in vivo tumorigenesis and is
frequently used as a surrogate in vitro assay for an in
vivo phenotype (7). Therefore, an
anchorage-independent colony formation assay in soft agar was
performed (Fig. 1C). This revealed
that HPAC-ER cells formed a markedly higher number of colonies
compared with HPAC cells, suggesting that the molecular alterations
responsible for the tumorigenic phenotype occur during the
acquisition of resistance to erlotinib in HPAC-ER cells.
Metabolomic analysis
Semi-quantification of metabolite
concentrations
To understand the changes in tumor metabolism, and
investigate the metabolic differences between HPAC and HPAC-ER
cells in relation to their sensitivity to erlotinib, MS-based
targeted metabolomic profiling analysis was performed. A total of
137 metabolites were semi-quantified (Table I). In MS using ESI, the matrix effect
is a major issue that affects accurate quantification (8). Even though quantitative results of
concentrations of metabolites were obtained from the cell lysates,
these were not considered to be an accurate indication of the
concentration of metabolites in the cells because the calibrators
(standards only) used for quantification were not matrix-matched.
Therefore, log2 fold-change values were used to describe
the concentrations of significantly altered metabolites between the
HPAC and HPAC-ER cells (Table
II).
| Table II.Significantly changed metabolites in
HPAC and HPAC-ER cells. |
Table II.
Significantly changed metabolites in
HPAC and HPAC-ER cells.
| Metabolite | P-value | Log2 fold-change | Production
change |
| Acetylcarnitine | 9.86E-07 | 1.24 | Up |
|
Propionylcarnitine | 3.18E-10 | 2.93 | Up |
| Glutamate | 1.75E-07 | 1.04 | Up |
| Asymmetric
dimethylarginine | 2.79E-11 | ND | Up |
| α-Aminoadipic
acid | 2.47E-05 | ND | Up |
| Serotonin | 2.60E-14 | ND | Down |
| Taurine | 1.27E-10 | 1.79 | Up |
| LysoPC a C20:4 | 3.91E-06 | 1.66 | Up |
| LysoPC a C26:0 | 1.53E-06 | 1.25 | Up |
| LysoPC a C26:1 | 2.01E-07 | 1.39 | Up |
| PC aa C30:2 | 2.16E-04 | 1.20 | Up |
| PC aa C32:3 | 6.04E-09 | 1.06 | Up |
| PC aa C34:1 | 4.33E-11 | −1.16 | Down |
| PC aa C36:2 | 1.06E-12 | −1.71 | Down |
| PC aa C36:5 | 8.63E-12 | 1.43 | Up |
| PC aa C38:0 | 1.29E-09 | −1.13 | Down |
| PC ae C30:0 | 1.03E-14 | −2.40 | Down |
| PC ae C30:1 | 2.62E-10 | −1.06 | Down |
| PC ae C32:1 | 3.53E-14 | −2.46 | Down |
| PC ae C32:2 | 1.74E-10 | −1.09 | Down |
| PC ae C34:0 | 1.34E-10 | −1.21 | Down |
| PC ae C34:1 | 2.79E-13 | −2.24 | Down |
| PC ae C34:2 | 5.19E-13 | −1.93 | Down |
| PC ae C34:3 | 6.20E-10 | −1.08 | Down |
| PC ae C36:1 | 4.51E-12 | −1.81 | Down |
| PC ae C36:2 | 3.41E-13 | −1.89 | Down |
| PC ae C36:3 | 1.02E-12 | −2.02 | Down |
| PC ae C36:4 | 1.64E-11 | −1.68 | Down |
| PC ae C38:1 | 2.93E-10 | −1.24 | Down |
| PC ae C38:2 | 2.55E-11 | −1.39 | Down |
| PC ae C38:3 | 1.70E-11 | −1.18 | Down |
| PC ae C38:4 | 1.84E-11 | −1.62 | Down |
| PC ae C38:5 | 2.24E-10 | −1.32 | Down |
| PC ae C40:1 | 2.51E-10 | −1.18 | Down |
| PC ae C40:2 | 1.39E-12 | −1.98 | Down |
| PC ae C40:3 | 3.55E-10 | −1.06 | Down |
| PC ae C40:6 | 5.69E-11 | −1.36 | Down |
| PC ae C42:1 | 4.98E-13 | −1.78 | Down |
| PC ae C42:2 | 1.10E-13 | −2.93 | Down |
| PC ae C42:3 | 3.42E-11 | −1.86 | Down |
| PC ae C44:3 | 7.23E-13 | −2.15 | Down |
| PC ae C44:4 | 7.06E-11 | −1.86 | Down |
| PC ae C44:5 | 7.16E-12 | −1.78 | Down |
| PC ae C44:6 | 2.01E-08 | −1.22 | Down |
| SM C24:0 | 3.22E-11 | −1.43 | Down |
Metabolite concentrations were significantly
different between HPAC and HPAC-ER cells
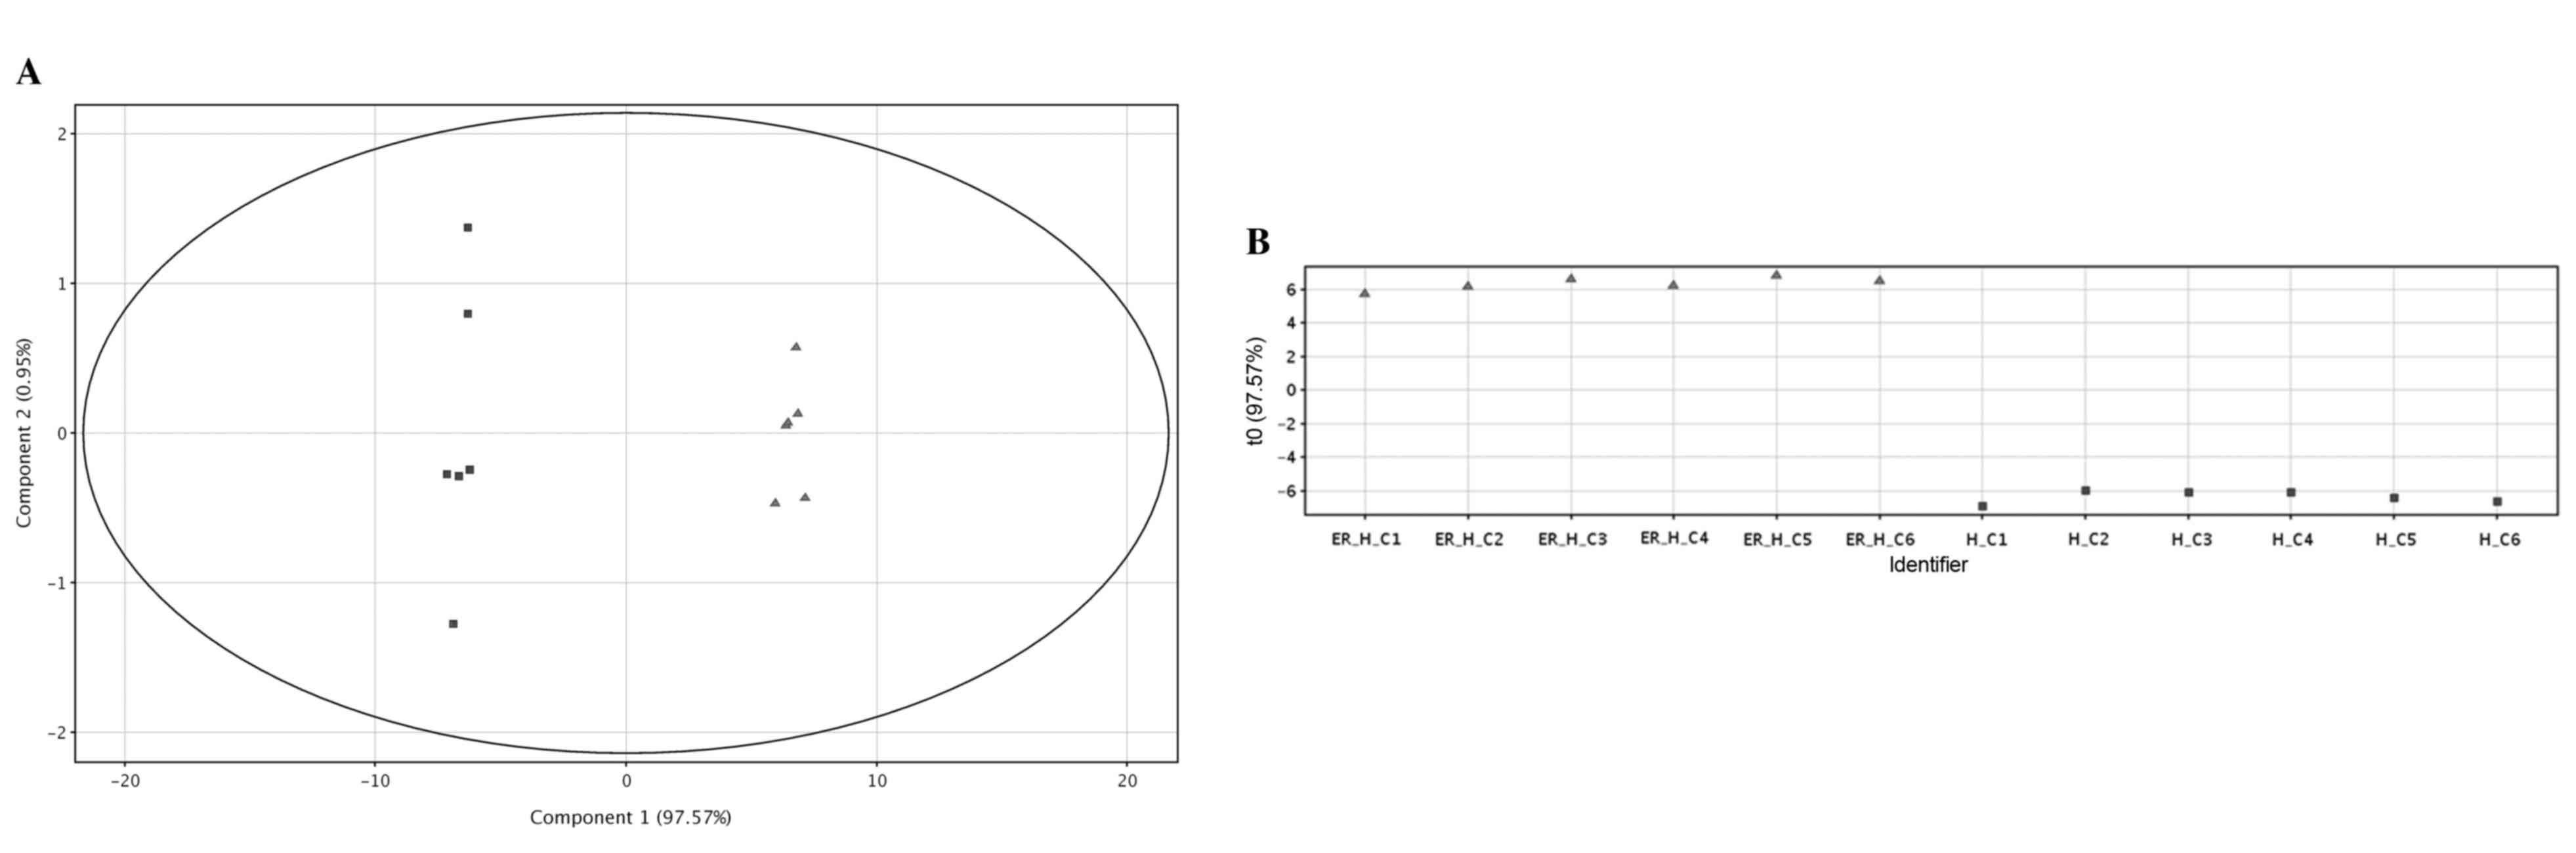
From the statistical analysis, the concentrations of
45 metabolites (2 acylcarnitines, 5 amino acids and biogenic
amines, 37 glycerophospholipids and 1 sphingolipid) were
significantly different between the HPAC and HPAC-ER cells
(Tables I and II). The semi-quantitative results of these
metabolites revealed a marked differentiation between HPAC and
HPAC-ER cells, as presented in the PCA score plot (Fig. 2A). This differentiation was primarily
represented by the first principal component (PC1), which was
96.38% of the observed variations. A supervised multivariate
analysis, PLS-DA, also revealed a distinct separation between the
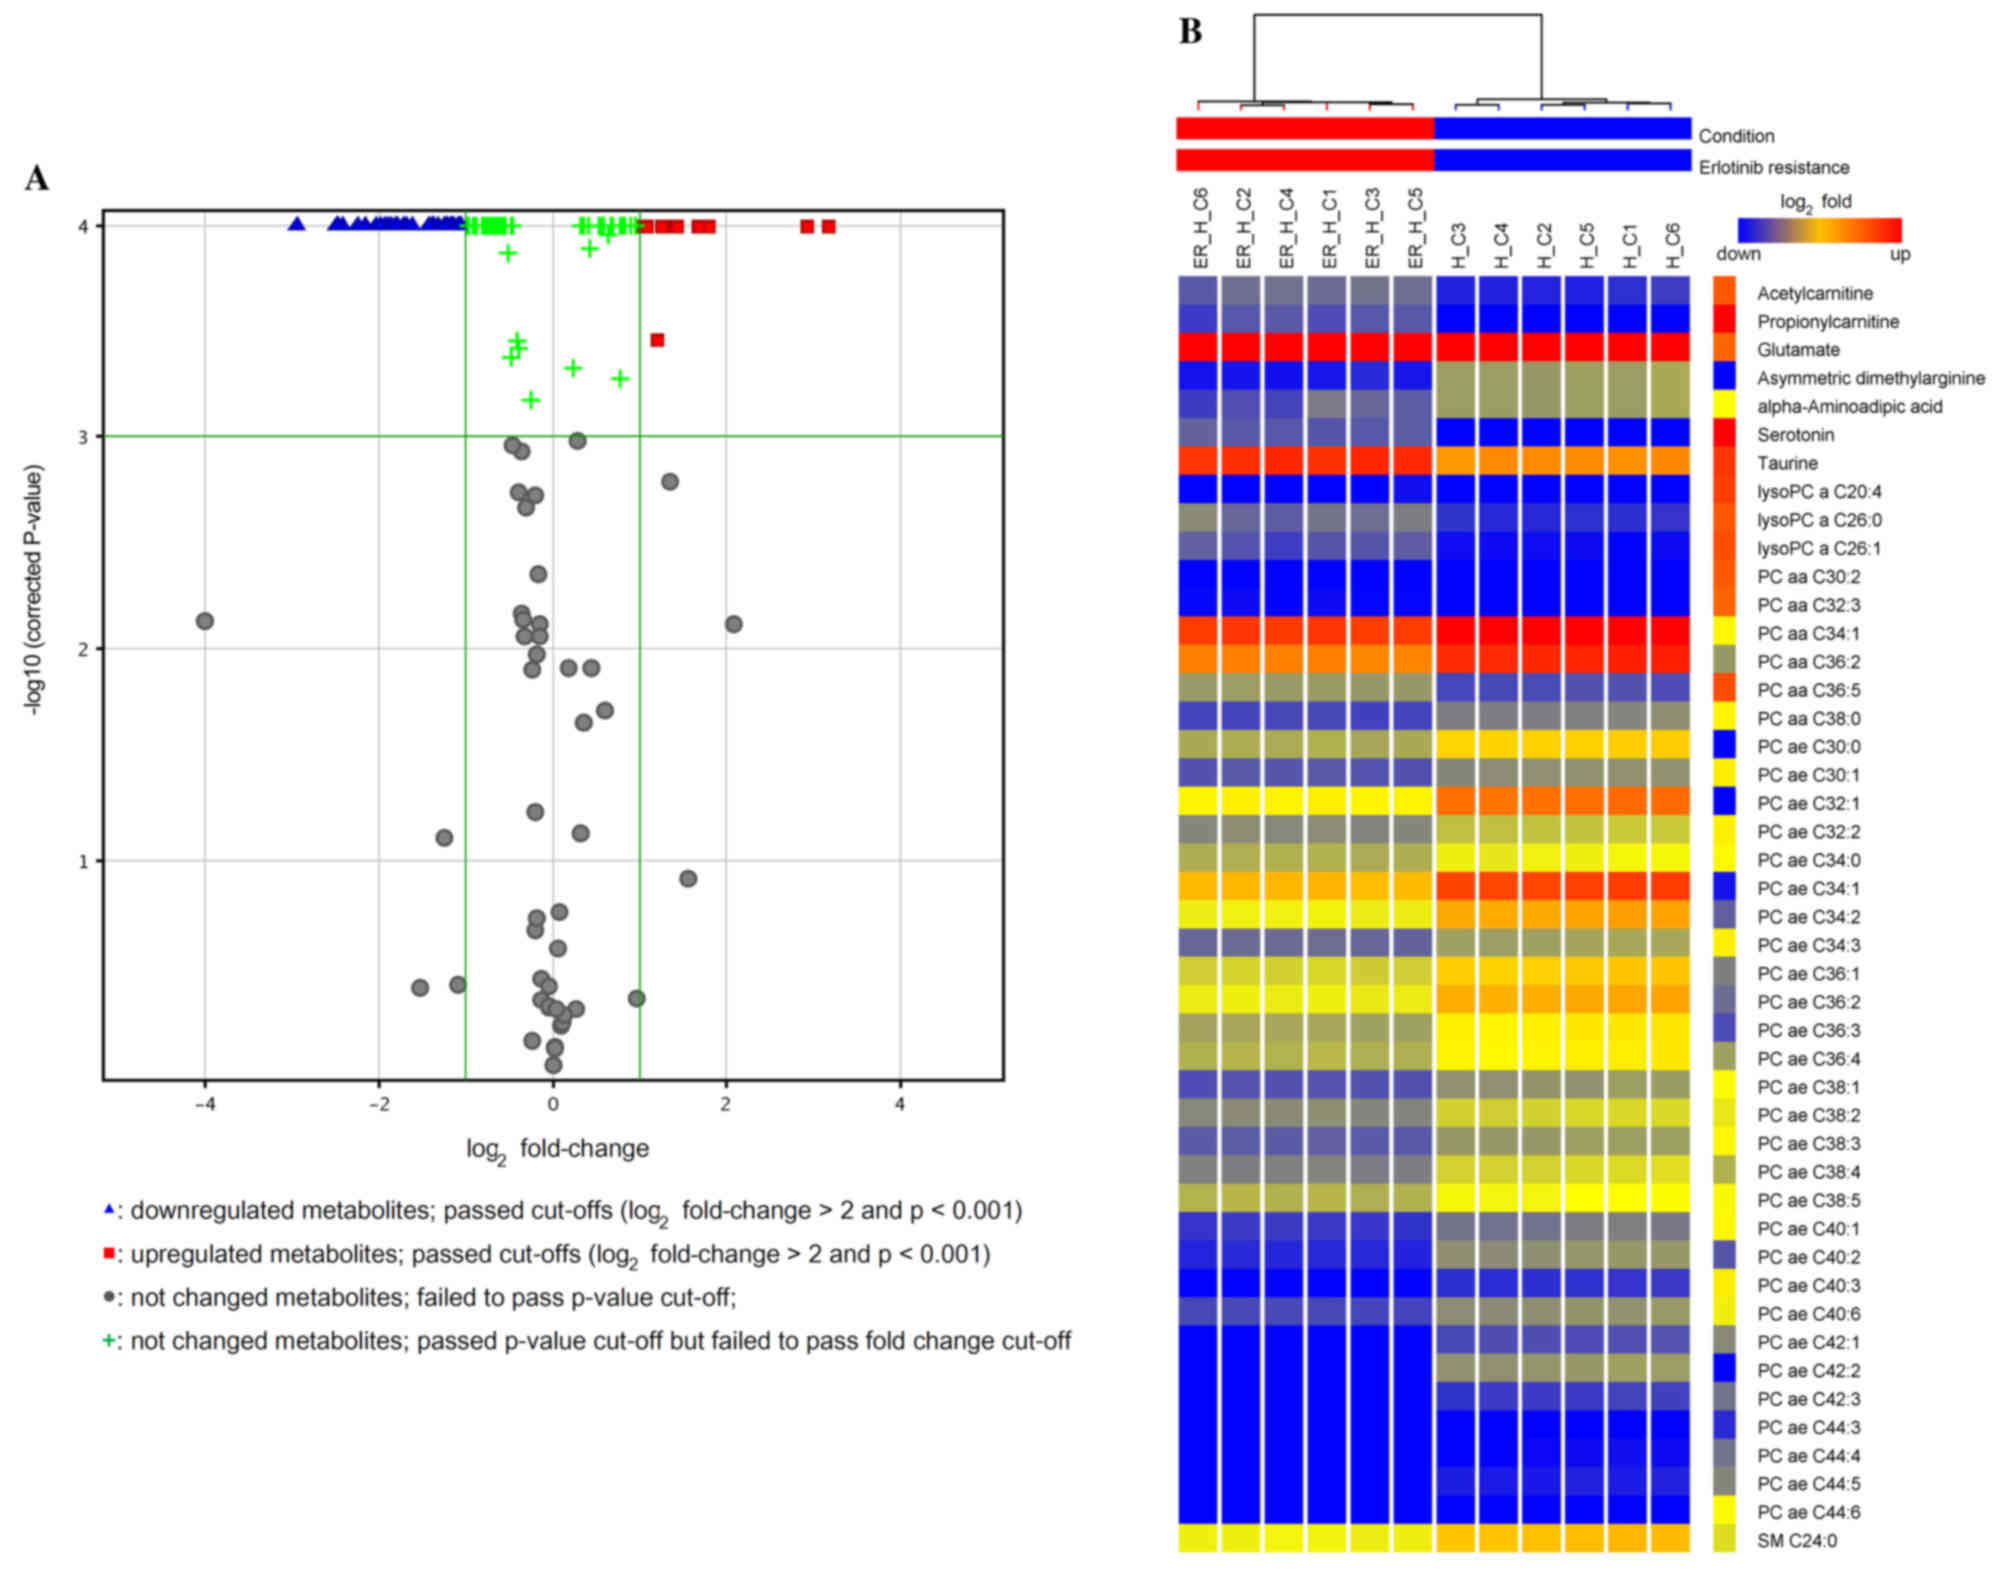
two groups of the cells (R20.994; Q2=0.993; Fig. 2B). The volcano plot displays the
production signatures of significantly increased or decreased
metabolites in the HPAC-ER compared with the HPAC cells (Fig. 3A). A total of 12/45 (27%) and 33/45
(73%) of the significantly differentially produced metabolites were
increased and decreased, respectively. The graphic heat map
produced depicts the levels of the significantly differentially
produced metabolites in each sample of the two groups, in addition
to the variation in the amount of each metabolite between samples
(Fig. 3B).
Table II presents the
list of metabolites that were significantly differently produced
between HPAC and HPAC-ER cells. Two short-chain acylcarnitines,
acetylcarnitine (C2) and propionylcarnitine (C3), were present in
the HPAC-ER cells at significantly higher levels compared with the
HPAC cells (Table II), while the
other longer-chain acylcarnitines were below the limit of
quantification, excluding hexadecanolycarnitine (C16), which was
not significantly different (data not shown). The level of
carnitine (C0) was not significantly different between the two cell
lines (data not shown). Acylcarnitines are essential compounds for
mitochondrial fatty acid oxidation. Long-chain acylcarnitines are
used for the formation of ATP, the energy currency in cells. Acetyl
coenzyme A (acetyl-CoA), produced during the β-oxidation of fatty
acids in the mitochondria, is converted to acetylcarnitine by
carnitine acetyl transferase. In addition, acetylcarnitine from
peroxisomes is exported to the mitochondria for the metabolism of
long-chain acylcarnitines (9,10). Therefore, the increased abundance of
acetylcarnitine in HPAC-ER cells indicates that they have an
elevated metabolic capacity and produce more energy compared with
their erlotinib-sensitive counterparts.
Deregulation of metabolite production contributes
to the chemoresistance of cancer cells
Deregulation of amino acids and biogenic amines may
be associated with the drug resistance of cancer cells (11–13). The
abundance of glutamate from the conversion of glutamine to
glutamate is a well-known characteristic of cancer cells that
possess high glutaminase activity and low glutamine synthase
activity (11). Consistent with this,
a previous study indicated that glutamate levels were significantly
higher in erlotinib-resistant non-small cell lung cancer cells
(PC-9ER) compared with their erlotinib-sensitive parental cell line
(PC-9) (14). In addition, a recent
study reported decreased glutamine levels in two different
gemcitabine-resistant human pancreatic cancer cell lines (SUIT-2-GR
and CAPAN-1-GR) compared with their gemcitabine-sensitive parental
cell lines (15). Glutamate serves a
role in a variety of metabolic signaling pathways, including those
for taurine, hypotaurine, D-glutamine, D-glutamate and glutathione
metabolism. In the present study, glutamate and taurine were
upregulated in the HPAC-ER compared with the HAPC cells (Table II). Since taurine is a fundamental
amino acid for cell development, nutrition and survival (16), the increased levels of taurine and
glutamate may contribute to the tumorigenic characteristics of
HPAC-ER cells.
α-Aminoadipic acid, which mediates the synthesis of
lysine and acetyl-CoA, was previously identified as one of the
biomarkers of cancer from metabolic footprinting in Kruppel like
factor 4-deficient mouse embryonic fibroblasts (17). Similarly, the data from the present
study demonstrated that α-aminoadipic acid was present at a
significantly higher level in the HPAC-ER cells compared with the
HPAC cells (Table II).
According to a previous review of the role of two
monoamine neurotransmitters, serotonin and dopamine, in regulation
of tumor behavior, there have been reports of metabolites serving
opposing roles in cancer; serotonin has been revealed to stimulate
while dopamine has been demonstrated to inhibit tumor growth
(18). Notably, the present study
demonstrated that the level of serotonin was significantly
decreased in the HPAC-ER cells compared with the HPAC cells
(Table II). Few studies
investigating the role served by serotonin in chemoresistance have
been reported; thus, the biological significance of the decreased
level of serotonin observed in HPAC-ER cells remains unclear
without further investigation.
The present study revealed that the concentration of
asymmetric dimethylarginine (ADMA) was elevated in HPAC-ER cells,
whereas neither ADMA nor symmetric dimethylarginine (SDMA) were
detected in the HPAC cells (Table
II). Unlike SDMA, ADMA has been reported to be an endogenous
inhibitor of nitric oxide synthase, which synthesizes nitric oxide
from L-arginine (19). The ratio of
arginine:ADMA:SDMA is used to monitor pathophysiological states in
a variety of diseases, particularly cardiovascular diseases
(20,21). The level of arginine, the precursor of
methylated arginine derivatives, including ADMA, was not
significantly different between HPAC-ER and HPAC in the present
study. Previous studies have reported a higher level of ADMA in
blood samples from patients with colon cancer compared with those
from healthy subjects (22,23). Li et al (22) proposed that the increased level of
ADMA in patients with colon cancer reflected the evasion of
apoptosis exhibited by cancer cells in order to deal with cellular
stressors, including chemotherapy.
The majority of metabolites quantified in the
current study were lysophosphatidylcholines (lysoPCs) and PCs. The
concentrations of 3/13 lysoPCs increased (log2
fold-change range, 1.25–1.66), while those of 31/72 PCs decreased
(log2 fold-change range, −2.93 to −1.06) in the HPAC-ER
cells compared with the HPAC cells (Table II). Among 14 types of sphingomyeline
(SM), SM C24:0 was significantly decreased in the HPAC-ER cells
compared with the HPAC cells, whereas the levels of the other
lipids were not significantly changed (Table II). Activation of phospholipase
A2 serves an important role in carcinogenesis through
enabling the hydrolysis of PCs to lysoPCs and arachidonic acid,
which induce cancer cell growth and proliferation (24). Notably, the breakdown of PCs to
lysoPCs and arachidonic acid has been observed in head and neck
squamous cell carcinoma cells (25).
Similarly, the current study observed elevated levels of lysoPCs
and reduced levels of PCs in HPAC-ER cells compared with HPAC cells
(Table II). It is well documented
that choline phospholipid metabolism is markedly altered in the
majority of cancer types (25,26). These
results suggested that the metabolic alterations observed in
HPAC-ER cells in the present study, including elevated lysoPC and
decreased PC levels, could be used as biomarkers for predicting
resistance to erlotinib in pancreatic cancer.
The comparative metabolomic analysis of human
pancreatic cancer cells, HPAC and HPAC-ER, in the present study
revealed that metabolic alterations were associated with resistance
to erlotinib human pancreatic cancer. Notably, significantly
increased levels of short-chain acylcarnitines and lysoPCs, and
significantly decreased levels of PCs, were identified in the
HPAC-ER cells compared with the HAPC cells, indicating an increased
phospholipid turnover. In addition, the observed metabolic changes
support the theory that acetyl-CoA-associated and choline
phospholipid metabolism serve important roles in pancreatic cancer
development. Furthermore, the data from the present study revealed
that glutamate, ADMA, α-aminoadipic acid and taurine were
significantly increased in the HPAC-ER cells, suggesting that there
are higher metabolic demands in erlotinib-resistant cancer.
Metabolic alterations in the specific amino acids discussed may aid
in elucidating the biological mechanisms of erlotinib-resistance in
pancreatic cancer.
In conclusion, the findings of the present study
will contribute to the better understanding of the overall
metabolic changes that occur in chemoresistant pancreatic cancer
and will aid in associating particular metabolomes to specific
cancer phenotypes, particularly those of chemoresistance. Despite
the simultaneous determination of multiple groups of metabolites,
the data from the present study is not sufficient to illustrate
comprehensive metabolite changes. Nevertheless, the current study
highlights the fact that the identification and characterization of
metabolic markers may allow for the earlier detection of
chemoresistance. This will allow for more rapid drug regimen
changes, prolonging patient survival, particularly in pancreatic
cancer.
Acknowledgements
The present study was supported by the Bio &
Medical Technology Development Program of the National Research
Foundation (NRF) funded by the Ministry of Science, ICT &
Future Planning (grant no. NRF-2015M3A9E1028327) and the Basic
Science Research Program through the National Research Foundation
of Korea, which is funded by the Ministry of Education (grant nos.
NRF-2014R1A1A1036222 and 2014R1A1A2054979).
References
|
1
|
Vincent A, Herman J, Schulick R, Hruban RH
and Goggins M: Pancreatic cancer. Lancet. 378:607–620. 2011.
View Article : Google Scholar : PubMed/NCBI
|
|
2
|
Hidalgo M: Pancreatic cancer. N Engl J
Med. 362:1605–1617. 2010. View Article : Google Scholar : PubMed/NCBI
|
|
3
|
Moore MJ, Goldstein D, Hamm J, Figer A,
Hecht JR, Gallinger S, Au HJ, Murawa P, Walde D, Wolff RA, et al:
Erlotinib plus gemcitabine compared with gemcitabine alone in
patients with advanced pancreatic cancer: A phase III trial of the
National Cancer Institute of Canada Clinical Trials Group. J Clin
Oncol. 25:1960–1966. 2007. View Article : Google Scholar : PubMed/NCBI
|
|
4
|
Bouhifd M, Hartung T, Hogberg HT,
Kleensang A and Zhao L: Review: Toxicometabolomics. J Appl Toxicol.
33:1365–1383. 2013. View
Article : Google Scholar : PubMed/NCBI
|
|
5
|
Cuperlović-Culf M, Barnett DA, Culf AS and
Chute I: Cell culture metabolomics: Applications and future
directions. Drug discovery today. 15:610–621. 2010. View Article : Google Scholar : PubMed/NCBI
|
|
6
|
Theodoridis GA, Gika HG, Want EJ and
Wilson ID: Liquid chromatography-mass spectrometry based global
metabolite profiling: A review. Anal Chim Acta. 711:7–16. 2012.
View Article : Google Scholar : PubMed/NCBI
|
|
7
|
Freedman VH and Shin SI: Cellular
tumorigenicity in nude mice: Correlation with cell growth in
semi-solid medium. Cell. 3:355–359. 1974. View Article : Google Scholar : PubMed/NCBI
|
|
8
|
Matuszewski BK, Constanzer ML and
Chavez-Eng CM: Strategies for the assessment of matrix effect in
quantitative bioanalytical methods based on HPLC-MS/MS. Anal Chem.
75:3019–3030. 2003. View Article : Google Scholar : PubMed/NCBI
|
|
9
|
Kerner J and Hoppel C: Fatty acid import
into mitochondria. Biochim Biophys Acta. 1486:1–17. 2000.
View Article : Google Scholar : PubMed/NCBI
|
|
10
|
Zammit VA, Ramsay RR, Bonomini M and
Arduini A: Carnitine, mitochondrial function and therapy. Adv Drug
Deliv Rev. 61:1353–1362. 2009. View Article : Google Scholar : PubMed/NCBI
|
|
11
|
Medina MA, Sánchez-Jiménez F, Márquez J,
Quesada Rodríguez A and de Núñez Castro I: Relevance of glutamine
metabolism to tumor cell growth. Mol Cell Biochem. 113:1–15. 1992.
View Article : Google Scholar : PubMed/NCBI
|
|
12
|
Sasada S, Miyata Y, Tsutani Y, Tsuyama N,
Masujima T, Hihara J and Okada M: Metabolomic analysis of dynamic
response and drug resistance of gastric cancer cells to
5-fluorouracil. Oncol Rep. 29:925–931. 2013.PubMed/NCBI
|
|
13
|
Staubert C, Bhuiyan H, Lindahl A, Broom
OJ, Zhu Y, Islam S, Linnarsson S, Lehtiö J and Nordström A: Rewired
metabolism in drug-resistant leukemia cells: A metabolic switch
hallmarked by reduced dependence on exogenous glutamine. J Biol
Chem. 290:8348–8359. 2015. View Article : Google Scholar : PubMed/NCBI
|
|
14
|
Serizawa M, Kusuhara M, Zangiacomi V,
Urakami K, Watanabe M, Takahashi T, Yamaguchi K, Yamamoto N and Koh
Y: Identification of metabolic signatures associated with erlotinib
resistance of non-small cell lung cancer cells. Anticancer Res.
34:2779–2787. 2014.PubMed/NCBI
|
|
15
|
Fujimura Y, Ikenaga N, Ohuchida K,
Setoyama D, Irie M, Miura D, Wariishi H, Murata M, Mizumoto K,
Hashizume M and Tanaka M: Mass spectrometry-based metabolic
profiling of gemcitabine-sensitive and gemcitabine-resistant
pancreatic cancer cells. Pancreas. 43:311–318. 2014. View Article : Google Scholar : PubMed/NCBI
|
|
16
|
Ripps H and Shen W: Review: Taurine: A
‘very essential’ amino acid. Mol vis. 18:2673–2686. 2012.PubMed/NCBI
|
|
17
|
Bellance N, Pabst L, Allen G, Rossignol R
and Nagrath D: Oncosecretomics coupled to bioenergetics identifies
α-amino adipic acid, isoleucine and GABA as potential biomarkers of
cancer: Differential expression of c-Myc, Oct1 and KLF4 coordinates
metabolic changes. Biochim Biophys Acta. 1817:2060–2071. 2012.
View Article : Google Scholar : PubMed/NCBI
|
|
18
|
Peters MA, Walenkamp AM, Kema IP, Meijer
C, de Vries EG and Oosting SF: Dopamine and serotonin regulate
tumor behavior by affecting angiogenesis. Drug Resist Updat.
17:96–104. 2014. View Article : Google Scholar : PubMed/NCBI
|
|
19
|
Beltowski J and Kedra A: Asymmetric
dimethylarginine (ADMA) as a target for pharmacotherapy. Pharmacol
Rep. 58:159–178. 2006.PubMed/NCBI
|
|
20
|
Davids M, Swieringa E, Palm F, Smith DE,
Smulders YM, Scheffer PG, Blom HJ and Teerlink T: Simultaneous
determination of asymmetric and symmetric dimethylarginine,
L-monomethylarginine, L-arginine and L-homoarginine in biological
samples using stable isotope dilution liquid chromatography tandem
mass spectrometry. J Chromatogr B Analyt Technol Biomed Life Sci.
900:38–47. 2012. View Article : Google Scholar : PubMed/NCBI
|
|
21
|
Martens-Lobenhoffer J and Bode-Böger SM:
Quantification of L-arginine, asymmetric dimethylarginine and
symmetric dimethylarginine in human plasma: A step improvement in
precision by stable isotope dilution mass spectrometry. J
Chromatogr B Analyt Technol Biomed Life Sci. 904:140–143. 2012.
View Article : Google Scholar : PubMed/NCBI
|
|
22
|
Li H, Zhou Y, Zhao A, Qiu Y, Xie G, Jiang
Q, Zheng X, Zhong W, Sun X, Zhou Z and Jia W: Asymmetric
dimethylarginine attenuates serum starvation-induced apoptosis via
suppression of the Fas (APO-1/CD95)/JNK (SAPK) pathway. Cell Death
Dis. 4:e8302013. View Article : Google Scholar : PubMed/NCBI
|
|
23
|
Yoshimatsu M, Toyokawa G, Hayami S, Unoki
M, Tsunoda T, Field HI, Kelly JD, Neal DE, Maehara Y, Ponder BA, et
al: Dysregulation of PRMT1 and PRMT6, Type I arginine
methyltransferases, is involved in various types of human cancers.
Int J Cancer. 128:562–573. 2011. View Article : Google Scholar : PubMed/NCBI
|
|
24
|
Cummings BS: Phospholipase A2 as targets
for anti-cancer drugs. Biochem Pharmacol. 74:949–959. 2007.
View Article : Google Scholar : PubMed/NCBI
|
|
25
|
Tripathi P, Kamarajan P, Somashekar BS,
MacKinnon N, Chinnaiyan AM, Kapila YL, Rajendiran TM and
Ramamoorthy A: Delineating metabolic signatures of head and neck
squamous cell carcinoma: Phospholipase A2, a potential therapeutic
target. Int J Biochem Cell Biol. 44:1852–1861. 2012. View Article : Google Scholar : PubMed/NCBI
|
|
26
|
Iorio E, Mezzanzanica D, Alberti P,
Spadaro F, Ramoni C, D'Ascenzo S, Millimaggi D, Pavan A, Dolo V,
Canevari S and Podo F: Alterations of choline phospholipid
metabolism in ovarian tumor progression. Cancer Res. 65:9369–9376.
2005. View Article : Google Scholar : PubMed/NCBI
|