Introduction
Lung cancer is the most common type of malignancy
worldwide (1). Small cell lung cancer
(SCLC), characterized by a short cell doubling time, rapid
progression and early occurrence of blood-bone and lymph
metastasis, accounts for 10–15% of all patients with lung cancer
with the highest malignancy (2). The
combination of etoposide and cisplatin (VP16/DDP) is widely used as
a first-line treatment for SCLC, which exhibits a good initial
response (3). However, the relatively
rapid emergence of multidrug resistance (MDR), resulting in relapse
or disease progression, limits the therapeutic benefit and
represents a substantial obstacle for SCLC chemotherapy (4,5). It is
necessary to identify and understand the aberrant mechanisms
underlying drug resistance so as to ameliorate the strategies for
SCLC treatment.
Micro (mi)RNAs, a class of non-coding RNA of 19–25
nucleotides, negatively modulate gene expression at the
post-transcriptional level (6). As
previously demonstrated, miRNAs participate in a number of
fundamental biological processes, including proliferation,
differentiation and apoptosis (7–9). In
addition, it has been demonstrated that miRNA exhibits diverse
functions in oncogenesis, as oncogenes or anti-oncogenes (10,11).
Aberrant microRNA expression is correlated with tumorigenesis,
metastasis, invasiveness and drug resistance (12–14).
However, the involvement of miRNAs in drug resistance in SCLC is
not clearly defined, and the underlying molecular mechanisms of
SCLC-associated miRNAs remain uncharacterized.
A variety of drug resistance mechanisms have been
identified in oncogenesis, involving genetic and non-genetic
mechanisms (15). However, the exact
mechanism of MDR remains unclear, and a small number of miRNAs
involved in MDR in SCLC have been identified. In addition, abnormal
changes in single genes are not representative of this complex
process, and are unable to determine the individualized treatment
required for the elimination of MDR. The screening and
identification of the molecular targets for a solution to the drug
resistance of SCLC are required.
The present study aimed to determine whether
alteration of the crosstalk between miRNAs and mRNAs, upon drug
treatment, contributes to drug resistance. The VP16/DDP-induced
multiple drug resistant SCLC H446/EP cell line was established by
continuous exposure to VP16 and DDP. Microarray techniques and
bioinformatics analysis were performed to identify the differences
in mRNA and miRNA expression between the MDR and the parental cell
lines. The successful establishment and characterization of the
biological properties of the drug-resistant cell line may
facilitate the investigation into the drug resistance mechanisms of
SCLC.
Materials and methods
Cell lines and cell culture
The human SCLC NCI-H446 cell line was purchased from
Tumor Cell Bank of the Chinese Academy of Medical Science
(Shanghai, China). The cell line was maintained in RPMI-1640 medium
(Gibco; Thermo Fisher Scientific, Inc., Waltham, MA, USA)
supplemented with 10% calf serum (Hangzhou Sijiqing Bioengineering
Material Co., Ltd., Zhejiang, China) with 100 µg/ml
penicillin/streptomycin at 37°C with 5% CO2, and was
subcultured every two or three days. The cell subline H446/EP was
developed from H446 with exposure to pulse and increasing
concentrations of etoposide (50, 100, 200, 400, 800 and 1,000
ng/ml) combined with cisplatin (100, 200, 400, 800 and 1,000
ng/ml). H446/EP was preserved in a final concentration of 1,000
ng/ml VP16 and 1,000 ng/ml DDP in the laboratory of Department of
Medical Oncology, Jinling Hospital (Nanjing, China). The H446/EP
cells were incubated in VP16/DDP-free medium for 1 month prior to
additional experiments. The present study was approved by the
ethics committee of Jinling Hospital of Nanjing University
(Nanjing, China).
Cell viability
Cell viability was evaluated by MTT colorimetric
assay. The cells were seeded at 4×10³ cells per well in
96-well plates in the presence or absence of the indicated drugs
for 48 h. A 0.02 ml MTT solution (5%) in PBS was added to each well
followed by incubation at 37°C for 4 h. The medium was removed and
the purple formazan product in the cells was measured at a
wavelength of 490 nm and the number of viable cells was calculated.
Dose-response curves were plotted using data derived from the MTT
assay and the half maximal inhibitory concentration
(IC50) of each anticancer drug was calculated from this
standard curve.
Apoptosis assay
Cell apoptosis was measured using an Annexin
V/FITC-PI apoptosis detection kit (Invitrogen; Thermo Fisher
Scientific, Inc.) that quantitatively measures the percentages of
early apoptotic cells via flow cytometry, according to the
manufacturer's protocol.
Whole Genome OneArray®
Total RNA was extracted from cells using the RNeasy
Mini kit (Qiagen, Inc., Valencia, CA, USA). Fluorescent antisense
RNA (CyDye-aRNA) targets were prepared from 1 or 2.5 µg total RNA
samples using OneArray® Amino Allyl aRNA Amplification
kit (Phalanx Biotech Group, San Diego, CA, USA) and Cy5 dyes
(Amersham Pharmacia; GE Healthcare Life Sciences, Chicago, IL,
USA). Aminoallyl-aRNA was produced by adding
aminoallyl-uridine-5′-triphosphate, prior to the addition of
NHS-CyeDye, which could react with amino allyl. Fluorescent targets
were hybridized to the Human Whole Genome OneArray® with
Phalanx hybridization buffer using Phalanx Hybridization System.
Subsequent to 16 h hybridization at 50°C, non-specific binding
targets were washed away by three different washing steps (Wash I
42°C for 5 min; Wash II, 42°C for 5 min, 25°C for 5 min; Wash III,
rinse 20 times), and the slides were dried by centrifugation at 671
× g and room temperature for 1 min and scanned by Axon 4000B
scanner (Molecular Devices, LLC, Sunnyvale, CA, USA). The
intensities of each probe were obtained by GenePix 4.1 software
(Molecular Devices, LLC).
The raw intensity of each spot was loaded into
Rosetta Resolver System® 7.0 (Rosetta Biosoftware; Merck
KGaA, Darmstadt, Germany) to process the data analysis. The error
model of Rosetta Resolver System® removed systematic and
random errors from the data. Those probes with background signals
were filtered out. Probes that passed the criteria were normalized
by a 50% median scaling normalization method. The technical repeat
data were tested by Pearson correlation coefficient calculation to
check the reproducibility (R value>0.975). Normalized spot
intensities were transformed to gene expression log2
ratios between the control and treatment groups. The probes with
log2 ratio ≥1 or log2 ratio ≤-1 and P<0.05
were defined as differential genes for additional pathway
enrichment analysis.
miRNA OneArray
Total RNA was extracted from cells using TRIzol
reagent (Invitrogen; Thermo Fisher Scientific, Inc.). Small RNA was
pre-enriched by Nanoseplook (Pall Corporation, Port Washington, NY,
USA) from 2.5 µg total RNA samples and labeled with miRNA ULS™
Labeling Kit (Kreatech Diagnostics; Leica Biosystems St. Louis,
GmbH, Wetzlar, Germany). Labeled miRNA targets were hybridized to
the Human miRNA OneArray® v3 with OneArray®
Hybridization System. Subsequent to 16 h hybridization at 37°C,
non-specific binding targets were washed away by three different
washing steps: Wash I, 37°C for 5 min; Wash II, 37°C for 5 min,
then 25°C for 5 min; Wash III, rinse 20 times), and the slides were
dried by centrifugation at 671 × g and room temperature for 1 min
and scanned by an Axon 4000B scanner (Molecular Devices, LLC). The
Cy5 fluorescent intensities of each probe were analyzed by GenePix
4.1 software (Molecular Devices).
The raw intensity of each probe was processed by R
program (version v2.12.1; https://www.r-project.org). Probes that passed the
criteria were normalized by 75% median scaling normalization
method. Normalized spot intensities were transformed to gene
expression log2 ratios between the control and treatment
groups. The spots with log2 ratio ≥1 or log2
ratio ≤-1 and P<0.05 were tested for additional analysis.
Reverse transcription-quantitative
polymerase chain reaction (RT-qPCR) analysis
Total RNA was extracted from the cultured cells with
TRIzol reagent (Invitrogen; Thermo Fisher Scientific, Inc.) and
reverse transcribed to produce cDNA using the RT-PCR kit (catalog
no., CTB101; Chutian Biosciences, Changzhou, China) on the ABI 9700
thermocycler (Applied Biosystems; Thermo Fisher Scientific, Inc.),
following the manufacturer's protocol. EZ gene™ Gel/PCR Ex Kit
(Biomiga, San Diego, CA, USA) was used to detect mRNA. qPCR
amplifications were performed on Roche LightCycler480 II (Roche
Diagnostics, Basel, Switzerland), in 20 µl volumes containing 10 µl
2X Power Taq PCR MasterMix (catalog no., CTB101; Chutian
Biosciences). The thermal profile for RT-PCR was: Initial
denaturation at 95°C for 5 min; followed by 40 cycles of
denaturation at 95°C for 15 sec; annealing at 60°C for 15 sec; and
extension at 72°C for 20 sec. Relative mRNA expression was
normalized to GAPDH using the comparative ΔΔCq method; values are
expressed as 2−ΔΔCq (16).
All primers used were provided with the kit (catalog no., CTB000;
Chutian Biosciences).
Western blot analysis
The cells were lysed in radioimmunoprecipitation
assay buffer for 30 min on ice. Cell lysis supernatant liquid was
obtained by centrifugation at 13,765 × g and 4°C for 15 min.
Protein concentrations were determined using the bicinchoninic acid
assay kit (Pierce; Thermo Fisher Scientific, Inc.). Equal amounts
(15 µl) of cell lysate were separated by SDS-PAGE and transferred
to polyvinylidene difluoride membranes (EMD Millipore, Billerica,
MA, USA). Subsequent to blocking nonspecific binding with 5% skim
milk in TBS with Tween-20 (TBST) for 2 h at room temperature,
membranes were incubated overnight at 4°C with primary antibodies:
B-cell lymphoma-2 (BCL-2; 1:1,000; catalog no., ab59348; Abcam,
Cambridge, MA, USA); BCL-2-like protein 4 (1:1,000; catalog no.,
ab32503; Abcam); p-gp (1:500; catalog no., ab103477; Abcam); and
β-actin (1:1,000; catalog no., ab8227; Abcam). Membranes were
washed with TBST (three washes, 7 min), followed by incubation with
secondary antibody (anti-rabbit; catalog no., 074–1506; KPL,
Gaithersburg, MD, USA) at room temperature for 2 h. Membranes were
then washed with TBST (four times, 10 min) and visualized with a
chemiluminescence kit (Invitrogen; Thermo Fisher Scientific, Inc.).
A total of three repeats were performed for each antibody.
Statistical analysis
All data were expressed as the mean ± standard
deviation. Statistical analyses were performed using SPSS 18.0
software (SPSS Inc., Chicago, IL, USA). Multiple group comparisons
were analyzed with one-way analysis of variance; 2-group
comparisons were performed with Student's t test. P<0.05 was
considered to indicate a statistically significant difference.
Results
Establishment of the
VP16/DDP-resistant cell line H446/EP
Subsequent to continuous exposure to increasing
concentrations of VP16 and DDP in vitro for 10 months, the
VP16/DDP-resistant H446/EP cell line was established. Analysis
suggested that the phenotypic diversity of the two cell lines was
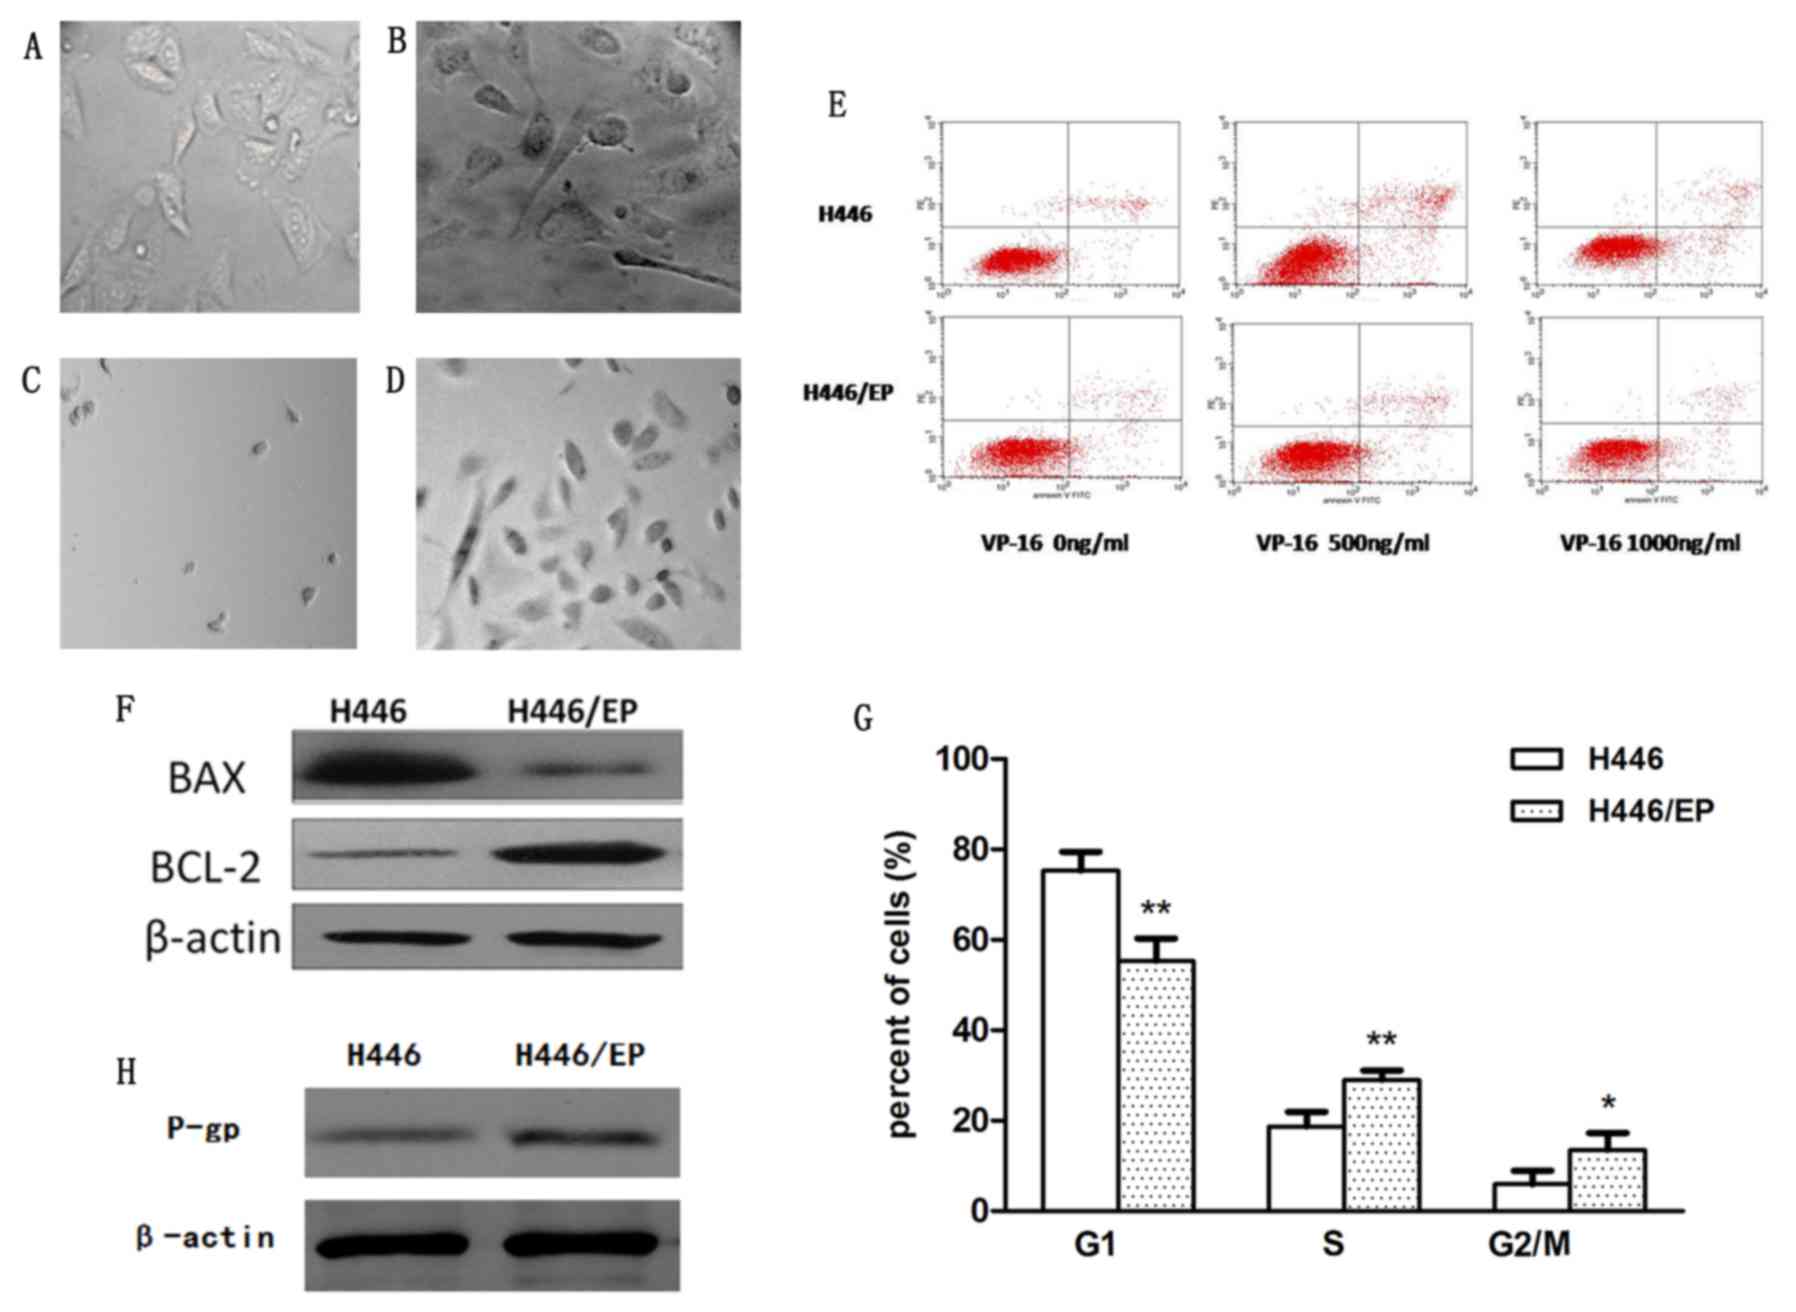
significant. The parental cells (Fig.
1A) appeared to be small, and mainly round and spindle shaped.
In contrast, the H446/EP cells (Fig.
1B) were characterized as irregular polygons, with increased
cell sizes and more intracellular metastasis. The H446/EP cells
exhibited more slender pseudopodia prior to cell-fusion, which
indicated an aptitude for metastasis. Subsequent to treatment with
VP16 and DDP, H446 cells (Fig. 1C)
appeared almost completely dead compared with H446/EP cells
(Fig. 1D), which were stabilized with
normal cell morphology.
As illustrated in Table
I, The IC50, or the drug concentration at which cell
growth is inhibited by 50%, values for VP16 in the H446 and H446/EP
cells were 0.35±0.15 and 19.25±1.49 µg/ml, respectively. The
resistance indices of H446/EP cells to diverse anticancer drugs,
VP16, DDP, epirubicin, paclitexal, vinorelbine and CPT-11 were
significantly higher compared with those in H446. The result
indicated that VP16/DDP-resistant cells also exhibited
cross-resistance to other drugs.
 | Table I.IC50 and RI values of H446
and H446/EP cell lines. |
Table I.
IC50 and RI values of H446
and H446/EP cell lines.
|
| IC50
(mean ± SD) |
|
|---|
|
|
|
|
|---|
| Drug | H446 | H446/EP | RI |
|---|
| VP16 |
0.35±0.15 |
19.25±1.49a | 55 |
| DDP |
0.52±0.29 |
14.56±1.35a | 28 |
| EPI | 0.65±0.34 | 5.32±0.27 | 8.18 |
| TAX | 0.11±0.43 | 0.57±0.60 | 5.18 |
| NVB | 3.39±1.35 | 7.32±1.84 | 2.16 |
| CPT-11 | 21.43±2.45 | 98.87±6.95 | 4.61 |
The apoptotic rates of H446 and H446/EP increased in
a dose-dependent manner subsequent to treatment with VP-16 for 72 h
(Table II; Fig. 1E). The H446/EP cell line exhibited a
slightly increased apoptotic rate (P<0.05) compared with the
H446 cell line, although the two cell lines exhibited almost the
same apoptotic rate without administration of VP-16 (Fig. 1F).
| Table II.Apoptotic rates of the H446 and
H446/EP cells. |
Table II.
Apoptotic rates of the H446 and
H446/EP cells.
| Group | Apoptotic rate
(mean ± standard deviation %) |
|---|
| H446 | 5.44±0.45 |
| H446 (VP16 500
ng/ml) |
11.71±0.54a |
| H446(VP16 1,000
ng/ml) |
18.42±0.51a,b |
| H446/EP | 5.72±0.55 |
| H446/EP (VP16 500
ng/ml) | 6.97±1.67 |
| H446/EP (VP16 1,000
ng/ml) |
8.6±0.47c |
The cell cycle distribution demonstrated a marked
change (Fig. 1G). The H446/EP cell
line was observed to gradually increase the S phase and G2/M
population (P<0.05). This increase was accompanied by a
concomitant decrease of the cell number in the G1 phase
(P<0.01).
The expression level of the P-glycoprotein (P-gP)
was significantly higher in the H446/EP cell line compared with the
H446 cell line, indicating the increase of P-gP excretion in the
drug-resistant cells (Fig. 1H). The
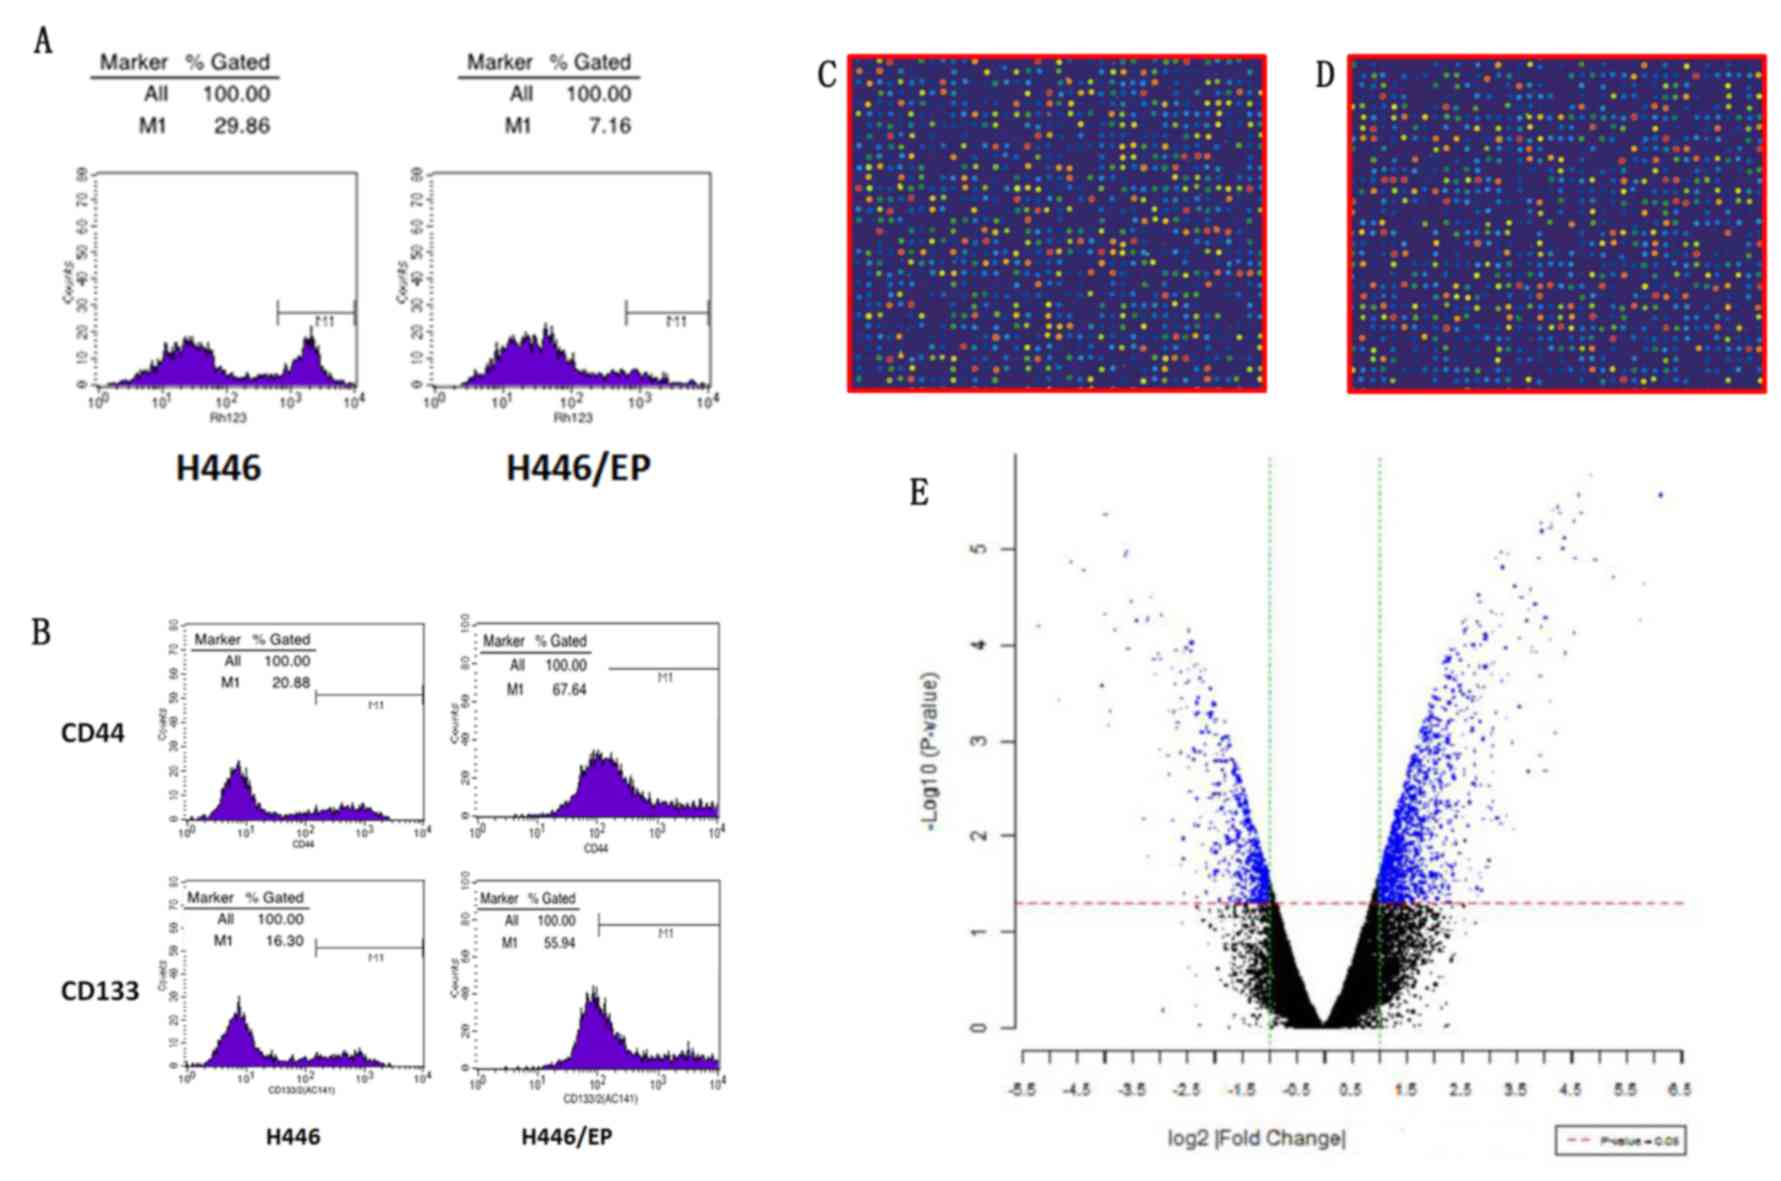
ratios of accumulation of rhodamine fluorescence were 28.94±1.32%
in H446 and 6.97±0.56% in H446/EP. The H446/EP cell line
demonstrated a lower accumulation rate (P<0.05), compared with
H446 (Fig. 2A).
As illustrated in Fig.
2B, the H446/EP cell line demonstrated a higher CD44+/CD133+
expression compared with the H446 cell line (P<0.01), and the
CD44-/CD133- expression was lower (P<0.01).
mRNA expression profiles in the H446
and 446/EP cell lines
As illustrated in Fig. 2C
and D, the signal of microarray hybridization was clear, and
the results of local fluorescence hybridization were selected to
distinguish the differences in gene expression. Subsequent to
t-test analysis, significant differential expressed genes
were presented in blue in the scatterplot (Fig. 2E).
Compared with H446/EP, 115 genes were expressed
differently (log2, |fold change |≥3), of which 75 genes
were upregulated and 40 were downregulated. Based on an analysis of
the literature and significant sequences of fold change, the
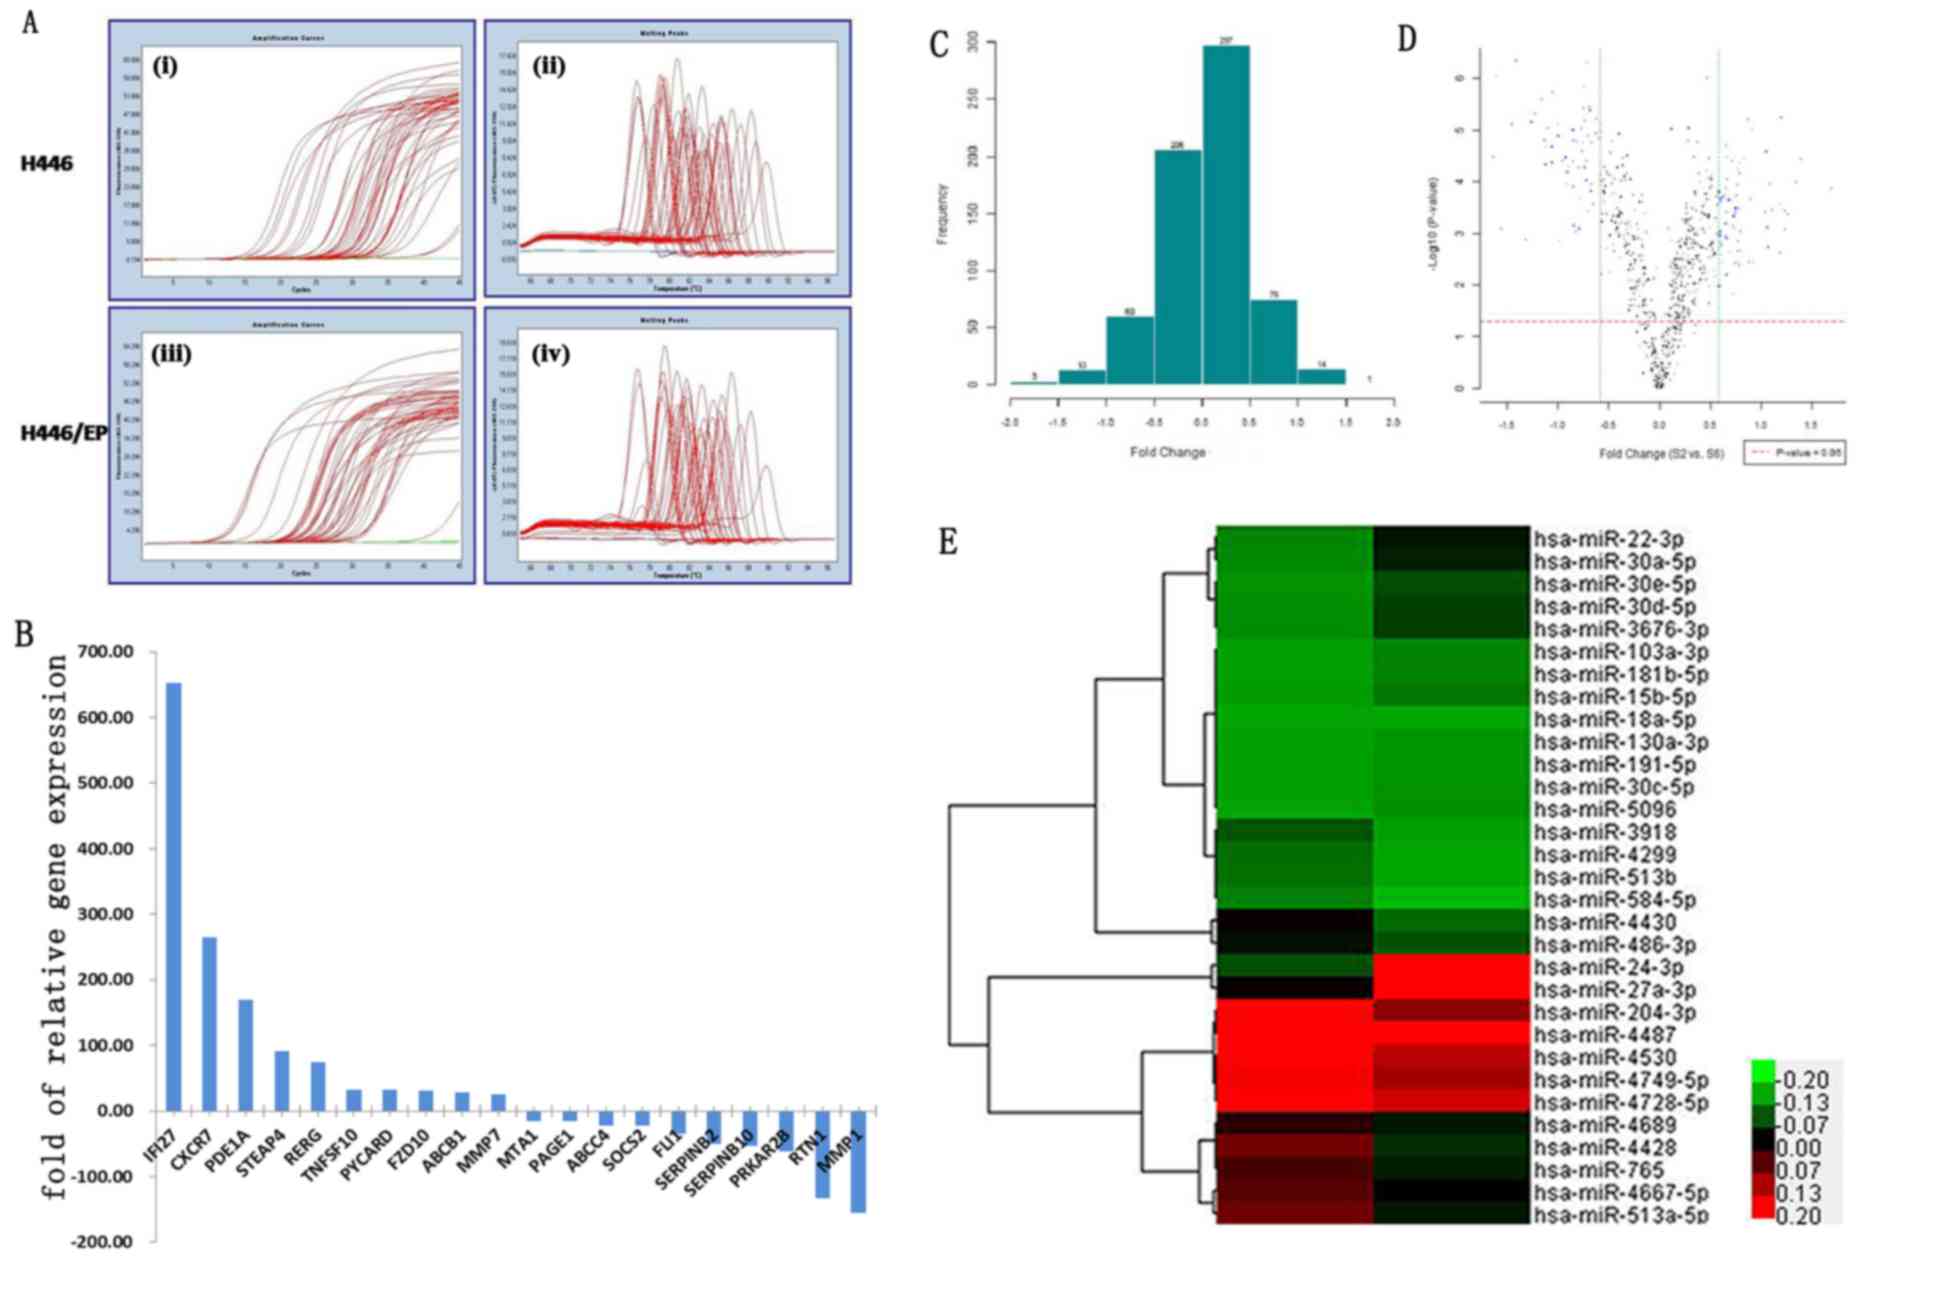
differences in the mRNA expression of 42 genes (Table III) were verified via RT-qPCR. PCR
amplification and melting curves were as illustrated in Fig. 3A. The RT-qPCR results were 95.2%
consistent with the high throughput microarray analysis results.
The top 10 downregulated and 10 upregulated genes are demonstrated
in Fig. 3B.
| Table III.Differential expression of genes of
H446 cells vs. H446/EP cells. |
Table III.
Differential expression of genes of
H446 cells vs. H446/EP cells.
| Gene | Fold change | P-value |
|---|
| ABCC6 | 1.23a | 0.810 |
| CDKN2B |
17.03 | 0.050 |
| IFI27 | 652.58 | 0.000 |
| MMP7 |
25.11 | 0.055 |
| ABCB1 |
28.05 | 0.040 |
| HSD17B2 |
6.96a | 0.140 |
| RTN1 | 133.44a | 0.010 |
| TNFSF10 |
32.45 | 0.020 |
| SOCS2 |
22.47a | 0.040 |
| NFE2 |
6.68a | 0.150 |
| FIBIN |
2.79 | 0.210 |
| FZD10 |
30.91 | 0.036 |
| PYCARD |
32.00 | 0.035 |
| CNRIP1 |
4.96a | 0.205 |
| KCTD12 |
6.50a | 0.158 |
| GNG4 |
9.38a | 0.116 |
| TRPC7 |
15.35a | 0.077 |
| TCEA3 |
2.89 | 0.238 |
| FLI1 |
35.51a | 0.030 |
| MTA1 |
15.35a | 0.050 |
| ITGB2 |
7.46a | 0.138 |
| ANPEP |
9.38a | 0.118 |
| PLAC8 |
5.98 | 0.484 |
| LUM |
15.25a | 0.068 |
| MMP1 | 155.42a | 0.012 |
| ROR2 |
4.69 | 0.115 |
| NTSR1 |
11.16a | 0.090 |
| SERPINB2 |
50.91a | 0.021 |
| PDE1A | 168.90 | 0.011 |
| DUSP10 |
3.63 | 0.235 |
| SERPINB10 |
52.71a | 0.024 |
| PLS1 |
11.96 | 0.157 |
| SDR16C5 |
1.35a | 0.747 |
| PRKAR2B |
61.39a | 0.020 |
| KCTD12 |
3.12a | 0.326 |
| PAGE1 |
15.35a | 0.050 |
| ABCG1 |
16.22 | 0.077 |
| CYGB |
2.20a | 0.450 |
| CXCR7 | 265.03 | 0.013 |
| STEAP4 |
91.14 | 0.021 |
| RERG |
74.54 | 0.025 |
| KRT81 |
1.88a | 0.530 |
miRNA expression profiles in the H446
and H446/EP cell lines
The H446 and H446/EP cell lines demonstrated
significant differences in the expression of miRNA (Fig. 3C and D). Compared with H446/EP, 31
miRNA were expressed differently (log2 |fold change| ≥1), of which
15 were upregulated and 16 were downregulated. In addition, a
hierarchical cluster analysis based on the expression patterns of
these miRNAs accurately separated the H446/EP cells from the H446
cells (Fig. 3E).
Bioinformatic analysis
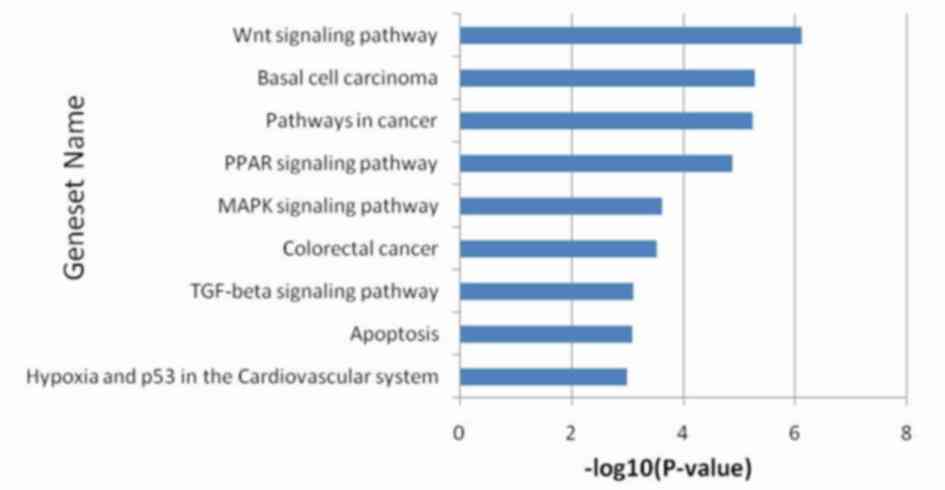
As described above, there were 115 genes which
exhibited marked differences in gene expression. The pathway
enrichment analysis revealed that the main changes were
concentrated in the tumor protein (p) 53 hypoxia pathway,
apoptosis, the transforming growth factor β signaling pathway,
colorectal cancer, the mitogen activated protein kinase signaling
pathway, the peroxisome proliferator-activated receptor signaling
pathway, pathways in cancer (including oncogenesis, proliferation,
differentiation and apoptosis), basal cell carcinoma and the Wnt
signaling pathway (Fig. 4).
Discussion
Although the number of clinical experiences of SCLC
have increased, additional insight into the bionomics and effective
treatment of this disease are required (17). The establishment of viable cell lines
is essential for the study of SCLC oncogenesis, development,
invasion, metastasis, and drug-resistance. Obtaining drug-resistant
cells by interval or continuous exposure to chemotherapy drugs
in vitro, resembling a clinical scenario, has use in
investigating the mechanisms of clinical drug resistance. Previous
studies have usually developed resistant cells through
administrating one single drug, which is inconsistent with clinical
scenarios. The H446/EP cell line is a reliable multidrug-resistant
cell subline of human SCLC developed through continuous exposure to
increasing concentrations of VP16/DDP. The H446/EP cells exhibited
alterations in morphology compared with the parental cells, which
inferred increases in invasion and metastasis capabilities.
Apoptosis is programmed cell death, and apoptosis
induced by chemotherapeutic agents serves an important role in the
anticancer activity of the cell (18). The specific mechanism of inhibited
cell proliferation and induced cell death caused by anticancer
drugs is complicated, amongst which accelerated apoptosis is one of
the important mechanisms. In the present study, flow cytometry
demonstrated a minimal change in the rate of apoptosis for the
H446/EP cells compared with the H446 cells subsequent to incubation
with VP16 for 72 h. The western blot of P-gP illustrated that the
increase of P-gP excretion in H446/EP may be a potential mechanism
of drug resistance (19). These data
indicate that the drug-resistant cell line does not possess the
biological apoptosis mechanisms that are induced by chemotherapy
drugs, and it may be one of the potential mechanisms of drug
resistance of SCLC.
CD44 and CD133 are important markers of lung cancer
stem cells, and cancer stem cells serve an important role in the
early diagnosis, survival, proliferation, metastasis and recurrence
of lung cancer (20). Cancer stem
cells maintain the vitality of cancer cells by self-renewal and
unlimited proliferation. The results demonstrated that the
proportion of CD44+/CD133+ cells increased significantly,
indicating the activation, growth and proliferation of the lung
cancer stem cells, and may partly explain the drug resistance in
SCLC.
A previous study considered nine gene mutations to
be the key drivers of SCLC, including the inactivation of antigen
p53 and retinoblastoma-associated protein (RB1), recombinant mutant
of histone modification gene CREB binding protein, E1A binding
protein P300 and myeloid/lymphoid mixed-lineage leukemia 1,
together with phosphatase and tensin homolog (PTEN), Slit guidance
ligand 2, Cordon bleu WH2 repeat protein and EPHA receptor 7.
Additionally, amplification of fibroblast growth factor 1, deletion
of chromosome 3p, 13q, RB1, and 17p, p53, and acquisition of
chromosome 3q, SRY-Box 2 (SOX2) and 5p were also significant
(21). Rudin et al (22) confirmed the significance of 22 special
gene mutations including p53, RB1,
phosphatidylinositol-4,5-Bisphosphate 3-Kinase Catalytic Subunit α,
cyclin-dependent kinase inhibitor 2A, PTEN, SOX2 and rearranged
L-myc fusion-v-myc avian myelocytomatosis viral oncogene lung
carcinoma derived homolog in the pathogenesis of SCLC. The
expression of suppressor of cytokine signalling 2 was positively
proportional to the malignance of cancer cells, but the exact
drug-resistant mechanism requires additional examination (23). Reversing the silence of
apoptosis-associated speck-like protein promotes apoptosis whilst
treating cancer cells with DNA damaging agent (24). Phosphodiestera-1A (PDE1A), which may
induce the growth inhibition and cycle capture of Jurkat cell
(25), was predicted to be one cause
of MDR in the H446 cell line, as the expression of PDE1A in the
H446 cells was 168.9-fold higher compared with that in H446/EP.
Reticulon-1 (RTN1) associated with intracellular transport, cell
division, migration and apoptosis, were expressed in the majority
of neuroendocrine tumor cells including SCLC and neuroblastoma
(26). The expression of RTN1 in
H446/EP cells was 133.44-fold higher compared with that in H446
cells, which indicated that neuroendocrine may be relevant to MDR
of SCLC.
Previous studies have demonstrated that miRNAs
function as important posttranscriptional regulators in the
biological and pathological processes of lung cancer cells
(27), but the associations with
chemoresistance have not been fully characterized. Multiple miRNAs
may target a single mRNA, whilst a single miRNA may regulate a
number of mRNA molecules (28). In
the present study, 31 differentially expressed miRNAs were
identified between the parental and drug resistant SCLC cells,
consistent with previous reports. miRNA (miR)-27a is suggested to
serve important roles in proliferation and drug resistance of
gastric cancer as a useful target for cancer therapy (29,30), and
contributes to the chemoresistance of lung adenocarcinoma cells to
cisplatin (31). By downregulating
RegIV, miR-24 functions as a novel tumor suppressor in gastric
cancer (32). Compared with the
parental cell SGC-7901, miR-5096 is downregulated in the
5-Fluorouracil-induced drug-resistant cell line (33). The overexpression of miR-103a inhibits
growth, invasion and migration of gastric cancer cells by
suppressing the transcriptional activator Myb gene (34).
Multiple genes and miRNAs are involved in the
resistance to chemotherapy for SCLC. Gene-chip techniques are
effective in screening drug resistant genes involved in multidrug
resistance of SCLC, which may reveal the mechanism of drug
resistance and discover novel therapeutic targets. The data of the
present study suggests the role of miRNAs and their molecular
targets in drug resistance, and provides a novel data investigating
chemo-sensitizing strategies through the manipulation of mRNA and
miRNA expressions.
Acknowledgements
The present study was supported by the National
Natural Science Foundation of China (grant no. 81402492) and the
Natural Science Foundation of Jinling Hospital (grant nos. 2013060
and 2014013).
Glossary
Abbreviations
Abbreviations:
|
SCLC
|
small-cell lung cancer
|
|
DDP
|
cisplatin
|
|
VP16
|
etoposide
|
|
VP16/DDP
|
VP16 combined with DDP
|
|
MDR
|
multidrug resistance
|
|
IC50
|
half maximal inhibitory
concentration
|
References
|
1
|
Torre LA, Bray F, Siegel RL, Ferlay J,
Lortet-Tieulent J and Jemal A: Global cancer statistics, 2012. CA
Cancer J Clin. 65:87–108. 2015. View Article : Google Scholar : PubMed/NCBI
|
|
2
|
Siegel R, Ma J, Zou Z and Jemal A: Cancer
statistics, 2014. CA Cancer J Clin. 64:9–29. 2014. View Article : Google Scholar : PubMed/NCBI
|
|
3
|
Lara PN Jr, Chansky K, Shibata T, Fukuda
H, Tamura T, Crowley J, Redman MW, Natale R, Saijo N and Gandara
DR: Common arm comparative outcomes analysis of phase 3 trials of
cisplatin + irinotecan versus cisplatin + etoposide in extensive
stage small cell lung cancer: Final patient-level results from
Japan Clinical Oncology Group 9511 and Southwest Oncology Group
0124. Cancer. 116:5710–5715. 2010. View Article : Google Scholar : PubMed/NCBI
|
|
4
|
Longley DB and Johnston PG: Molecular
mechanisms of drug resistance. J Pathol. 205:275–292. 2005.
View Article : Google Scholar : PubMed/NCBI
|
|
5
|
Luqmani YA: Mechanisms of drug resistance
in cancer chemotherapy. Med Princ Pract. 14 Suppl 1:S35–S48. 2005.
View Article : Google Scholar
|
|
6
|
Chekanova JA and Belostotsky DA: MicroRNAs
and messenger RNA turnover. Methods Mol Biol. 342:73–85.
2006.PubMed/NCBI
|
|
7
|
Martello G, Rosato A, Ferrari F, Manfrin
A, Cordenonsi M, Dupont S, Enzo E, Guzzardo V, Rondina M, Spruce T,
et al: A MicroRNA targeting dicer for metastasis control. Cell.
141:1195–1207. 2010. View Article : Google Scholar : PubMed/NCBI
|
|
8
|
Mo YY: MicroRNA regulatory networks and
human disease. Cell Mol Life Sci. 69:3529–3531. 2012. View Article : Google Scholar : PubMed/NCBI
|
|
9
|
Hwang HW and Mendell JT: MicroRNAs in cell
proliferation, cell death and tumorigenesis. Br J Cancer.
94:776–780. 2006. View Article : Google Scholar : PubMed/NCBI
|
|
10
|
Jansson MD and Lund AH: MicroRNA and
cancer. Mol Oncol. 6:590–610. 2012. View Article : Google Scholar : PubMed/NCBI
|
|
11
|
Ladeiro Y, Couchy G, Balabaud C,
Bioulac-Sage P, Pelletier L, Rebouissou S and Zucman-Rossi J:
MicroRNA profiling in hepatocellular tumors is associated with
clinical features and oncogene/tumor suppressor gene mutations.
Hepatology. 47:1955–1963. 2008. View Article : Google Scholar : PubMed/NCBI
|
|
12
|
Ge YZ, Xin H, Lu TZ, Xu Z, Yu P, Zhao YC,
Li MH, Zhao Y, Zhong B, Xu X, et al: MicroRNA expression profiles
predict clinical phenotypes and prognosis in chromophobe renal cell
carcinoma. Sci Rep. 5:103282015. View Article : Google Scholar : PubMed/NCBI
|
|
13
|
Zhang H, Li M, Han Y, Hong L, Gong T, Sun
L and Zheng X: Down-regulation of miR-27a might reverse multidrug
resistance of esophageal squamous cell carcinoma. Dig Dis Sci.
55:2545–2551. 2010. View Article : Google Scholar : PubMed/NCBI
|
|
14
|
Farazi TA, Hoell JI, Morozov P and Tuschl
T: MicroRNAs in human cancer. Adv Exp Med Biol. 774:1–20. 2013.
View Article : Google Scholar : PubMed/NCBI
|
|
15
|
Housman G, Byler S, Heerboth S, Lapinska
K, Longacre M, Snyder N and Sarkar S: Drug resistance in cancer: An
overview. Cancers (Basel). 6:1769–1792. 2014. View Article : Google Scholar : PubMed/NCBI
|
|
16
|
Livak KJ and Schmittgen TD: Analysis of
relative gene expression data using real-time quantitative PCR and
the 2(−Delta Delta C(T)) method. Methods. 25:402–408. 2001.
View Article : Google Scholar : PubMed/NCBI
|
|
17
|
El-Khoury V, Breuzard G, Fourre N and
Dufer J: The histone deacetylase inhibitor trichostatin A
downregulates human MDR1 (ABCB1) gene expression by a
transcription-dependent mechanism in a drug-resistant small cell
lung carcinoma cell line model. Br J Cancer. 97:562–573. 2007.
View Article : Google Scholar : PubMed/NCBI
|
|
18
|
Hodkinson PS, Mackinnon AC and Sethi T:
Extracellular matrix regulation of drug resistance in small-cell
lung cancer. Int J Radiat Biol. 83:733–741. 2007. View Article : Google Scholar : PubMed/NCBI
|
|
19
|
Yeh JJ, Hsu NY, Hsu WH, Tsai CH, Lin CC
and Liang JA: Comparison of chemotherapy response with
P-glycoprotein, multidrug resistance-related protein-1, and lung
resistance-related protein expression in untreated small cell lung
cancer. Lung. 183:177–183. 2005. View Article : Google Scholar : PubMed/NCBI
|
|
20
|
Cichy J, Kulig P and Puré E: Regulation of
the release and function of tumor cell-derived soluble CD44.
Biochim Biophys Acta. 1745:59–64. 2005. View Article : Google Scholar : PubMed/NCBI
|
|
21
|
Peifer M, Fernández-Cuesta L, Sos ML,
George J, Seidel D, Kasper LH, Plenker D, Leenders F, Sun R, Zander
T, et al: Integrative genome analyses identify key somatic driver
mutations of small-cell lung cancer. Nat Genet. 44:1104–1110. 2012.
View Article : Google Scholar : PubMed/NCBI
|
|
22
|
Rudin CM, Durinck S, Stawiski EW, Poirier
JT, Modrusan Z, Shames DS, Bergbower EA, Guan Y, Shin J, Guillory
J, et al: Comprehensive genomic analysis identifies SOX2 as a
frequently amplified gene in small-cell lung cancer. Nat Genet.
44:1111–1116. 2012. View
Article : Google Scholar : PubMed/NCBI
|
|
23
|
Hoefer J, Kern J, Ofer P, Eder IE, Schäfer
G, Dietrich D, Kristiansen G, Geley S, Rainer J, Gunsilius E, et
al: SOCS2 correlates with malignancy and exerts growth-promoting
effects in prostate cancer. Endocr Relat Cancer. 21:175–187. 2014.
View Article : Google Scholar : PubMed/NCBI
|
|
24
|
Hong S, Hwang I, Lee YS, Park S, Lee WK,
Fernandes-Alnemri T, Alnemri ES, Kim YS and Yu JW: Restoration of
ASC expression sensitizes colorectal cancer cells to genotoxic
stress-induced caspase-independent cell death. Cancer Lett.
331:183–191. 2013. View Article : Google Scholar : PubMed/NCBI
|
|
25
|
Abusnina A, Alhosin M, Keravis T, Muller
CD, Fuhrmann G, Bronner C and Lugnier C: Down-regulation of cyclic
nucleotide phosphodiesterase PDE1A is the key event of p73 and
UHRF1 deregulation in thymoquinone-induced acute lymphoblastic
leukemia cell apoptosis. Cell Signal. 23:152–160. 2011. View Article : Google Scholar : PubMed/NCBI
|
|
26
|
Yan R, Shi Q, Hu X and Zhou X: Reticulon
proteins: emerging players in neurodegenerative diseases. Cell Mol
Life Sci. 63:877–889. 2006. View Article : Google Scholar : PubMed/NCBI
|
|
27
|
Du L and Pertsemlidis A: microRNA
regulation of cell viability and drug sensitivity in lung cancer.
Expert Opin Biol Ther. 12:1221–1239. 2012. View Article : Google Scholar : PubMed/NCBI
|
|
28
|
Cherni I and Weiss GJ: miRNAs in lung
cancer: Large roles for small players. Future Oncol. 7:1045–1055.
2011. View Article : Google Scholar : PubMed/NCBI
|
|
29
|
Zhao X, Yang L and Hu J: Down-regulation
of miR-27a might inhibit proliferation and drug resistance of
gastric cancer cells. J Exp Clin Cancer Res. 30:552011. View Article : Google Scholar : PubMed/NCBI
|
|
30
|
Tian Y, Fu S, Qiu GB, Xu ZM, Liu N, Zhang
XW, Chen S, Wang Y, Sun KL and Fu WN: MicroRNA-27a promotes
proliferation and suppresses apoptosis by targeting PLK2 in
laryngeal carcinoma. BMC Cancer. 14:6782014. View Article : Google Scholar : PubMed/NCBI
|
|
31
|
Li J, Wang Y, Song Y, Fu Z and Yu W:
miR-27a regulates cisplatin resistance and metastasis by targeting
RKIP in human lung adenocarcinoma cells. Mol Cancer. 13:1932014.
View Article : Google Scholar : PubMed/NCBI
|
|
32
|
Duan Y, Hu L, Liu B, Yu B, Li J, Yan M, Yu
Y, Li C, Su L, Zhu Z, et al: Tumor suppressor miR-24 restrains
gastric cancer progression by downregulating RegIV. Mol Cancer.
13:1272014. View Article : Google Scholar : PubMed/NCBI
|
|
33
|
Wang Y, Gu X, Li Z, Xiang J, Jiang J and
Chen Z: microRNA expression profiling in multidrug resistance of
the 5-Fu-induced SGC7901 human gastric cancer cell line. Mol Med
Rep. 7:1506–1510. 2013.PubMed/NCBI
|
|
34
|
Liang J, Liu X, Xue H, Qiu B, Wei B and
Sun K: MicroRNA-103a inhibits gastric cancer cell proliferation,
migration and invasion by targeting c-Myb. Cell Prolif. 48:78–85.
2015. View Article : Google Scholar : PubMed/NCBI
|