Introduction
Esophageal cancer may be treated with three
modalities, namely surgery, chemotherapy and radiotherapy (1–3). Recent
advances in esophageal cancer treatment may be attributed to
improvements in surgical techniques (4), perioperative management and chemotherapy
(5,6).
Programmed death-ligand 1 (PD-1/PD-L1) inhibition therapy is
currently emerging as a promising option (7,8), and its
clinical benefit has been suggested in esophageal cancer (9). This treatment has the potential to be a
fourth modality for treating esophageal cancer in the future.
In general, immunotherapy may be effective for
treating tumors harboring thousands of mutations. It is postulated
that an increased number of mutation-associated neoantigens
stimulate the host immune system. In fact, Le et al
(10) demonstrated that mismatch
repair (MMR)-deficient tumors are more responsive to PD-1 blockade
compared with MMR-proficient tumors, possibly as MMR deficiency
results in a higher rate of point mutation. Therefore, MMR status
may be a predictive factor for the response to PD-1/PD-L1
inhibition therapy (10).
PD-L1 expression is a way for tumors to evade the
immune system. Thus, tumor PD-L1 expression may be used as a
predictive biomarker for the response to PD-1/PD-L1 inhibition
therapy, as suggested previously (11). In this scenario, the MMR-deficient
tumor, which exhibits enhanced antigenicity as the result of a high
rate of mutation, may have a mechanism that increases PD-L1
expression and thereby assists the tumor in evading the immune
system. However, little is known about the association between MMR
status and PD-L1 expression in esophageal cancer.
MMR-deficient cancer arises from an inherited
mutation in an MMR gene or by epigenetic suppression of MMR gene
expression (12). In esophageal
cancer, hypermethylation of the MLH1 promoter appears to be
involved in MMR deficiency (13). In
colorectal cancer, MMR-deficient tumors are associated with
improved survival (14,15), although they are not sensitive to
5-fluorouracil (5-FU)-based chemotherapy (12,16,17). These
characteristics have not been validated adequately in esophageal
cancer. The purpose of the present study was to investigate the
association between MLH1 expression and prognosis, response to
therapy and PD-L1 expression in esophageal cancer.
Patients and methods
Study population
Of the patients who underwent esophagectomy in Osaka
University Hospital (Suita, Osaka, Japan) between August 2000 and
January 2013, 251 patients met the following criteria and were
included in this analysis: i) R0 resection was performed; ii)
written informed consent was obtained; iii) surgical specimens were
available for analysis; and iv) for cases with preoperative
therapy, remaining cancer tissue was detected microscopically. The
Union for International Cancer Control Tumor-Node-Metastasis
classification (7th edition) was used for staging (18). The present study was approved by the
Institutional Review Board of Osaka University Hospital.
Treatment protocol
The basic strategy for esophageal cancer treatment
was as follows: Chemoradiotherapy, described previously (19), as the initial treatment for patients
with cT4 cancer, and surgical resection was performed in patients
who received an initial and then a revised diagnosis of disease
exhibiting the cancer invasion of adjacent organs. Preoperative
chemotherapy followed by surgery was indicated for patients with
cN1 and/or cM1lym with cT1-3 tumors. Surgery was indicated for
patients with cT1-3N0 tumors without preoperative treatment between
January 2005 and January 2009; subsequent to January 2009,
preoperative chemotherapy followed by surgery was indicated for
patients with cT2-3N0 tumors. Surgery was performed 4–8 weeks after
preoperative chemotherapy.
Postoperative follow-up evaluations were performed
every 3–4 months for the first 2 years and every 6 months
thereafter by computed tomography scanning plus annual endoscopy
for 5 years.
Evaluation of the histological
response to preoperative therapy
The histological response to preoperative therapy
was evaluated using the proportion of viable cancer cells according
to the Japanese Society for Esophageal Diseases criteria (20,21): Grade
0, no histological effect; grade 1a, viable cancer cells accounted
for more than two-thirds of the tumor tissue; grade 1b, viable
cancer cells accounted for between one-third and two-thirds of the
tumor tissue; grade 2, viable cancer cells account for less than
one-third of the tumor tissue; and grade 3, no residual viable
cancer cells. Grade 3 samples were excluded from the present study
as aforementioned. Patients with grade 0 or 1a disease were defined
as non-responders and those with grade 1b or 2 disease as
responders.
MLH1 immunohistochemistry
Tissue sections measuring 3.5-µm thick were prepared
from formalin-fixed, paraffin-embedded (FFPE) blocks. The tissue
slides were deparaffinized in xylene and then rehydrated through
graded ethanol solutions. For antigen retrieval, the slides were
incubated in 10 mM citrate buffer (pH 6.0) at 110°C for 20 min.
Endogenous peroxidase activity was blocked by incubation in 0.3%
hydrogen peroxide for 20 min at room temperature. The slides were
then incubated overnight with the specific primary antibody, a
mouse anti-MLH1 monoclonal antibody (cat. no. 550838; clone
G168-15; dilution, 1:100; BD Biosciences, Franklin Lakes, NJ, USA)
at 4°C in a moist chamber. A negative control was prepared by
omitting the primary antibody. Antibody binding was visualized
using the ABC peroxidase detection system (Vector Laboratories,
Burlingame, CA, USA). The slides were incubated in
3,3′-diaminobenzidine tetrahydrochloride (DAB) with 0.05% hydrogen
peroxide for 4.5 min. Finally, the slides were counterstained with
0.1% hematoxylin for 30 sec. Normal human tonsil tissue from other
patients was used as a positive control.
Interpreting MLH1 expression in cancer
tissue
MLH1 expression was evaluated according to the
intensity and frequency of positive nuclear-stained cancer cells as
described previously (22). The
staining intensity of each cancer cell was compared with that of
normal epithelium or the positive control. No staining or weaker
intensity staining was defined as negative staining. The same or
stronger intensity staining was defined as positive staining.
Specimens containing >50% positive cancer cells were classified
as high MLH1 expression specimens, and those containing ≤50%
positive cancer cells were classified as low MLH1 expression
specimens. The frequency of the positively stained cells was
assessed throughout the entire section using an optical microscope
at ×20 magnification. The immunohistochemical staining was
independently evaluated by two of the authors who were blinded to
the clinical data.
PD-L1 immunohistochemistry
Tissue sections measuring 3.5-µm thick were prepared
from FFPE blocks. The sections were deparaffinized in xylene and
then rehydrated through graded ethanol solutions. For antigen
retrieval, the slides were incubated in 10 mM citrate buffer (pH
6.5) at 110°C for 10 min. Endogenous peroxidase activity was
blocked by incubation in 0.3% hydrogen peroxide for 20 min at room
temperature. The slides were then incubated for 1 h with the
specific primary antibody, a rabbit anti-PD-L1 monoclonal antibody
(cat. no. M4424; clone SP142; dilution, 1:100; Spring Bioscience,
Pleasanton, CA, USA) at 4°C in a moist chamber. A negative control
was prepared by omitting the primary antibody. Antibody binding was
visualized using the ABC peroxidase detection system (Vector
Laboratories). The slides were incubated in DAB with 0.05% hydrogen
peroxide for 2.5 min. Finally, the slides were counterstained with
0.1% hematoxylin for 30 sec. Normal human placenta tissue from
other patients was used as a positive control.02.
Interpreting PD-L1 expression in
cancer tissue
PD-L1 expression was evaluated according to the
frequency of positive membrane-stained tumor cells (TCs) and
tumor-infiltrating immune cells (ICs), as described previously
(23). Specimens were considered to
have low PD-L1 expression if <5% of the cells were stained, and
were considered to have high PD-L1 expression if ≥5% of the cells
were stained. The frequency of positively stained cells was
assessed throughout the entire section using an optical microscope
at ×20 magnification. Hematoxylin and eosin staining of the serial
section of the FFPE tissue was used to detect ICs. The
immunohistochemical staining was independently evaluated by two of
the authors who were blinded to the clinical data.
Statistical analysis
Continuous variables were expressed as the mean ±
standard deviation, and their associations with PD-L1 or MLH1
expression were assessed using unpaired Student's t-tests. The
associations between categorical variables and PD-L1 or MLH1
expression were assessed using Pearson's χ2 test.
Overall survival (OS) was defined as the elapsed time from the date
of surgery to the date of mortality or last follow-up, and was
calculated using the Kaplan-Meier method, while the log-rank test
was used for comparisons. P<0.05 was considered to indicate a
statistically significant difference. All statistical analyses were
performed using JMP Pro® 11 software (SAS Institute
Inc., Cary, NC, USA).
Results
Patient characteristics
The clinicopathological characteristics of the study
population are summarized in Table I.
The tumor location was the upper esophagus in 50 patients (19.9%),
the middle esophagus in 124 patients (49.4%) and the lower
esophagus in 77 patients (30.7%). Tumor histology was squamous cell
carcinoma in 245 patients (97.6%). A total of 209 patients (83.3%)
underwent preoperative therapy, i.e., chemotherapy alone or
concomitant chemoradiotherapy. There were 62 pT1 patients (24.7%),
56 pT2 patients (22.3%), 128 pT3 patients (51.0%), and 5 pT4
patients (2.0%). There were 88 pN0 patients (35.1%), 95 pN1
patients (37.8%), 48 pN2 patients (19.1%) and 20 pN3 patients
(8.0%). The median follow-up period for the surviving cases was
53.7 months.
 | Table I.Clinicopathological characteristics of
the study population according to MLH1 expression. |
Table I.
Clinicopathological characteristics of
the study population according to MLH1 expression.
|
|
| MLH1 expression |
|
|---|
|
|
|
|
|
|---|
| Characteristic | Total | High | Low | P-value |
|---|
| All patients, n
(%) | 251 | 175 (69.7) | 76 (30.3) |
|
| Sex, n (%) |
|
|
| 0.6820 |
| Male | 218 | 153 (70.2) | 65 (29.8) |
|
|
Female | 33 | 22 (66.7) | 11 (33.3) |
|
| Age,
yearsa | 65.8±9.1 | 65.9±9.7 | 65.3±7.6 | 0.6325 |
| Tumor location, n
(%) |
|
|
| 0.2802 |
|
Upper | 50 | 38 (76.0) | 12 (24.0) |
|
|
Middle | 124 | 87 (70.2) | 37 (29.8) |
|
|
Lower | 77 | 50 (64.9) | 27 (35.1) |
|
| Tumor histology, n
(%) |
|
|
| 0.4626 |
| Squamous
cell carcinoma | 245 | 170 (69.4) | 75 (30.6) |
|
|
Adenocarcinoma | 6 | 5 (83.3) | 1 (16.7) |
|
| Preoperative therapy,
n (%) |
|
|
| 0.1713 |
| + | 209 | 142 (67.9) | 67 (32.1) |
|
| − | 42 | 33 (78.6) | 9 (21.4) |
|
| Pathological depth of
invasion, n (%) |
|
|
| 0.0228 |
| pT1 | 62 | 51 (82.3) | 11 (17.7) |
|
| pT2 | 56 | 41 (73.2) | 15 (26.8) |
|
| pT3 | 128 | 81 (63.3) | 47 (36.7) |
|
| pT4 | 5 | 2 (40.0) | 3 (60.0) |
|
| Pathological lymph
node metastasis, n (%) |
|
|
| 0.3494 |
| pN0 | 88 | 67 (76.1) | 21 (23.9) |
|
| pN1 | 95 | 65 (68.4) | 30 (31.6) |
|
| pN2 | 48 | 31 (64.6) | 17 (35.4) |
|
| pN3 | 20 | 12 (60.0) | 8 (40.0) |
|
| Pathological stage,
n (%) |
|
|
| 0.0553 |
| I | 56 | 47 (83.9) | 9 (16.1) |
|
| II | 61 | 42 (68.9) | 19 (31.1) |
|
|
III | 101 | 66 (65.3) | 35 (34.7) |
|
| IV | 33 | 20 (60.6) | 13 (39.4) |
|
MLH1 immunohistochemical staining and
patient characteristics
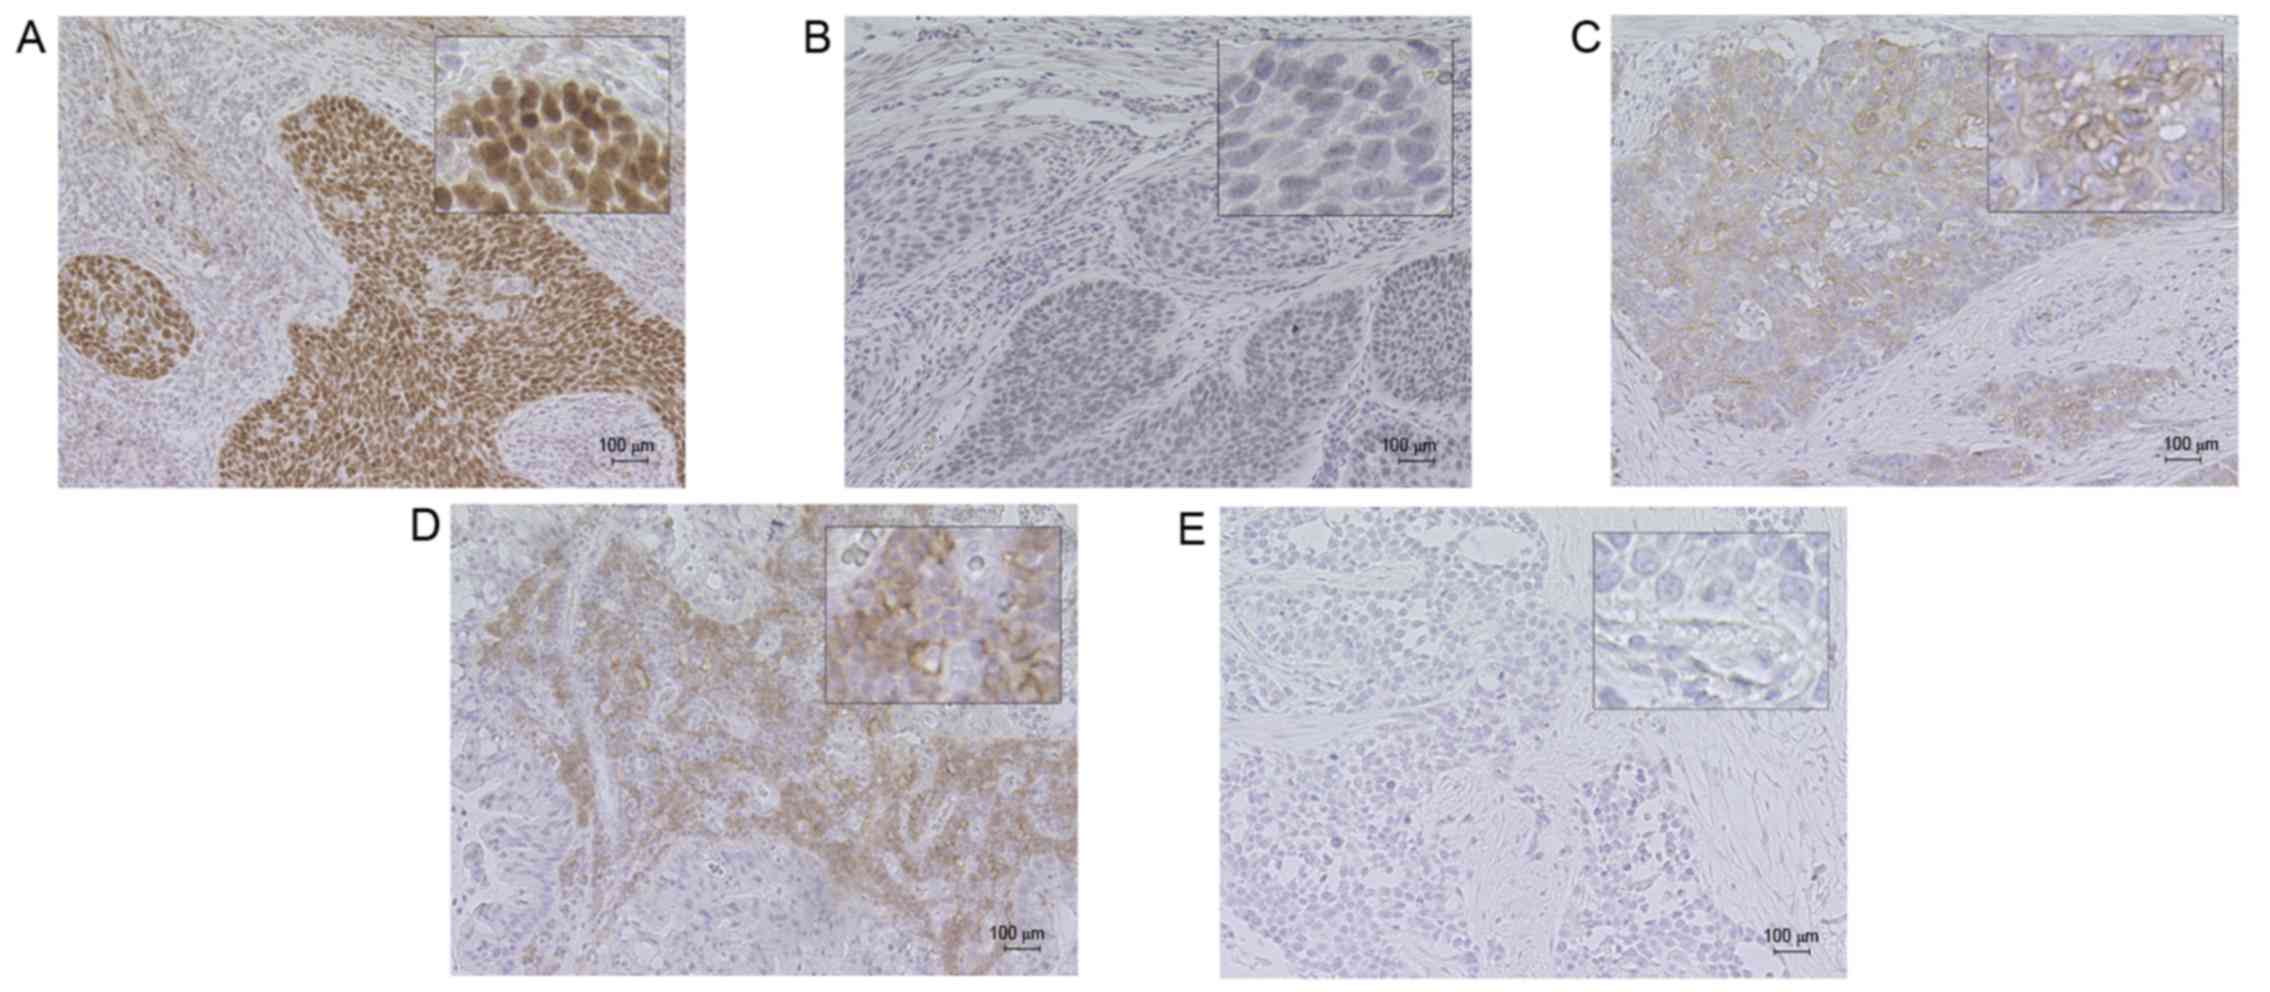
Representative MLH1 immunohistochemical staining is
illustrated in Fig. 1. Cancer cells
typically exhibited nuclear MLH1 immunohistochemical staining, as
suggested previously (20). In
certain patients, the intensity of the stained cells was not
homogeneous. Specifically, cancer cells on the inner side of the
tumor tissue tended to exhibit weaker staining, while cancer cells
at the surface of the tumor tissue tended to exhibit stronger
staining. Low MLH1 expression was identified in 30.3% of the
specimens.
Table I summarizes the
clinicopathological characteristics in the study population
according to MLH1 expression. There were no statistically
significant differences in terms of sex, tumor location, tumor
histology or pathological stage according to MLH1 expression.
Table II summarizes
the histological responses according to MLH1 expression for
patients who underwent preoperative therapy. The ratio of
responders was higher in the high MLH1 expression group compared
with the low MLH1 expression group (P<0.0001).
| Table II.Histological response to preoperative
therapy according to MLH1 expression in the cases with preoperative
therapy. |
Table II.
Histological response to preoperative
therapy according to MLH1 expression in the cases with preoperative
therapy.
|
|
| MLH1
expressiona |
|---|
|
|
|
|
|---|
| Histological
response to preoperative therapy | Total | High, n (%) | Low, n (%) |
|---|
| Non-responder | 130 | 75 (54.3) | 55 (84.6) |
| Responder | 73 | 63 (45.7) | 10 (15.4) |
PD-L1 immunohistochemical staining and
patient characteristics
Fig. 1 demonstrates
representative immunohistochemical staining of PD-L1. Cancer cells
exhibited PD-L1 immunohistochemical staining of the basal
membranes. The distribution of PD-L1-positive cancer cells was very
focalized, and PD-L1-positive cells were commonly observed at the
interface between cancer cells and the stroma with ICs, as
previously identified (23). ICs also
exhibited a membranous PD-L1 staining pattern, with PD-L1-positive
ICs typically observed toward the periphery of the tumor. It was
revealed that 15.5% of the study population exhibited high PD-L1
expression in TCs, and 23.5% exhibited high PD-L1 expression in
ICs. A total of 189 cases (75.3%) demonstrated correspondence
between PD-L1 expression in TCs and ICs.
There were no statistically significant differences
in the clinicopathological characteristics according to PD-L1
expression in ICs and TCs, with the exception of age (Table III).
| Table III.Clinicopathological characteristics
of the study population according to PD-L1 expression. |
Table III.
Clinicopathological characteristics
of the study population according to PD-L1 expression.
|
|
| PD-L1 expression
(TC) |
| PD-L1 expression
(IC) |
|
|---|
|
|
|
|
|
|
|
|---|
| Characteristic | Total | Low | High | P-value | Low | High | P-value |
|---|
| Total, n (%) | 251 | 212 (84.5) | 39 (15.5) |
| 192 (76.5) | 59 (23.5) |
|
| Sex, n (%) |
|
|
| 0.3343 |
|
| 0.584 |
|
Male | 218 | 186 (85.3) | 32 (14.7) |
| 168 (77.1) | 50 (22.9) |
|
|
Female | 33 | 26 (78.8) | 7 (21.2) |
| 24 (72.7) | 9 (27.3) |
|
| Age,
yearsa | 65.8±9.1 | 65.6±9.2 | 66.7±8.7 | 0.5009 | 65.0±9.2 | 68.4±8.5 | 0.0122 |
| Tumor location, n
(%) |
|
|
| 0.1216 |
|
| 0.0324 |
|
Upper | 50 | 39 (78.0) | 11 (22.0) |
| 33 (66.0) | 17 (34.0) |
|
|
Middle | 124 | 103 (83.1) | 21 (16.9) |
| 93 (75.0) | 31 (25.0) |
|
|
Lower | 77 | 70 (90.9) | 7 (9.1) |
| 66 (85.7) | 11 (14.3) |
|
| Tumor histology, n
(%) |
|
|
| 0.2876 |
|
| 0.5656 |
|
Squamous cell carcinoma | 245 | 206 (84.1) | 39 (15.9) |
| 188 (76.7) | 57 (23.3) |
|
|
Adenocarcinoma | 6 | 6 (100.0) | 0 (0.0) |
| 4 (66.7) | 2 (33.3) |
|
| Preoperative
therapy, n (%) |
|
|
| 0.8061 |
|
| 0.653 |
| + | 209 | 176 (84.2) | 33 (15.8) |
| 161 (77.0) | 48 (23.0) |
|
| − | 42 | 36 (85.7) | 6 (14.3) |
| 31 (73.8) | 11 (26.2) |
|
| Pathological depth
of invasion, n (%) |
|
|
| 0.6556 |
|
| 0.9875 |
|
pT1 | 62 | 51 (82.3) | 11 (17.7) |
| 48 (77.4) | 14 (22.6) |
|
|
pT2 | 56 | 49 (87.5) | 7 (12.5) |
| 42 (75.0) | 14 (25.0) |
|
|
pT3 | 128 | 107 (83.6) | 21 (16.4) |
| 98 (76.6) | 30 (23.4) |
|
|
pT4 | 5 | 5 (100.0) | 0 (0.0) |
| 4 (80.0) | 1 (20.0) |
|
| Pathological lymph
node metastasis, n (%) |
|
|
| 0.0997 |
|
| 0.2921 |
|
pN0 | 88 | 78 (88.6) | 10 (11.4) |
| 68 (77.3) | 20 (22.7) |
|
|
pN1 | 95 | 79 (83.2) | 16 (16.8) |
| 77 (81.1) | 18 (18.9) |
|
|
pN2 | 48 | 36 (75.0) | 12 (25.0) |
| 32 (66.7) | 16 (33.3) |
|
|
pN3 | 20 | 19 (95.0) | 1 (5.0) |
| 15 (75.0) | 5 (25.0) |
|
| Pathological stage,
n (%) |
|
|
| 0.7029 |
|
| 0.1713 |
| I | 56 | 48 (85.7) | 8 (14.3) |
| 41 (73.2) | 15 (26.8) |
|
| II | 61 | 54 (88.5) | 7 (11.5) |
| 53 (86.9) | 8 (13.1) |
|
|
III | 101 | 83 (82.2) | 18 (17.8) |
| 73 (72.3) | 28 (27.7) |
|
| IV | 33 | 27 (81.8) | 6 (18.2) |
| 25 (75.8) | 8 (24.2) |
|
For the patients who underwent preoperative therapy,
the ratio of responders to non-responders did not differ according
to PD-L1 expression (Table IV).
| Table IV.Histological response to preoperative
therapy in cases with preoperative therapy according to PD-L1
expression. |
Table IV.
Histological response to preoperative
therapy in cases with preoperative therapy according to PD-L1
expression.
|
|
| PD-L1 expression
(TC)a | PD-L1 expression
(IC)b |
|---|
|
|
|
|
|
|---|
| Histological
response to preoperative therapy | Total | Low, n (%) | High, n (%) | Low, n (%) | High, n (%) |
|---|
| Non-responder | 130 | 107 (62.2) | 23 (74.2) | 97 (62.2) | 33 (68.8) |
| Responder | 73 | 65 (37.8) | 8 (25.8) | 59 (37.8) | 14 (29.2) |
Correlation between PD-L1 expression
and MLH1 expression
PD-L1 expression according to MLH1 expression is
illustrated in Table V. With regard
to TCs, 25.0% of the low MLH1 expression group exhibited high PD-L1
expression, as did 11.4% of the high MLH1 expression group. The
frequency of high PD-L1 expression was significantly higher in the
low MLH1 expression group compared with the high MLH1 expression
group (P=0.0064). With regard to ICs, 17.1% of the low MLH1
expression group exhibited high PD-L1 expression, as did 26.3% of
the high MLH1 expression group. There was no correlation between
PD-L1 expression and MLH1 expression.
| Table V.Correlation between MLH1 expression
and PD-L1 expression in esophageal cancer tissue. |
Table V.
Correlation between MLH1 expression
and PD-L1 expression in esophageal cancer tissue.
|
| PD-L1 expression
(TC) | PD-L1 expression
(IC) |
|---|
|
|
|
|
|---|
| Expression | Low | High | P-value | Low | High | P-value |
|---|
| MLH1
expression |
|
| P=0.0064 |
|
| P=0.1150 |
| High, n
(%) | 155 (88.6) | 20 (11.4) |
| 129 (73.7) | 46 (26.3) |
|
| Low, n
(%) | 57 (75.0) | 19 (25.0) |
| 63 (82.9) | 13 (17.1) |
|
Survival analysis
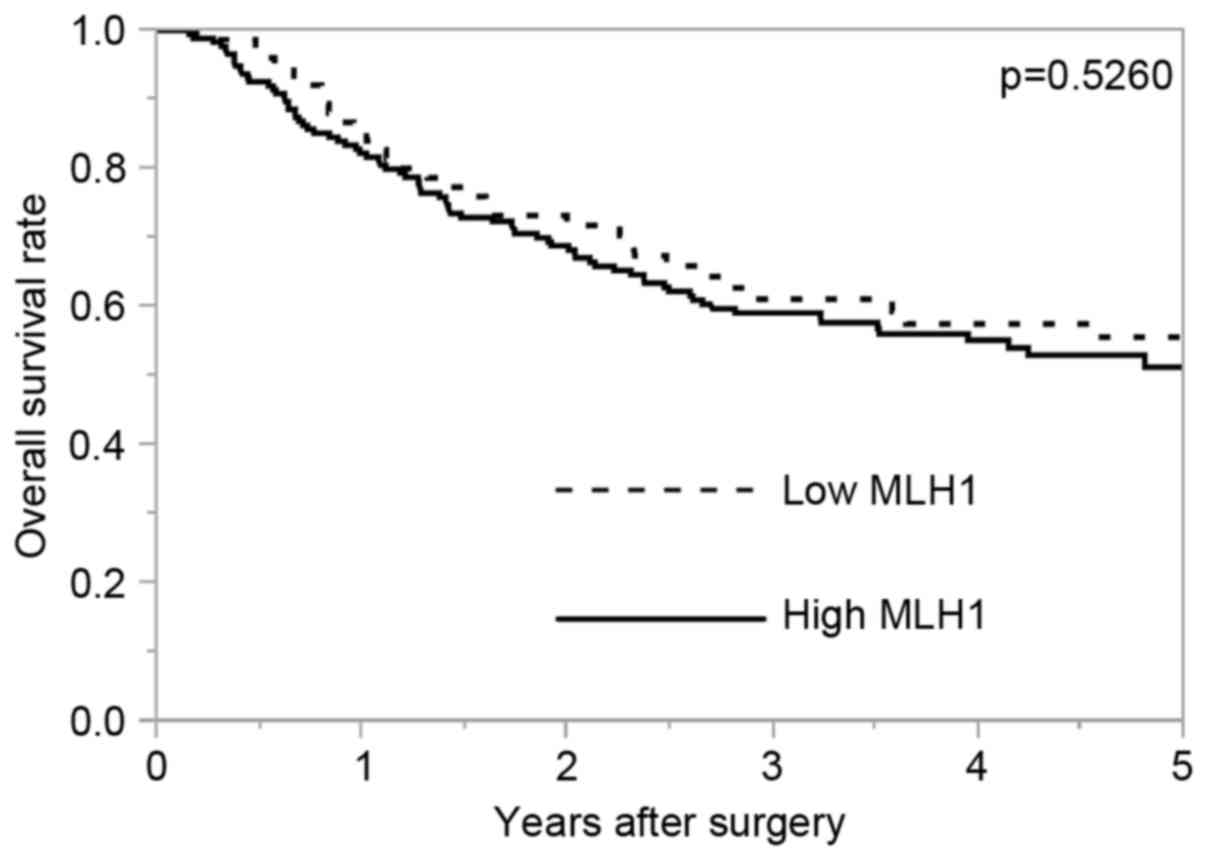
Fig. 2 demonstrates
the OS rate according to MLH1 expression. The 5-year OS rates in
the high MLH1 expression group and the low MLH1 expression group
were 51.3 and 55.6%, respectively. There was no significant
difference in OS according to MLH1 expression (P=0.5260). For
patients without preoperative therapy (n=42), the 5-year OS rates
of the high and the low MLH1 expression groups were 60.4 and 77.8%,
respectively (P=0.4984). For patients with preoperative therapy
(n=209), the 5-year OS rates of the high and the low MLH1
expression groups were 49.4 and 52.7%, respectively (P=0.5459).
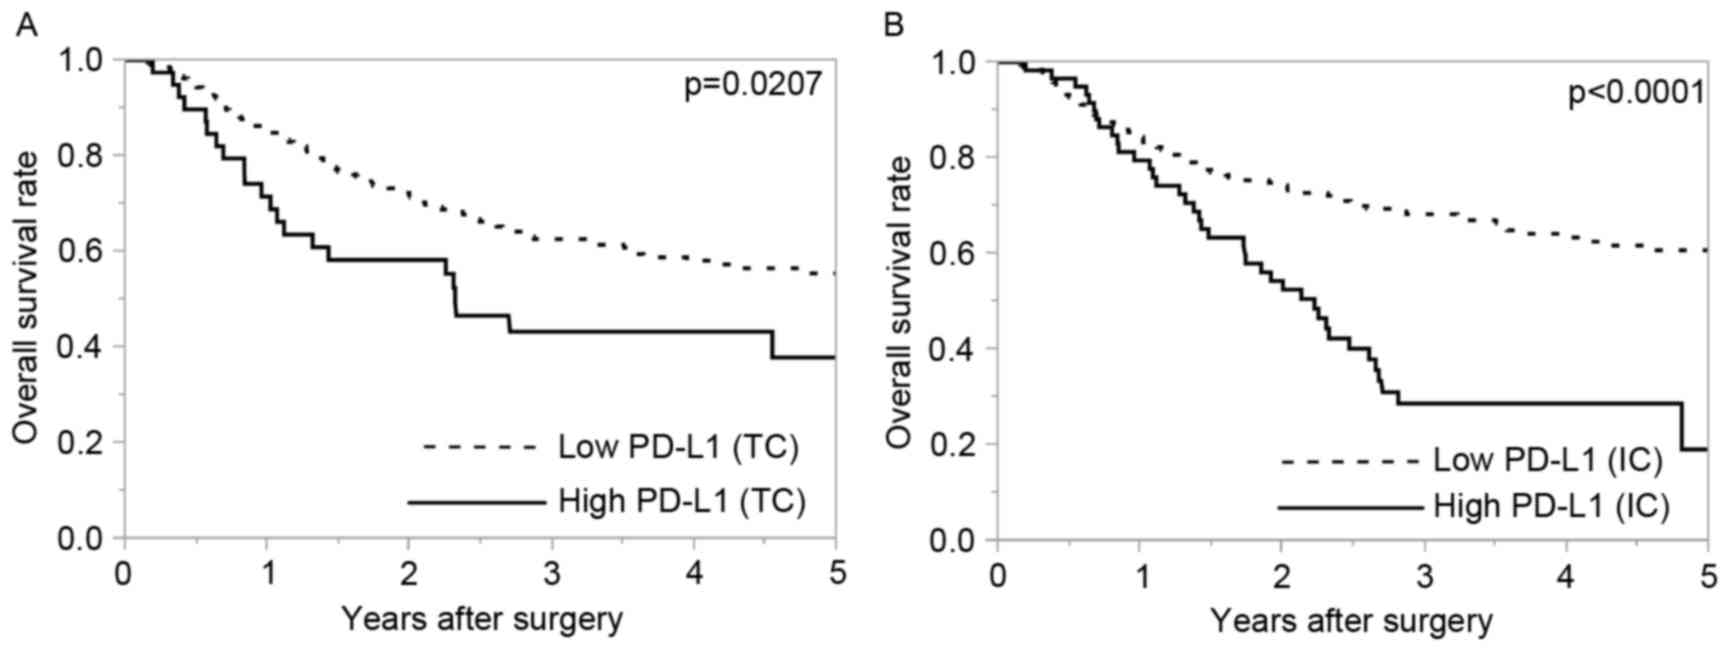
OS was significantly poorer in patients with high
PD-L1 expression compared with patients with low PD-L1 expression
in TCs and ICs (P=0.0207 and P<0.0001, respectively; Fig. 3).
Discussion
In the population of the present study, the ratio of
responders to preoperative therapy was higher in the high MLH1
expression group compared with that in the low MLH1 expression
group. TC PD-L1 expression was more often detected in tumors with
low MLH1 expression compared with high MLH1 expression.
These data suggest that the MLH1 protein expression
level has potential as an indicator for treatment optimization and
that determining tumor MLH1 expression may be beneficial for
decision-making in esophageal cancer treatment. Specifically,
patients with tumors exhibiting high MLH1 expression may benefit
from systemic chemotherapy, whereas treatment other than
chemotherapy should be considered for patients with tumors
exhibiting low MLH1 expression.
The present study demonstrated that PD-L1 expression
in TCs, but not ICs, was associated with MLH1 expression. This
suggests that certain cancer cell-specific mechanisms may promote
PD-L1 expression. Esophageal cancer cells with low MLH1 expression
may exhibit more genomic mutations compared with those with high
MLH1 expression due to an attenuated MMR system. Thus, an increase
in tumor genomic mutations may prompt PD-L1 expression in TCs. The
present study hypothesizes that there may be a mechanism by which
mutation itself promotes PD-L1 expression or one in which a ‘key’
mutation switches on PD-L1 expression. Direct investigation of the
correlation between mutational burden and PD-L1 expression is
required.
MLH1 is a main component of MMR, and the loss of
MLH1 function due to germline mutation or promoter methylation
accounts for the majority of MMR deficiency. Immunohistochemical
analysis of MLH1 protein expression is a simple and easy way to
detect MMR deficiency, and its reliability has been investigated
previously (24). In the present
study, immunohistochemistry of MLH1 was performed as a reliable
method to detect MMR deficiency.
The present study has several limitations, including
the fact that it was a retrospective study conducted at a single
institution, and the study population was comprised of patients who
had not received PD-1/PD-L1 inhibition therapy. Accordingly, the
results of the current study could not be compared with those of
studies that examined the response to PD-1/PD-L1 inhibition
therapy. Additional studies are required to validate PD-L1 and MLH1
expression in patients who have received PD-1/PD-L1 inhibition
therapy.
In conclusion, MLH1 expression may be a predictive
factor for the response to preoperative therapy in esophageal
cancer, and esophageal cancer with low MLH1 expression level may
have a mechanism that assists in promoting tumor PD-L1
expression.
References
|
1
|
Ando N, Kato H, Igaki H, Shinoda M, Ozawa
S, Shimizu H, Nakamura T, Yabusaki H, Aoyama N, Kurita A, et al: A
randomized trial comparing postoperative adjuvant chemotherapy with
cisplatin and 5-fluorouracil versus preoperative chemotherapy for
localized advanced squamous cell carcinoma of the thoracic
esophagus (JCOG9907). Ann Surg Oncol. 19:68–74. 2012. View Article : Google Scholar : PubMed/NCBI
|
|
2
|
Cunningham D, Allum WH, Stenning SP,
Thompson JN, van de Velde CJ, Nicolson M, Scarffe JH, Lofts FJ,
Falk SJ, Iveson TJ, et al: Perioperative chemotherapy versus
surgery alone for resectable gastroesophageal cancer. N Engl J Med.
355:11–20. 2006. View Article : Google Scholar : PubMed/NCBI
|
|
3
|
van Hagen P, Hulshof MC, van Lanschot JJ,
Steyerberg EW, van Berge Henegouwen MI, Wijnhoven BP, Richel DJ,
Nieuwenhuijzen GA, Hospers GA, Bonenkamp JJ, et al: Preoperative
chemoradiotherapy for esophageal or junctional cancer. N Engl J
Med. 366:2074–2084. 2012. View Article : Google Scholar : PubMed/NCBI
|
|
4
|
Fujita H: History of lymphadenectomy for
esophageal cancer and the future prospects for esophageal cancer
surgery. Surg Today. 45:140–149. 2015. View Article : Google Scholar : PubMed/NCBI
|
|
5
|
Nakajima M and Kato H: Treatment options
for esophageal squamous cell carcinoma. Expert Opin Pharmacother.
14:1345–1354. 2013. View Article : Google Scholar : PubMed/NCBI
|
|
6
|
Akutsu Y and Matsubara H:
Chemoradiotherapy and surgery for T4 esophageal cancer in Japan.
Surg Today. 45:1360–1365. 2015. View Article : Google Scholar : PubMed/NCBI
|
|
7
|
Topalian SL, Hodi FS, Brahmer JR,
Gettinger SN, Smith DC, McDermott DF, Powderly JD, Carvajal RD,
Sosman JA, Atkins MB, et al: Safety, activity, and immune
correlates of anti-PD-1 antibody in cancer. N Engl J Med.
366:2443–2454. 2012. View Article : Google Scholar : PubMed/NCBI
|
|
8
|
Brahmer JR, Tykodi SS, Chow LQ, Hwu WJ,
Topalian SL, Hwu P, Drake CG, Camacho LH, Kauh J, Odunsi K, et al:
Safety and activity of anti-PD-L1 antibody in patients with
advanced cancer. N Engl J Med. 366:2455–2465. 2012. View Article : Google Scholar : PubMed/NCBI
|
|
9
|
Kojima T, Hara H, Yamaguchi K, Hironaka S,
Iwasa S, Kato K, Tsushima T, Yasui H, Ura T, Muro K, et al: Phase
II study of nivolumab (ONO-4538/BMS-936558) in patients with
esophageal cancer: Preliminary report of overall survival. J Clin
Oncol. 34 Suppl 4S:abstr TPS1752016. View Article : Google Scholar
|
|
10
|
Le DT, Uram JN, Wang H, Bartlett BR,
Kemberling H, Eyring AD, Skora AD, Luber BS, Azad NS, Laheru D, et
al: PD-1 blockade in tumors with mismatch-repair deficiency. N Engl
J Med. 372:2509–2520. 2015. View Article : Google Scholar : PubMed/NCBI
|
|
11
|
Carbognin L, Pilotto S, Milella M, Vaccaro
V, Brunelli M, Caliò A, Cuppone F, Sperduti I, Giannarelli D,
Chilosi M, et al: Differential activity of nivolumab, pembrolizumab
and MPDL3280A according to the tumor expression of programmed
death-ligand-1 (PD-L1): Sensitivity analysis of trials in melanoma,
lung and genitourinary cancers. PLoS One. 10:e01301422015.
View Article : Google Scholar : PubMed/NCBI
|
|
12
|
Hewish M, Lord CJ, Martin SA, Cunningham D
and Ashworth A: Mismatch repair deficient colorectal cancer in the
era of personalized treatment. Nat Rev Clin Oncol. 7:197–208. 2010.
View Article : Google Scholar : PubMed/NCBI
|
|
13
|
Tzao C, Hsu HS, Sun GH, Lai HL, Wang YC,
Tung HJ, Yu CP, Cheng YL and Lee SC: Promoter methylation of the
hMLH1 gene and protein expression of human mutL homolog 1 and human
mutS homolog 2 in resected esophageal squamous cell carcinoma. J
Thorac Cardiovasc Surg. 130:13712005. View Article : Google Scholar : PubMed/NCBI
|
|
14
|
Gryfe R, Kim H, Hsieh ET, Aronson MD,
Holowaty EJ, Bull SB, Redston M and Gallinger S: Tumor
microsatellite instability and clinical outcome in young patients
with colorectal cancer. N Engl J Med. 342:69–77. 2000. View Article : Google Scholar : PubMed/NCBI
|
|
15
|
Ward R, Meagher A, Tomlinson I, O'Connor
T, Norrie M, Wu R and Hawkins N: Microsatellite instability and the
clinicopathological features of sporadic colorectal cancer. Gut.
48:821–829. 2001. View Article : Google Scholar : PubMed/NCBI
|
|
16
|
Sargent DJ, Marsoni S, Monges G, Thibodeau
SN, Labianca R, Hamilton SR, French AJ, Kabat B, Foster NR, Torri
V, et al: Defective mismatch repair as a predictive marker for lack
of efficacy of fluorouracil-based adjuvant therapy in colon cancer.
J Clin Oncol. 28:3219–3226. 2010. View Article : Google Scholar : PubMed/NCBI
|
|
17
|
Popat S, Hubner R and Houlston RS:
Systematic review of microsatellite instability and colorectal
cancer prognosis. J Clin Oncol. 23:609–618. 2005. View Article : Google Scholar : PubMed/NCBI
|
|
18
|
Sobin LH, Gospodarowicz MK and Wittekind
C: TNM classification of malignant tumours. Wiley; 2009
|
|
19
|
Makino T, Yamasaki M, Miyata H, Yoshioka
S, Takiguchi S, Fujiwara Y, Nakajima K, Nishida T, Mori M and Doki
Y: p53 mutation status predicts pathological response to
chemoradiotherapy in locally advanced esophageal cancer. Ann Surg
Oncol. 17:804–811. 2010. View Article : Google Scholar : PubMed/NCBI
|
|
20
|
Japan Esophageal Society, . Japanese
Classification of Esophageal Cancer, tenth edition: part I.
Esophagus. 6:1–25. 2009. View Article : Google Scholar
|
|
21
|
Japan Esophageal Society, . Japanese
classification of esophageal cancer, tenth edition: parts II and
III. Esophagus. 6:71–94. 2009. View Article : Google Scholar
|
|
22
|
Kishi K, Doki Y, Yano M, Yasuda T,
Fujiwara Y, Takiguchi S, Kim S, Higuchi I and Monden M: Reduced
MLH1 expression after chemotherapy is an indicator for poor
prognosis in esophageal cancers. Clin Cancer Res. 9:4368–4375.
2003.PubMed/NCBI
|
|
23
|
Herbst RS, Soria JC, Kowanetz M, Fine GD,
Hamid O, Gordon MS, Sosman JA, McDermott DF, Powderly JD, Gettinger
SN, et al: Predictive correlates of response to the anti-PD-L1
antibody MPDL3280A in cancer patients. Nature. 515:563–567. 2014.
View Article : Google Scholar : PubMed/NCBI
|
|
24
|
Lanza G, Gafa R, Maestri I, Santini A,
Matteuzzi M and Cavazzini L: Immunohistochemical pattern of
MLH1/MSH2 expression is related to clinical and pathological
features in colorectal adenocarcinomas with microsatellite
instability. Mod Pathol. 15:741–749. 2002. View Article : Google Scholar : PubMed/NCBI
|