Introduction
Angiogenesis is an important hallmark of tumor
development and metastasis and is a validated target for cancer
treatment (1–3). Sorafenib (BAY 43–9006) is an oral
multikinase inhibitor with antiangiogenic properties. Currently,
sorafenib has been approved for the treatment of metastatic renal
cell carcinoma (RCC) and advanced hepatocellular carcinoma, and is
under investigation for use in other malignancies in combination
with additional chemotherapies (4).
Conventionally, antiangiogenic drugs inhibit new
vessel formation or destroy the tumor vasculature to reduce blood
flow and starve the tumor of nutrients (5). However, numerous preclinical studies
demonstrated that anti-vascular endothelial growth factor (VEGF)
treatment alters the tumor vasculature towards a more ‘mature’ or
‘normal’ phenotype (‘vascular normalization’), by attenuation of
hyperpermeability, improvement of tumor oxygenation and blood flow
and the resultant reduction in tumor hypoxia and interstitial fluid
pressure (6). These changes can
induce an improvement in the metabolic profile of the tumor
microenvironment and the efficacy of exogenously administered
therapeutics (6). Thus, the
mechanistic dissociation between tumor starvation and vascular
normalization after antiangiogenic therapy is an important subject
in the field of cancer therapy (7).
The accurate evaluation of tumor responses after antiangiogenic
therapy is of increasing clinical interest and is important for the
optimization of treatment protocols (8). With the aforementioned background,
improved understanding of tumor responses, such as tumor starvation
or tumor vascular normalization, after antiangiogenic therapy is
important for optimizing the treatment strategy.
18F-fluoromisonidazole (18F-FMISO) is widely
used for imaging tumor hypoxia (9,10). A
previous study evaluated the changes in tumor oxygen state
following a high-dose (80 mg/kg/day) sorafenib treatment in a RCC
xenograft (A498) by 18F-FMISO hypoxia imaging, and the
results suggested that the tumor starvation occurs after the
sorafenib treatment (11); however,
the enhanced intratumoral hypoxia, namely tumor starvation, may be
ascribed to the relatively high dose of sorafenib used, as it also
decreased the number of tumor microvessels. Thus, the tumor
response, such as starvation or vascular normalization, to lower
doses of sorafenib treatment is a of great concern and remains to
be elucidated.
A previous study revealed that sorafenib decreased
the density of intratumoral microvessels and induced a hypoxic
state at a high dose (80 mg/kg) in a RCC xenograft (A498) (11). This dose is higher compared with the
human clinical dose of 13.3 mg/kg (400 mg/patient twice daily; for
example, 13.3 mg/kg for a 60 kg patient) (12). From the findings of this previous
study, it is not possible to determine whether this decrease in
microvessel density and hypoxic state induction also occur in
humans treated with sorafenib, as specific antiangiogenic agents
may improve tumor perfusion following their administration at a
certain low dose. Thus, the intratumoral responses, such as
starvation or vascular normalization, to sorafenib treatment at a
clinical dose remain unclear. In the present study, to further
clarify the tumor response to the antiangiogenic treatment with
sorafenib, the changes in the tumor microenvironment
(oxygen/hypoxia states) were evaluated using 18F-FMISO
hypoxia imaging following sorafenib treatment at low doses (10, 20
and 40 mg/kg) in the A498 renal cell carcinoma xenograft. The
present study aimed to provide information that may lead to an
improved understanding of the mechanisms underlying the
antiangiogenic effect of sorafenib on renal cell carcinoma and may
contribute to the determination of optimum treatment protocols for
cancer patients receiving antiangiogenic therapy.
Materials and methods
Radiopharmaceutical and reagents
18F-FMISO was obtained from the Hokkaido
University Hospital Cyclotron Facility (Sapporo, Japan), which was
synthesized as previously described (11,13,14).
Sorafenib (Nexavar) was purchased from Bayer (Newbury, UK).
Animal studies
The experimental protocol was approved by the
Laboratory Animal Care and Use Committee of Hokkaido University
(approval number 13–0057) and performed in accordance with the
Guidelines for Animal Experiments at the Graduate School of
Medicine, Hokkaido University. Male BALB/c athymic nude mice (n=25,
9-weeks-old; mean body weight, 23.8±1.4 g; Japan SLC, Inc.,
Hamamatsu, Japan) were used. The room temperature was maintained
between 23 and 25°C and the relative humidity was maintained
between 45 and 60%. The institutional laboratory housing provided a
12-h light/dark cycle. Food and water were provided ad
libitum and met all the criteria of the Association for
Assessment and Accreditation of Laboratory Animal Care (AAALAC)
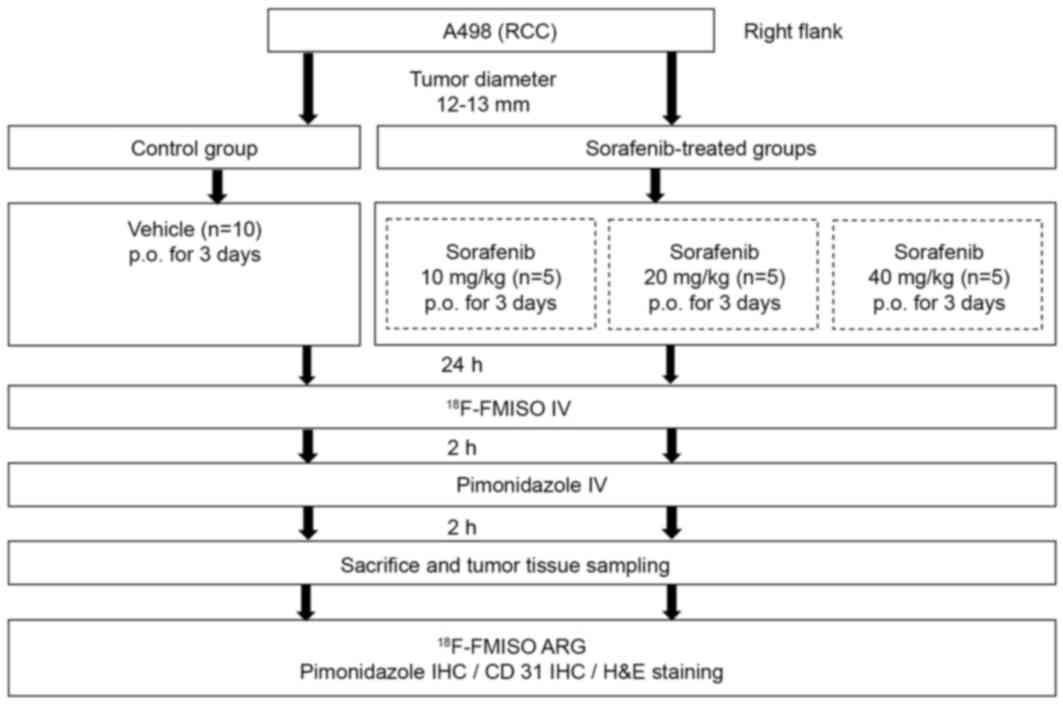
International. Fig. 1 presents the
experiment protocol of the present study. A human RCC xenograft
model was established with the A498 human clear cell RCC (CCRCC)
cell line (European Collection of Cell Cultures, Salisbury, UK).
A498 cells (1×10⁷ cells/0.1 ml) were subcutaneously
inoculated into the right flank of each mouse. When the tumors grew
to 12–13 mm in diameter, the mice were randomly assigned to the
control group (n=10) and sorafenib-treated groups (n=15, n=5 for
each group; Fig. 1). Mice in the
sorafenib-treated groups were further assigned to three groups and
treated with 10, 20 or 40 mg/kg sorafenib (n=5 for each group).
Sorafenib (10, 20 and 40 mg/kg) in a cremophor EL (Sigma-Aldrich;
Merck KGaA, Darmstadt, Germany)/ethanol (Pharmaco Products,
Brookfield, CT, USA)/water (12.5:12.5:75) solution was administered
daily for 3 days by oral gavage. The cremophor EL/ethanol/water
(12.5:12.5:75) solution was administered as the vehicle in the
control group. Tumor size was evaluated using a caliper every day
from the start of the sorafenib treatment. Tumor volume was
calculated using the following formula: π/6 × (largest diameter) ×
(smallest diameter)2.
Autoradiography (ARG) with
18F-FMISO
One day after the final sorafenib/vehicle treatment,
mice were injected with 18.5 MBq 18F-FMISO followed by
pimonidazole (60 mg/kg) after 2 h. Subsequently, 2 h after
pimonidazole injection, the mice were sacrificed and the tumors
were excised. Each excised tumor tissue was then sectioned at 2–3
mm thickness to maximize the division surface, embedded in
Tissue-Tek medium (Sakura Finetek Europe B.V., Flemingweg,
Netherlands) with the calf muscle and then frozen in isopentane/dry
ice. The frozen specimens were cut into 10-µm-thick cryosections
for ARG; four adjacent 5-µm-thick cryosections were used for
histological studies.
The distribution of the tracer in the tumor tissue
was determined by ARG. Briefly, the cryosections were exposed to a
phosphor imaging plate (Fuji Imaging Plate BAS-SR 2025 for
18F; Fuji Photo Film Co., Ltd., Tokyo, Japan) with a set
of calibrated standards (15). This
autoradiographic exposure was performed overnight to detect the
distribution of 18F-FMISO. ARG images were analyzed
using a computerized imaging analysis system (FLA-7000 Bio-Imaging
Analyzer; Fuji Photo Film Co., Ltd.) with the image analysis
software Multi Gauge (Version 3.0; Fuji Photo Film Co., Ltd.).
In order to quantitatively evaluate
18F-radioactivity, regions of interest (ROIs) were
selected to cover the entire tumor tissue, excluding the necrotic
areas on each ARG image, with reference to the corresponding
hematoxylin and eosin (H&E) stained tissue section. The
radioactivity in each ROI was determined by photostimulated
luminescence per unit area, PSL/mm2 (PSL=a ×
D × t: a=constant; D=radioactivity
exposed on the imaging plate; t=exposure time), the percent
injected dose per square meter of tissue (%ID/m2) and
normalized with body weight [(%ID/m2)x kg] were
calculated (16,17).
Immunohistochemistry (IHC)
The 5-µm-thick cryosections were
immunohistochemically stained for pimonidazole and CD31 to assess
hypoxia and microvessel density, respectively. Following
rehydration and antigen retrieval, endogenous peroxidase activity
was blocked for 10 min in 0.1% methanol supplemented with 0.3%
hydrogen peroxide. To assess hypoxia, tissue sections were
incubated for 60 min with a rabbit polyclonal anti-pimonidazole
antibody (cat no. PAb2627AP, Hypoxyprobe; NPI Inc., Burlington, MA,
USA) diluted at 1:200 using a Hypoxyprobe-1 Omni kit (Hypoxyprobe,
Inc., Burlington, MA, USA). In order to evaluate microvessels,
tissue sections were incubated for 30 min with a rabbit polyclonal
antibody against CD31 (cat no. ab28364; Abcam, Cambridge, UK)
diluted at 1:50. H&E staining at room temperature for 50 min
was also performed to assess necrosis.
For the quantitative analysis of hypoxia, the
hypoxic fraction, which is the percentage of the cells positive for
pimonidazole, as determined by IHC, in the entire cross section (%
pimonidazole-positive cells), was determined using ImageJ (Java
version 1.6.0; National Institutes of Health, Bethesda, MD, USA).
For the quantitative analysis of microvessel density, intratumoral
CD31-positive microvessels were counted under an optical microscope
(objective magnification, ×400; 0.644 mm2 per field),
excluding the peripheral connective tissue and central necrotic
tissue, with the analyst blind to the purpose of the present study.
Single CD31-positive endothelial cells without any visible lumen
were not included in the evaluation. A total of >10 fields per
section were randomly analyzed and mean vessel density (MVD,
vessels/mm2) was determined. Necrotic area was evaluated
from H&E-stained consecutive sections using ImageJ
software.
Statistical analyses
All data are expressed as the mean ± standard
deviation. One-factor repeated measures analysis of variance
(ANOVA) was performed to compare the tumor volumes of the control
group and sorafenib-treated groups. In the evaluation of
18F-FMISO accumulation level, hypoxic fraction, MVD and
necrotic area, one-way ANOVA followed by a Bonferroni post hoc test
were performed to assess the significance of differences between
the control group and sorafenib-treated groups (10, 20 and 40 mg/kg
sorafenib treatments). A two-tailed P-value of <0.0083 was
considered to indicate a statistically significant difference.
Results
Tumor volume alterations
There was no significant difference in tumor volume
between the control group and sorafenib-treated groups during the
study period until day 3 (data not shown).
Visual analysis of
18F-FMISO ARG images and histological staining
The representative images of 18F-FMISO
ARG, pimonidazole IHC, H&E staining and CD31 IHC are presented
in Fig. 2. In the control group, the
intratumoral 18F-FMISO distribution was relatively low
and the 18F-FMISO expression level was similar compared
with that in the muscle tissue, although numerous low
18F-FMISO expression level areas were observed (Fig. 2). In the 10 mg/kg sorafenib-treated
group, a number of local spots of high 18F-FMISO
expression level were observed in the tumor. The areas with high
18F-FMISO expression level increased with sorafenib
dose.
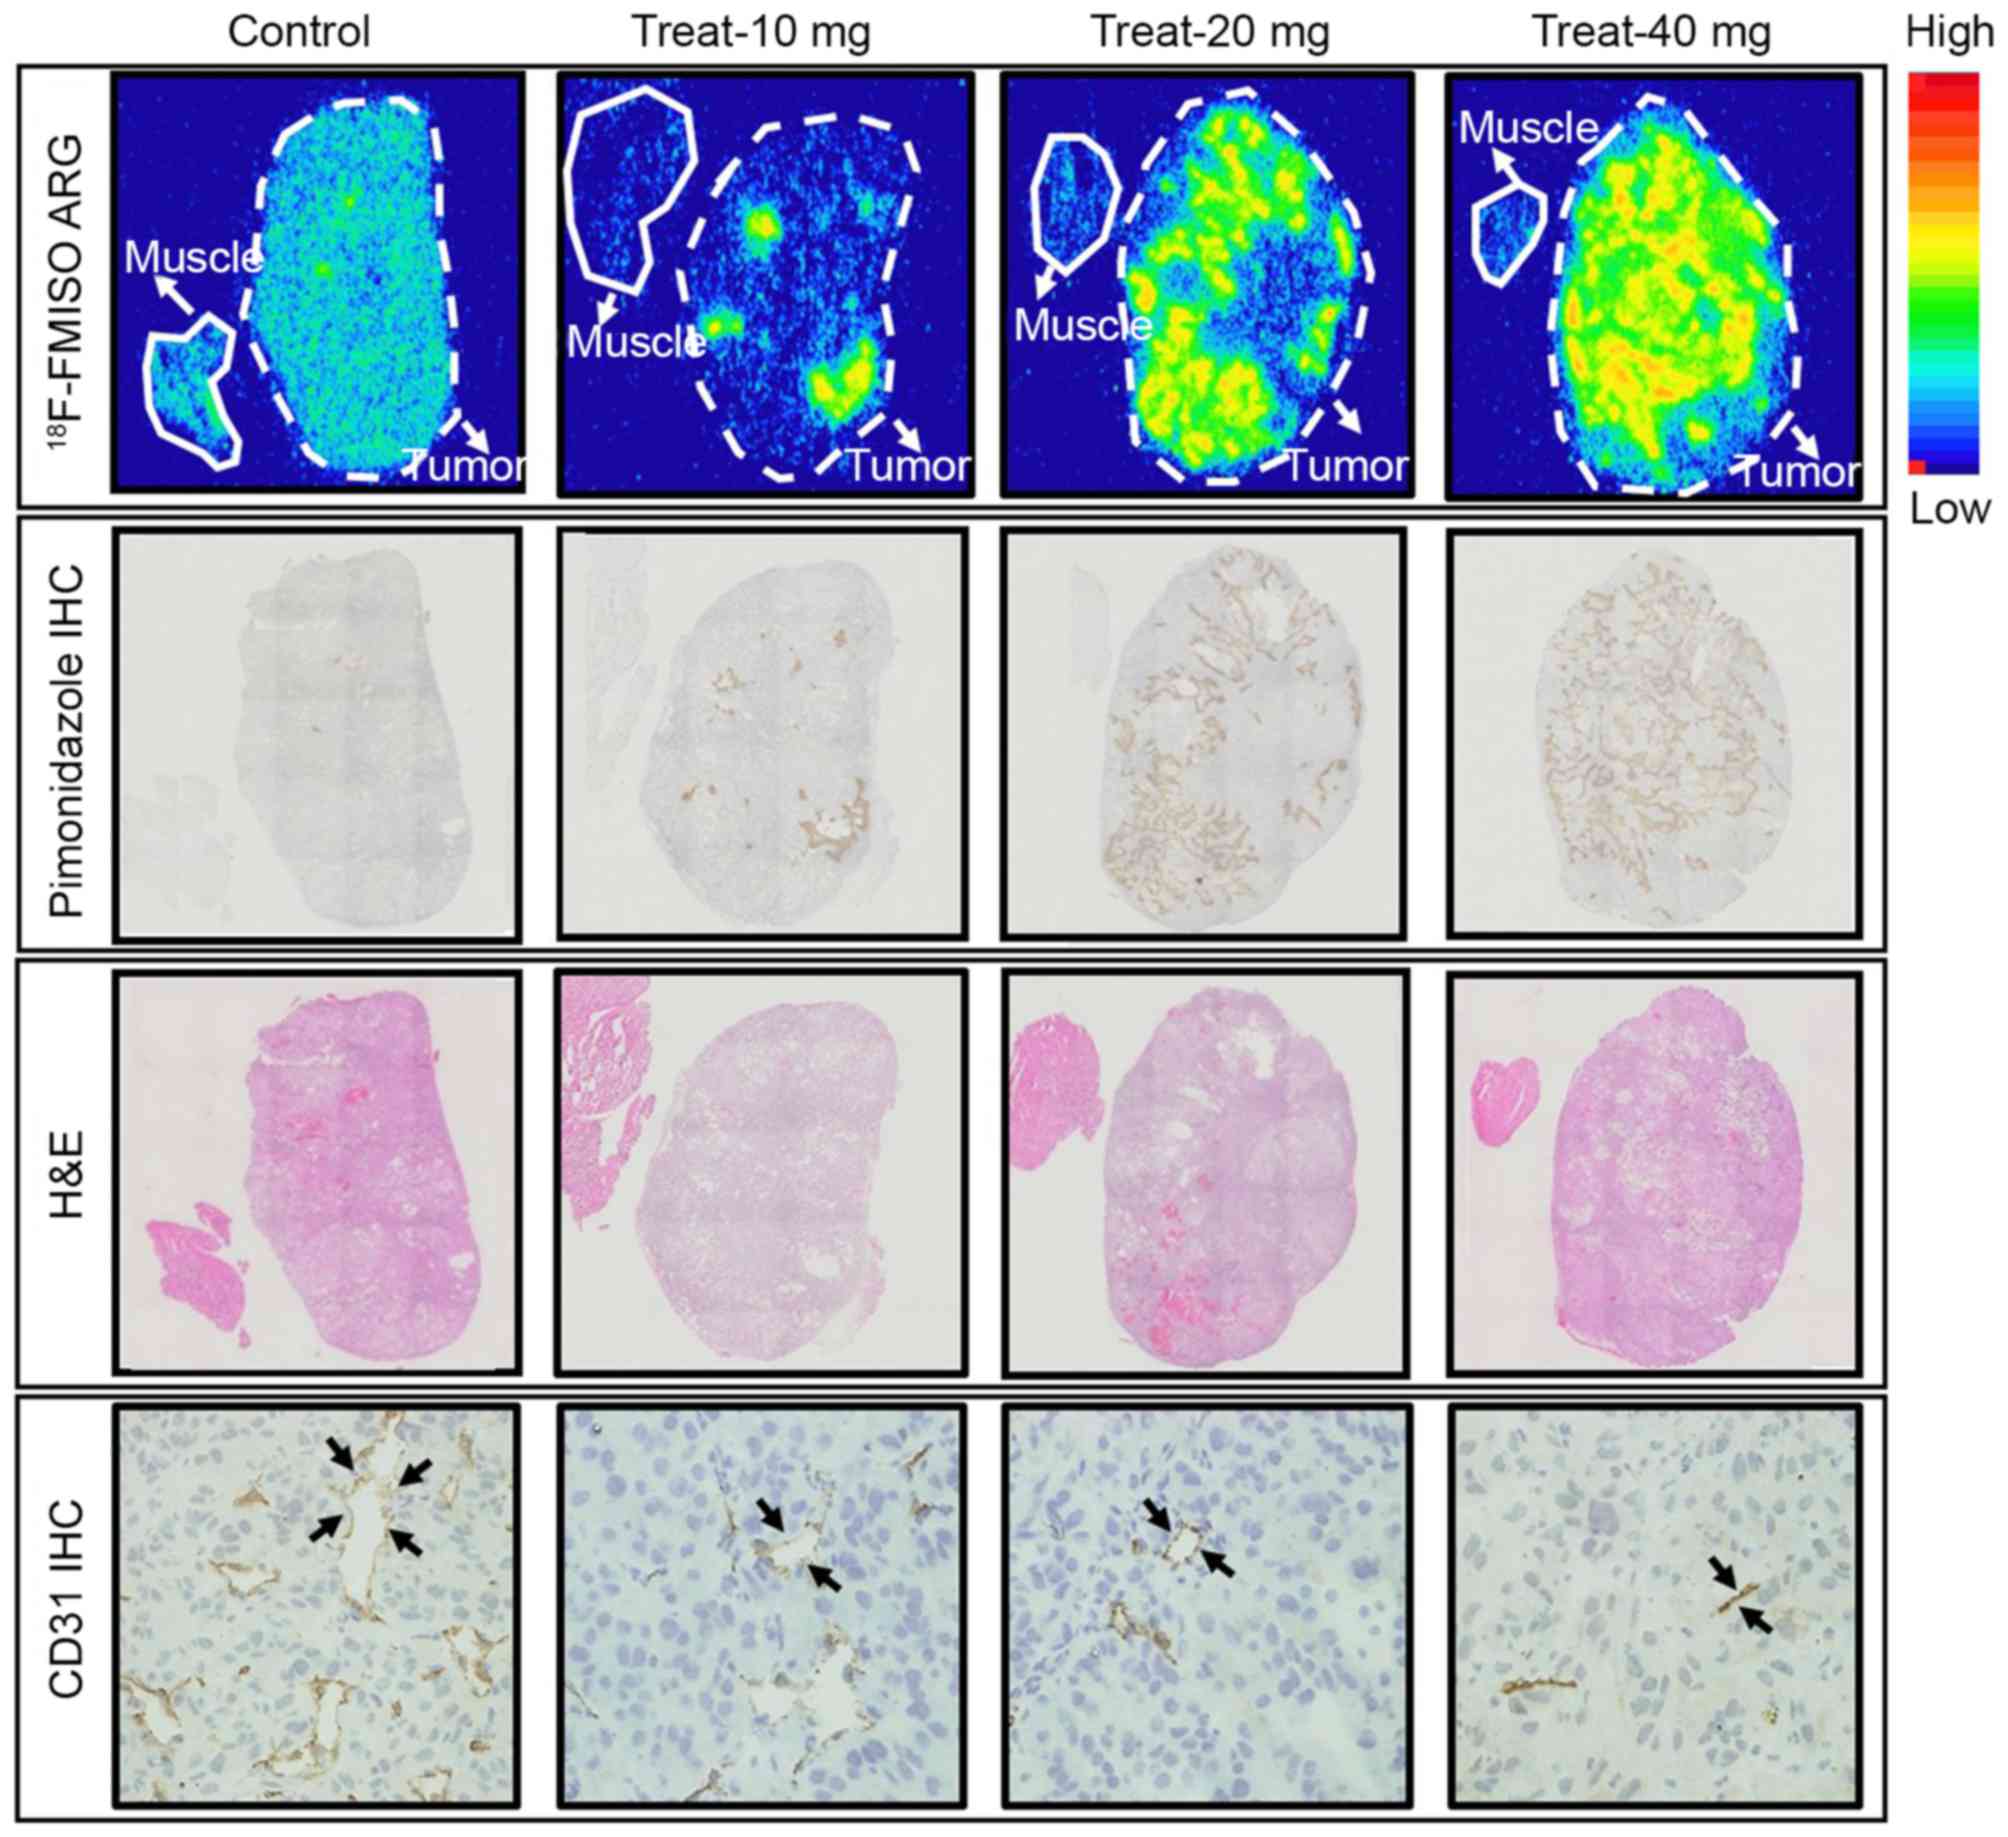 | Figure 2.Representative images of
18F-FMISO ARG (upper panel), pimonidazole IHC (second
panel), H&E staining (third panel) and CD31 (lower panel). The
dotted and solid lines represent the tumor and muscle outlines,
respectively. The black arrowheads represent the microvessels.
Control, control group; Treat-10 mg, 10 mg/kg sorafenib-treated
group; Treat-20 mg, 20 mg/kg sorafenib-treated group; Treat-40 mg,
40 mg/kg sorafenib-treated group. 18F-FMISO,
18F-fluoromisonidazole; H&E, hematoxylin and eosin;
ARG, autoradiography; IHC, immunohistochemistry; CD, cluster of
differentiation. |
IHC revealed fewer intratumoral
pimonidazole-positive areas in the control group (Fig. 2). In the 10 mg/kg sorafenib-treated
group, numerous localized pimonidazole-positive areas were
observed, which were similar to
high-18F-FMISO-expression-level areas (Fig. 2). The pimonidazole-positive areas
increased with sorafenib dose, which were similar to the
18F-FMISO ARG results.
H&E staining demonstrated an increase in
intratumoral necrotic areas with sorafenib dose (Fig. 2, third panel). Hypoxic areas
(high-18F-FMISO-accumulation-level and
pimonidazole-positive areas) were observed adjacent to the necrotic
areas (Fig. 2, first-third
panels).
CD31 IHC revealed a high expression level of CD31
and the abundance of microvessels in the tumor in the control
group. The number and density of the microvessels decreased with
increasing sorafenib treatment dose (Fig.
2, lower panel).
Quantitative analysis of
18F-FMISO ARG and histological staining
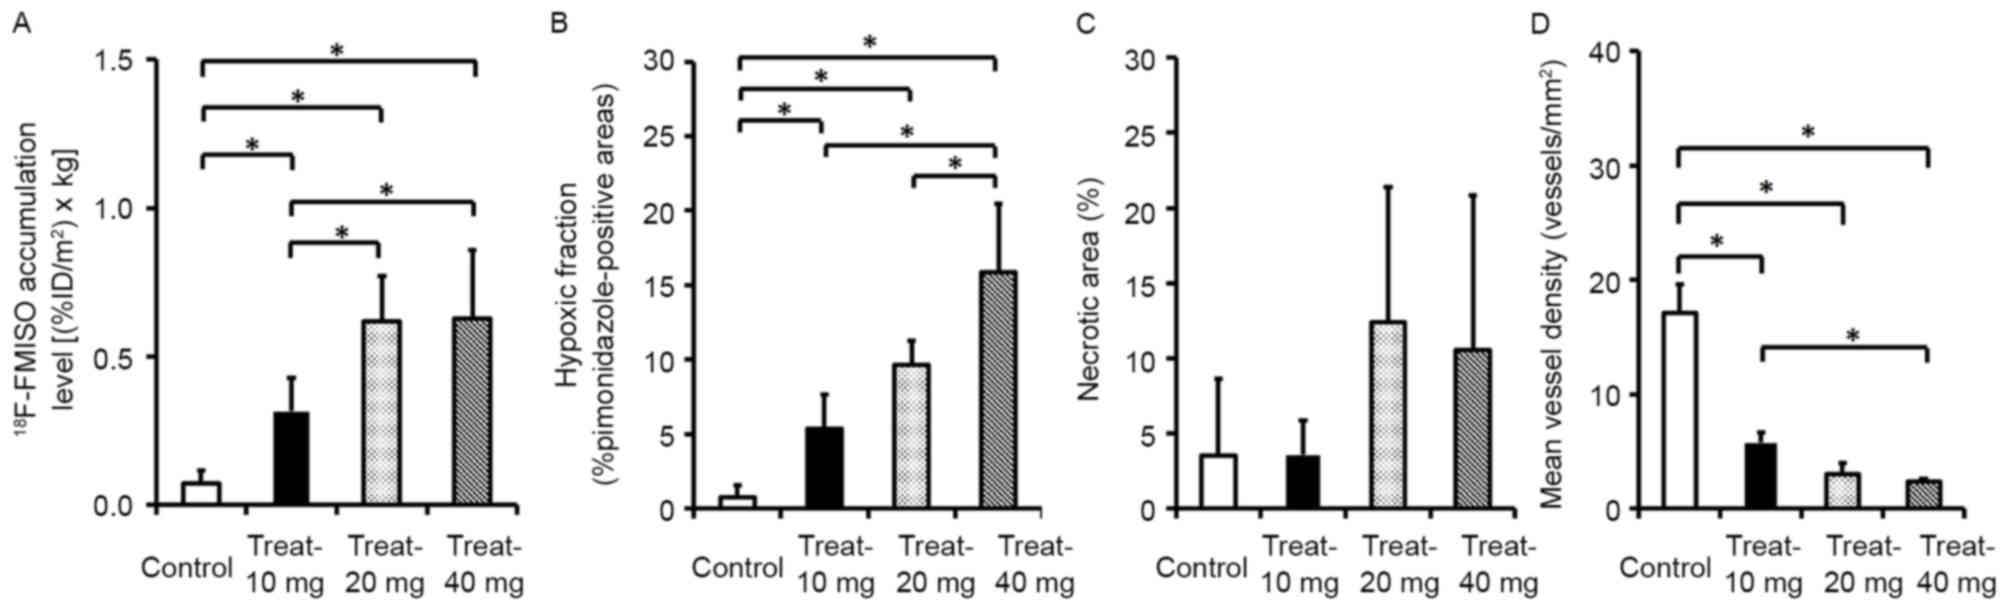
The quantitative evaluation of intratumoral
18F-FMISO accumulation level, hypoxia, necrotic areas
and microvessel density are presented in Fig. 3. The intratumoral 18F-FMISO
expression levels dose-dependently increased by 4.3-, 8.4- and
8.6-fold compared with that of the control group for the 10, 20 and
40 mg/kg sorafenib treatment groups, respectively (Fig. 3A). The levels of 18F-FMISO
expression in tumors were 0.07±0.04 [(%ID/m2) × kg] in
the control group and 0.32±0.11, 0.62±0.15 and 0.63±0.23
[(%ID/m2) × kg] in the 10, 20 and 40 mg/kg
sorafenib-treated groups, respectively (Fig. 3A).
The hypoxia fractions increased by 6.8-, 12.3- and
20.2-fold in the 10, 20 and 40 mg/kg sorafenib-treated groups,
respectively, compared with the control group (Fig. 3B). The hypoxia fractions in tumors
were 0.78±0.79 (% pimonidazole-positive cells) in the control group
and 5.36±2.29, 9.66±1.58 and 15.85±4.59 (% pimonidazole-positive
cells) in the 10, 20 and 40 mg/kg sorafenib-treated groups,
respectively (Fig. 3B).
The necrotic areas in the tumor tissues increased
with the dose of sorafenib treatment; however, no significant
difference was observed between the control group and
sorafenib-treated groups (Fig. 3C).
The percentage of necrotic areas in tumor tissues was 3.53±5.13% in
the control group and 3.58±2.28, 12.42±8.99 and 10.54±10.29% in the
10, 20 and 40 mg/kg sorafenib-treated groups, respectively
(Fig. 3C).
The microvessel densities in the 10, 20 and 40 mg/kg
sorafenib-treated groups dose-dependently decreased to 33.5, 17.6
and 14.0% of the control, respectively (Fig. 3D). The microvessel densities in tumors
were 17.1±2.5 (vessels/mm2) in the control group and
5.7±1.0, 3.0±1.0 and 2.4±0.3 (vessels/mm2) in the 10, 20
and 40 mg/kg sorafenib-treated groups, respectively (Fig. 3D).
Discussion
The major findings of this study were as follows: In
the renal cell carcinoma xenograft (A498), the levels of
18F-FMISO expression in the tumor tissues increased
sorafenib-dose-dependently, which is consistent with the increase
in the number of pimonidazole-positive cells and decrease in the
number of microvessels (Figs. 2 and
3). The dose-dependent decrease in
the number of microvessels and increase in the tumor hypoxic
fraction in the present study indicated that tumor starvation
occurred in the renal cell carcinoma xenograft, as induced by the
sorafenib treatment protocol.
According to a previous study and the results of the
present study, tumor starvation occurred following sorafenib
treatment at a high dose and conventional doses (11). Generally, it is considered that
vascular normalization occurs after antiangiogenic therapy at
conventional clinical doses or lower doses, although tumor
starvation occurs following high-dose or long-term treatment with
an antiangiogenic drug. In the present study, sorafenib was
administered at doses of 10, 20 and 40 mg/kg. The doses of 10–20
mg/kg are considered to be equivalent to the clinical doses of
sorafenib (400 mg/patient twice daily; 13.3 mg/kg for a 60 kg
patient) (12). The reasons why tumor
starvation occurred in the present study remain unclear; however,
this may be ascribed to the characteristics of RCC and the
mechanisms underlying sorafenib action. In human CCRCC, A498 is a
von Hippel-Lindua (VHL) tumor suppressor gene mutant and
hypoxia-inducible factor (HIF)-2α is activated, although HIF-1α is
absent (18). Mutations or loss of
the VHL tumor suppressor gene frequently occurs in RCC
(19). VHL-defective RCC is
characterized by high expression levels of HIF-α, which induces
overproduction of growth factors, including VEGF and
platelet-derived growth factor (PDGF)-β, which activates the
membrane-bound receptor tyrosine kinases VEGF receptor (VEGFR) and
PDGF receptor (PDGFR) and promotes tumor growth, angiogenesis and
metastasis (20). Sorafenib inhibits
angiogenesis by decreasing the activities of VEGFR-2, VEGFR-3 and
PDGFR-β (21). Sorafenib has a strong
antiangiogenic effect with simultaneous suppression of VEGFR and
PDGFR; thus, it is markedly effective for RCC treatment. The
histological evaluation (vessel density) of the present study
supported this hypothesis (Figs. 2
and 3), although the suppression of
VEGFR and PDGFR was not evaluated. Therefore, the strong
antiangiogenic effect of sorafenib may induce acute tumor hypoxia
(tumor starvation) at clinical doses of sorafenib in highly
vascularized RCC.
The accurate evaluation of tumor responses,
including tumor starvation or tumor vascular normalization
following antiangiogenic therapy, is important for optimizing
treatment strategies (8). In the A498
renal cell carcinoma xenograft, the early response (tumor
starvation) was observed using 18F-FMISO ARG after three
days of sorafenib treatment. When an antiangiogenic drug starves
tumor cells, it is considered to be an effective monotherapy.
Conversely, when an antiangiogenic drug normalizes intratumoral
vasculature and improves blood flow, it is considered to have an
enhancive effect in combination therapy. Thus, the results of the
present study indicated that monotherapy with sorafenib is
effective for the treatment of renal cell carcinoma. Escudier et
al (12) reported that sorafenib
treatment (400 mg twice daily) prolonged progression-free survival
in patients with advanced clear cell renal cell carcinoma in a
phase III randomized, double-blind, placebo-controlled TARGET trial
with 903 patients whose previous standard therapy had failed.
However, it should be noted that sensitivity to sorafenib differs
between mice and humans due to species differences and different
growth rates of tumors. Thus, the findings of the present study
require further evaluation in clinical settings. Furthermore, it is
important to evaluate the tumor microenvironment in various tumor
xenografts, including actual metastatic RCC models after sorafenib
treatment. In the future, the present study would like to evaluate
the intratumoral changes in actual metastatic RCC models following
antiangiogenic treatment. Conversely, it is important to evaluate
tumor perfusion changes after treatment with sorafenib, which would
provide further information for understanding the association
between the intratumoral hypoxic state and tumor perfusion
alterations. Notably, there was a marked decrease in perfusion in
the areas where 18F-FMISO expression was observed in a
preliminary study with Hoechst intravenous injection in the same
xenograft model after 80 mg/kg sorafenib treatment (data not
shown).
18F-FMISO ARG and IHC were performed in
the present study 24 h following a once daily sorafenib treatment
for 3 days; however our previous study demonstrated that the
increase in hypoxic fraction and tumor starvation occurred after
once daily 80 mg/kg sorafenib treatment for 7 days in RCC (A498)
xenograft (11). Further studies with
other treatment protocols, including prolonged treatment periods
are required. The subsequent effects of sorafenib on tumor growth
following the three-day sorafenib treatment are unclear and require
further investigation. Sorafenib is a multikinase inhibitor, which
not only has an antiangiogenic property, but also inhibits tumor
proliferation.
In conclusion, the present study revealed that the
intratumoral 18F-FMISO expression levels and the number
of pimonidazole-positive cells significantly increased, whereas the
number of microvessels in the tumor significantly decreased
following sorafenib treatment of RCC (A498) xenografts. These
results indicated that, unlike vascular normalization, tumor
hypoxia/tumor starvation occurred following sorafenib treatment at
high doses and conventional doses in renal cell carcinoma xenograft
(A498), which may be due to the antiangiogenic property of
sorafenib. The results of the present study may provide important
information that may lead to further understanding of the
antiangiogenic mechanisms underlying sorafenib action in renal cell
carcinoma.
Acknowledgements
The present study was supported by the Creation of
Innovation Centers for Advanced Interdisciplinary Research Areas
Program, Ministry of Education, Culture, Sports, Science and
Technology (Japan) and JSPS KAKENHI (grant no. 23591742). The
authors thank the staff of the Department of Nuclear Medicine,
Central Institute of Isotope Science and Department Oral Diagnosis
and Medicine, Hokkaido University.
References
|
1
|
Carmeliet P and Jain RK: Angiogenesis in
cancer and other diseases. Nature. 407:249–257. 2000. View Article : Google Scholar : PubMed/NCBI
|
|
2
|
Jain RK: Normalization of tumor
vasculature: An emerging concept in antiangiogenic therapy.
Science. 307:58–62. 2005. View Article : Google Scholar : PubMed/NCBI
|
|
3
|
Ma J and Waxman DJ: Combination of
antiangiogenesis with chemotherapy for more effective cancer
treatment. Mol Cancer Ther. 7:3670–3684. 2008. View Article : Google Scholar : PubMed/NCBI
|
|
4
|
Takimoto CH and Awada A: Safety and
anti-tumor activity of sorafenib (Nexavar) in combination with
other anti-cancer agents: A review of clinical trials. Cancer
Chemother Pharmacol. 61:535–548. 2008. View Article : Google Scholar : PubMed/NCBI
|
|
5
|
Folkman J: Tumor angiogenesis: Therapeutic
implications. N Engl J Med. 285:1182–1186. 1971. View Article : Google Scholar : PubMed/NCBI
|
|
6
|
Goel S, Duda DG, Xu L, Munn LL, Boucher Y,
Fukumura D and Jain RK: Normalization of the vasculature for
treatment of cancer and other diseases. Physiol Rev. 91:1071–1121.
2011. View Article : Google Scholar : PubMed/NCBI
|
|
7
|
Offermanns S and Rosenthal W: Encyclopedia
of Molecular Pharmacology. 2nd. Berlin: Springer-Verlag; 2008,
View Article : Google Scholar
|
|
8
|
Oehler C, O'Donoghue JA, Russell J,
Zanzonico P, Lorenzen S, Ling CC and Carlin S: 18F-fluomisonidazole
PET imaging as a biomarker for the response to
5,6-dimethylx-anthenone-4-acetic acid in colorectal xenograft
tumors. J Nucl Med. 52:437–444. 2011. View Article : Google Scholar : PubMed/NCBI
|
|
9
|
Lawrentschuk N, Poon AM, Foo SS, Putra LG,
Murone C, Davis ID, Bolton DM and Scott AM: Assessing regional
hypoxia in human renal tumors using 18F-fluoromisonidazole positron
emission tomography. BJU Int. 96:540–546. 2005. View Article : Google Scholar : PubMed/NCBI
|
|
10
|
Eschmann SM, Paulsen F, Reimold M,
Dittmann H, Welz S, Reischl G, Machulla HJ and Bares R: Prognostic
impact of hypoxia imaging with 18F-misonidazole PET in non-small
lung cancer and head and neck cancer before radiotherapy. J Nucl
Med. 46:253–260. 2005.PubMed/NCBI
|
|
11
|
Murakami M, Zhao S, Zhao Y, Chowdhury NF,
Yu W, Nishijima K, Takiguchi M, Tamaki N and Kuge Y: Evaluation of
changes in the tumor microenvironment after sorafenib therapy by
sequential histology and 18F-fluoromisonidazole hypoxia imaging in
renal cell carcinoma. Int J Oncol. 41:1593–1600. 2012.PubMed/NCBI
|
|
12
|
Escudier B, Eisen T, Stadler WM, Szczylik
C, Oudard S, Siebels M, Negrier S, Chevreau C, Solska E, Desai AA,
et al: Sorafenib in advanced clear-cell renal-cell carcinoma. N
Engl J Med. 356:125–134. 2007. View Article : Google Scholar : PubMed/NCBI
|
|
13
|
Tang G, Wang M, Tang X, Gan M and Luo L:
Fully automated one-pot synthesis of [18F] fluoromisonidazole. Nucl
Med Biol. 32:553–558. 2005. View Article : Google Scholar : PubMed/NCBI
|
|
14
|
Oh SJ, Chi DY, Mosdzianowski C, Kim JY,
Gil HS, Kang SH, Ryu JS and Moon DH: Fully automated synthesis of
[18F] fluoromisonidazole using a conventional [18F] FDG module.
Nucl Med Biol. 32:899–905. 2005. View Article : Google Scholar : PubMed/NCBI
|
|
15
|
Zhao S, Kuge Y, Mochizuki T, Takahashi T,
Nakada K, Sato M, Takei T and Tamaki N: Biologic correlates of
intratumoral heterogeneity in 18F-FDG distribution with regional
expression of glucose transporters and hexokinase-II in
experimental tumor. J Nucl Med. 46:675–682. 2005.PubMed/NCBI
|
|
16
|
Brown RS, Leung JY, Fisher SJ, Frey KA,
Ethier SP and Wahl RL: Intratumoral distribution of tritiated
fluorodeoxyglucose in breast carcinoma. I. Are inflammatory cells
important? J Nucl Med. 36:1854–1861. 1995.PubMed/NCBI
|
|
17
|
Toyama H, Ichise M, Liow JS, Modell KJ,
Vines DC, Esaki T, Cook M, Seidel J, Sokoloff L, Green MV and Innis
RB: Absolute quantification of regional cerebral glucose
utilization in mice by 18F-FDG small animal PET scanning and
2-14C-DG autoradiography. J Nucl Med. 45:1398–1405. 2004.PubMed/NCBI
|
|
18
|
Shinojima T, Oya M, Takayanagi A, Mizuno
R, Shimizu N and Murai M: Renal cancer cells lacking hypoxia
inducible factor (HIF)-1alpha expression maintain vascular
endothelial growth factor expression through HIF-2alpha.
Carcinogenesis. 28:529–536. 2007. View Article : Google Scholar : PubMed/NCBI
|
|
19
|
Iliopoulos O, Kibel A, Gray S and Kaelin
WG Jr: Tumour suppression by the human von Hippel-Lindau gene
product. Nat Med. 1:822–826. 1995. View Article : Google Scholar : PubMed/NCBI
|
|
20
|
Kaelin WG Jr: Molecular basis of the VHL
hereditary cancer syndrome. Nat Rev Cancer. 2:673–682. 2002.
View Article : Google Scholar : PubMed/NCBI
|
|
21
|
Wilhelm SM, Carter C, Tang L, Wilkie D,
McNabola A, Rong H, Chen C, Zhang X, Vincent P, McHugh M, et al:
BAY 43–9006 exhibits broad spectrum oral antitumor activity and
targets the RAF/MEK/ERK pathway and receptor tyrosine kinases
involved in tumor progression and angiogenesis. Cancer Res.
64:7099–7109. 2004. View Article : Google Scholar : PubMed/NCBI
|