Introduction
Cholangiocarcinoma (CCA) is a malignant
transformation of biliary epithelial cells. It is a slow growing
tumor, but it is also highly metastatic with a poor prognosis
(1). The highest incidence of this
cancer has been identified in Asia, particularly in Northeast
Thailand (2). In the majority of
cases of CCA, the etiology is unknown. Chronic inflammation and
cellular injury within bile ducts, together with the partial
obstruction of bile flow result in high-risk conditions for CCA
development (3). The tumor not only
may develop mechanisms to survive in the toxic environment of bile,
but may also utilize bile components to promote cell growth,
survival and invasion (4–6). Bile acids are known to transactivate the
epidermal growth factor receptor (EGFR) in cholangiocytes and
induce cyclooxygenase-2 (COX-2) expression (4,5). These
consequences contribute to promote angiogenesis and facilitate
cellular growth of various cancer types (5). Furthermore, bile acids enhance the
levels of a potent antiapoptotic protein, myeloid cell leukemia
protein 1 (Mcl-1), in CCA cells (4).
Alteration of bile composition during chronic
inflammation may be important for the carcinogenesis and
progression of tumors of the biliary tract (7). Deoxycholic acid (DCA) exerts a
pro-carcinogenic effect through the induction of EGFR activation,
which in turn leads to stimulation of the mitogen activated protein
kinase (MAPK) signaling cascade with associated activation of
extracellular signal-regulated kinase 1/2, p38 and c-Jun N-terminal
kinase proteins (4,8). Taurocholic acid (TCA) is known to
stimulate the secretion of certain cytokines, including monocyte
chemoattractant protein-1 (MCP-1) and interleukin-6 (IL-6), from
cholangiocytes, which are involved in the inflammatory and fibrotic
processes that occur during cholestatic diseases (9). Additionally, chenodeoxycholic acid
(CDCA) and lithocholic acid (LCA) could promote CCA invasiveness
via stimulating the Snail signaling pathway, leading to the
downregulation of E-cadherin (10).
The present study aimed to investigate the effects
of bile acids on the migration of human CCA cells. To elucidate the
potential underlying mechanisms of bile acid-induced cell
migration, the protein expression profiles of bile acid-treated CCA
cells were studied using a proteomic approach.
Materials and methods
Cell lines and cell culture
The KKU-M213 cell line, which was established from a
primary tumor mass of intrahepatic CCA (11), was provided by the Liver Fluke and
Cholangiocarcinoma Research Center, Faculty of Medicine, Khon Kaen
University (Khon Kaen, Thailand). An immortalized cholangiocyte
cell line, MMNK-1, which was established by Maruyama et al
(12), was used as the control. The
two cell lines were cultured in Ham's F-12 (Gibco; Thermo Fisher
Scientific, Inc., Waltham, MA, USA) culture medium supplemented
with 10% fetal bovine serum (Gibco; Invitrogen; Thermo Fisher
Scientific, Inc.), 100 U/ml penicillin and 100 µg/ml streptomycin.
The cells were incubated at 37°C in a 5% CO2 atmosphere.
The two cell lines were confirmed to be Mycoplasma-free via
using specific polymerase chain reaction.
Bile acid treatment
KKU-M213 and MMNK-1 cells were treated with 100 µM
of each bile acid (10) as follows:
Cholic acid (CA), DCA, TCA, taurodeoxycholic acid (TDCA),
glycocholic acid (GCA) and glycodeoxycholic acid (GDCA). The bile
acids were purchased from Sigma-Aldrich (Merck KGaA, Darmstadt,
Germany). All of the bile acids used in the present study were kept
as 10 mM stock solutions in dimethyl sulfoxide (DMSO) and stored at
−20°C.
In vitro wound healing assay
The two cell lines were cultured at 37°C except
otherwise stated, and were seeded into a 24-well culture plate at a
density of 2×10⁵ cells/well. The cells were
serum-starved for 24 h to avoid possible serum effects (13). Then, they were pretreated with
serum-free medium containing 100 µM of each bile acid for 24 h
prior to wound formation. The ‘scratch’ wounds were created using a
sterile 10 µl pipette tip (10). The
old medium was discarded and the wells were washed twice with
sterile PBS. A total of 200 µl/well of freshly prepared serum-free
medium containing each bile acid was added. The cells were
incubated with bile acids for 12 and 24 h at 37°C. The wound edges
were imaged using a digital camera fitted to a light microscope
with ×10 objective lens. The images were captured at 0, 12 and 24 h
following wounding (10). The degree
of wound closure was measured at three independent wound sites per
each treatment group at 0, 12 and 24 h. The percentage of cell
migration was calculated according to the following formula:
[Distance of edge at 0–12 h (or 24 h)/distance of edge at 0 h]
×100. Values from three independent experiments were pooled and
expressed as the mean ± standard deviation.
Two-dimensional gel electrophoresis
(2-DE)
KKU-M213 and MMNK-1 cells treated with or without
100 µM CA or DCA were harvested by centrifugation at 500 × g for 5
min at 4°C and mixed with the equal concentration of lysis buffer
consisting of 7 M urea, 2 M thiourea, 4% 3-[(3-cholamidopropyl)
dimethylammonio]-1-propanesulfonate (CHAPS), 2% IPG buffer, 40 mM
dithiothreitol (DTT), and inhibitors of protease and phosphatase,
for 10 min on ice. Following centrifugation at 20,000 × g for 30
min at 4°C, the supernatant was collected and desalted using a 2-D
Clean Up kit (GE Healthcare Life Sciences, Chalfont, UK). Protein
concentrations of all samples were determined using Bradford
reagent (Thermo Fisher Scientific, Inc., Waltham, MA, USA). A total
of 10 µg protein sample in 125 µl 7 M urea, 2 M thiourea, 2% (w/v)
CHAPS, 1% IPG buffer, 0.002% (w/v) bromophenol blue and 40 mM DTT
was loaded onto a 7-cm-long, pH 4.0–7.0 IPG strip (GE Healthcare
Life Sciences). Electrofocusing was performed according to the
manufacturer's protocol. Following focusing, the strips were
reduced with 130 mM DTT for 15 min at room temperature and then
alkylated with 135 mM iodoacetamide for 15 min at room temperature
in equilibration buffer [6 M urea, 75 mM Tris-HCl (pH 8.8), 29.3%
glycerol, 2% SDS, 0.002% (w/v) bromophenol blue]. The second
dimensional separation was performed in a SE260
Mini-Vertical Electrophoresis unit (GE Healthcare Life Sciences)
with a constant current at 20 mA/gel for 90 min. Separated protein
spots were visualized using silver staining. Images were collected
and analyzed using ImageMaster™ 2D Platinum software (version 7.0;
GE Healthcare Life Sciences). To determine the increase in
intensity of the protein spots of CA- and DCA-treated CCA cells and
MMNK-1 cells, the values of the untreated counterparts were
subtracted. Subsequently, the statistical differences of the
expression levels between CCA and MMNK-1 cells were assessed using
a Student's t-test, and P<0.01 was considered to indicate a
statistically significant difference.
In-gel tryptic digestion
The protein spots in 2-DE were manually punched with
a pipette tip and kept in 20 µl sterile distilled water at 4°C. The
gel pieces were transferred to a 96-well plate and each gel was
processed for in-gel digestion. Briefly, the gel pieces were
dehydrated twice in 100% acetronitrile (ACN) for 5 min each with
agitation and dried at room temperature for 10 min. Subsequently,
proteins were reduced with 10 mM DTT/10 mM ammonium bicarbonate
(NH4HCO3) for 1 h at 56°C, and then alkylated
with 100 mM iodoacetamide (IAA)/10 mM NH4HCO3
for 1 h at room temperature in the dark. The gel pieces were
dehydrated twice in 100% ACN for 5 min each with agitation.
Following reduction and alkylation, 20 µl of 10 ng/µl trypsin in 10
mM NH4HCO3 was added, and incubated for 20
min prior to adding 20 µl of 30% ACN, and then incubated overnight
at room temperature. The tryptic peptides were extracted from the
gel three times with 30 µl of 50% ACN/0.1% formic acid for 10 min
at room temperature. Finally, the tryptic peptide mixtures were
dried and kept at 40°C overnight. Samples were resuspended in 0.1%
formic acid/water and centrifuged at 10,000 × g for 10 min. Samples
were applied to liquid chromatography tandem-mass spectrometry
(LC-MS/MS) analysis.
LC-MS/MS analysis
LC-MS/MS analyses of the digested peptide mixtures
were performed using a Waters® SYNAPT™ HDMS™ system (Waters
Corporation, Milford, MA, USA). The 1D-nanoLC was performed with a
Waters® nanoACQUITY UPLC® system (Waters Corporation) at 0°C. A
total of 4 µl tryptic digests were injected onto the reversed phase
analytical chromatography column (20 cm × 75 µm) packed with a 1.7
µm Bridged Ethyl Hybrid C18 material (Waters Corporation). Peptides
were eluted with a linear gradient from 2–40% acetonitrile
developed over 60 min at a flow rate of 350 nl/min. This was
followed by a 15 min period of 80% acetonitrile to clean the column
prior to returning to 2% acetonitrile for the next sample.
The MS/MS data were used to identify proteins from
the primary protein sequence database using Mascot software version
2.3 (Matrix Science, Ltd., London, UK) (14). The data were searched against the
National Center for Biotechnology Information database for protein
identification (http://www.ncbi.nlm.nih.gov). Database interrogations
included taxonomy (Homo sapiens), enzyme (trypsin), variable
modifications (carbamidomethyl, oxidation of methionine residues),
mass values (monoisotopic), protein mass (unrestricted), peptide
mass tolerance (1.2 Da), fragment mass tolerance (±0.6 Da), peptide
charge state (1+, 2+ and 3+) and maximum number of missed cleavages
(1). Protein hits with the highest
Molecular Weight Search score with accurate molecular mass and
isoelectric point values according to the 2D-gel appearance were
reported.
Tumor samples
CCA tissue samples, including cancerous and adjacent
non-cancerous tissue samples, were obtained from 3 patients (a
44-year-old female, 47- and 49-year-old males) immediately
following surgical operation on September 2010, January and
December 2011, respectively, which were provided by the Liver
Flukes and Cholangiocarcinoma Research Center, Faculty of Medicine,
Khon Kaen University. The inclusion criteria of the 3 patients were
CCA without lymph node metastasis and long (53–64 weeks) survival.
Tissue samples were immediately snap-frozen in liquid nitrogen and
stored at −80°C until use. A part of each frozen tissue section was
fixed in 4% buffered formalin, and processed for histological
examination using hematoxylin and eosin staining. In this study,
CCA specimen from only 3 cases were used, because this is our first
trial to examine the expression level of CCDC25 in CCA; therefore,
the present study decided to use a minimum number of freshly
prepared samples. The present study was approved by the Khon Kaen
University Ethics Committee for Human Research (no. HE571416).
Written informed consent was obtained from all participating
patients.
Western blot analysis
To validate CCDC25 protein expression, three paired
cancerous and adjacent non-cancerous tissue samples were examined
using western blot analysis with an anti-human CCDC25 antibody at
1:500 dilution (cat no. orb2517; Biorbyt, Ltd., Cambridge, UK).
Briefly, ~100–200 mg frozen CCA and adjacent noncancerous tissue
samples were washed in ice-cold PBS (0.1 M sodium phosphate, 0.15 M
sodium chloride, pH 7.2) to remove any blood clots and connective
tissue. Samples were incubated with lysis buffer consisting of 7 M
urea, 2 M thiourea, 4% CHAPS, 2% IPG buffer, 40 mM DTT, and
inhibitors of protease and phosphatase for 10 min on ice. Following
centrifugation at 20,000 × g for 30 min at 4°C, the supernatant was
collected. A total of 50 µg protein was separated using a 12.5%
SDS-PAGE and transferred to a polyvinylidene difluoride membrane
(GE Healthcare Life Sciences) for 1 h at room temperature.
Subsequently, the membrane was blocked with 5% skim milk powder in
Tris-buffered saline with 0.1% Tween-20 (TBS-T, pH 7.4) for 1 h at
room temperature. The membrane was then incubated overnight at 4°C
with a rabbit polyclonal antibody directed against human CCDC25.
Following washing with 0.1% TBS-T, the membrane was incubated for 1
h at room temperature with a horseradish peroxidase-conjugated goat
anti-rabbit IgG secondary antibody (cat no. NA934-1ML; GE
Healthcare Life Sciences) diluted (1:5,000) in 5% skim milk/TBS-T.
The chemiluminescence was detected using an ECL plus system (GE
Healthcare Life Sciences) and then visualized using the ImageQuant™
LAS mini 400. A primary antibody directed against β-actin at 1:500
dilution (cat no. orb10033; Biorbyt, Ltd.) was used as the
control.
Bioinformatics using STITCH
The potential interactions of the identified
proteins were analyzed using STITCH (version 3.1; http://stitch.embl.de) (14). The input page icon was selected
followed by ‘multiple names’. The list of proteins names, including
CCDC25, was entered and ‘Homo sapiens’ was selected as the
organism. The page depicted ‘list names’ followed by the confidence
view. Stronger associations were presented as thicker lines.
Protein-protein interactions were indicated as solid lines,
chemical-protein interactions as dashed lines and interactions
between chemicals as dotted lines. High confidence interactions
were identified if they possessed a score >0.7 (15).
Statistical analysis
Data are presented as the mean ± standard error of
the mean following three independent experiments using Microsoft
Excel 2010 software (Microsoft Corporation, Redmond, WA, USA).
Comparison of data between the groups was analyzed using Student's
t-tests for parametric data, and Mann-Whitney U tests for
nonparametric data. P<0.05 was considered to indicate a
statistically significant difference. The GraphPad Prism v.5
software (GraphPad Software Inc., La Jolla, CA, USA) was used for
statistical analyses.
Results
CA and DCA treatment enhances CCA cell
migration
Using the wound-healing assay, the migration of
KKU-M213 cells was compared with that of MMNK-1 cells. Without bile
acid stimulation, the degree of migration of KKU-M213 and MMNK-1
cells at 12 h and also 24 h were not significantly different from
each other (Table I). Following
treatment of KU-M213 and MMNK-1 cells with various bile acids, cell
motility was assessed using a wound-healing assay. Both CA and DCA
were demonstrated to enhance cell migration, with a significantly
higher efficacy on KKU-M213 cells compared with MMNK-1 cells at 12
(P=0.021 and 0.002) and 24 h (P=0.001 and 0.001), respectively
(Table I). The other four types of
bile acids did not significantly induce cell migration following 24
h of incubation.
 | Table I.Effect of bile acids on migration of
KKU-M213 and MMNK-1 cells in wound healing assays. |
Table I.
Effect of bile acids on migration of
KKU-M213 and MMNK-1 cells in wound healing assays.
|
| %
Migrationa (mean ±
standard error of the mean) |
| P-valueb |
|---|
|
|
|
|
|
|---|
| Bile acid
treatment | 12 h | 24 h | Migration
comparison | 12 h | 24 h |
|---|
| None |
|
|
KKU-M213<MMNK-1 |
|
|
|
KKU-M213 | 15.5±2.0 |
167±1.9 |
| 0.466 | 0.147 |
|
MMNK-1 | 19.3±5.3 | 24.4±3.3 |
|
|
|
| CA |
|
|
KKU-M213>MMNK-1 |
|
|
|
KKU-M213 | 27.3±5.6 | 36.7±5.6 |
| 0.021 | 0.010 |
|
MMNK-1 | 10.0±3.3 | 22.8±2.0 |
|
|
|
| DCA |
|
|
KKU-M213>MMNK-1 |
|
|
|
KKU-M213 | 23.6±4.3 | 32.0±4.3 |
| 0.002 | 0.001 |
|
MMNK-1 |
3.1±1.7 |
9.1±2.7 |
|
|
|
| TCA |
|
|
KKU-M213<MMNK-1 |
|
|
|
KKU-M213 | 20.0±4.9 | 34.1±5.0 |
| 0.003 | 0.101 |
|
MMNK-1 | 38.1±2.3 | 44.9±3.6 |
|
|
|
| TDCA |
|
|
KKU-M213<MMNK-1 |
|
|
|
KKU-M213 | 21.2±2.3 | 35.8±3.2 |
| 0.022 | 0.953 |
|
MMNK-1 | 32.3±3.2 | 36.5±2.3 |
|
|
|
| GCA |
|
|
KKU-M213<MMNK-1 |
|
|
|
KKU-M213 | 17.9±3.2 | 22.4±4.3 |
| <0.001 | <0.001 |
|
MMNK-1 | 36.8±2.9 | 52.6±3.4 |
|
|
|
| GDCA |
|
|
KKU-M213<MMNK-1 |
|
|
|
KKU-M213 | 21.0±3.8 | 33.5±4.5 |
| 0.072 | 0.543 |
|
MMNK-1 | 28.2±3.3 | 36.5±4.3 |
|
|
|
Effect of bile acids on protein
expression in CCA cells
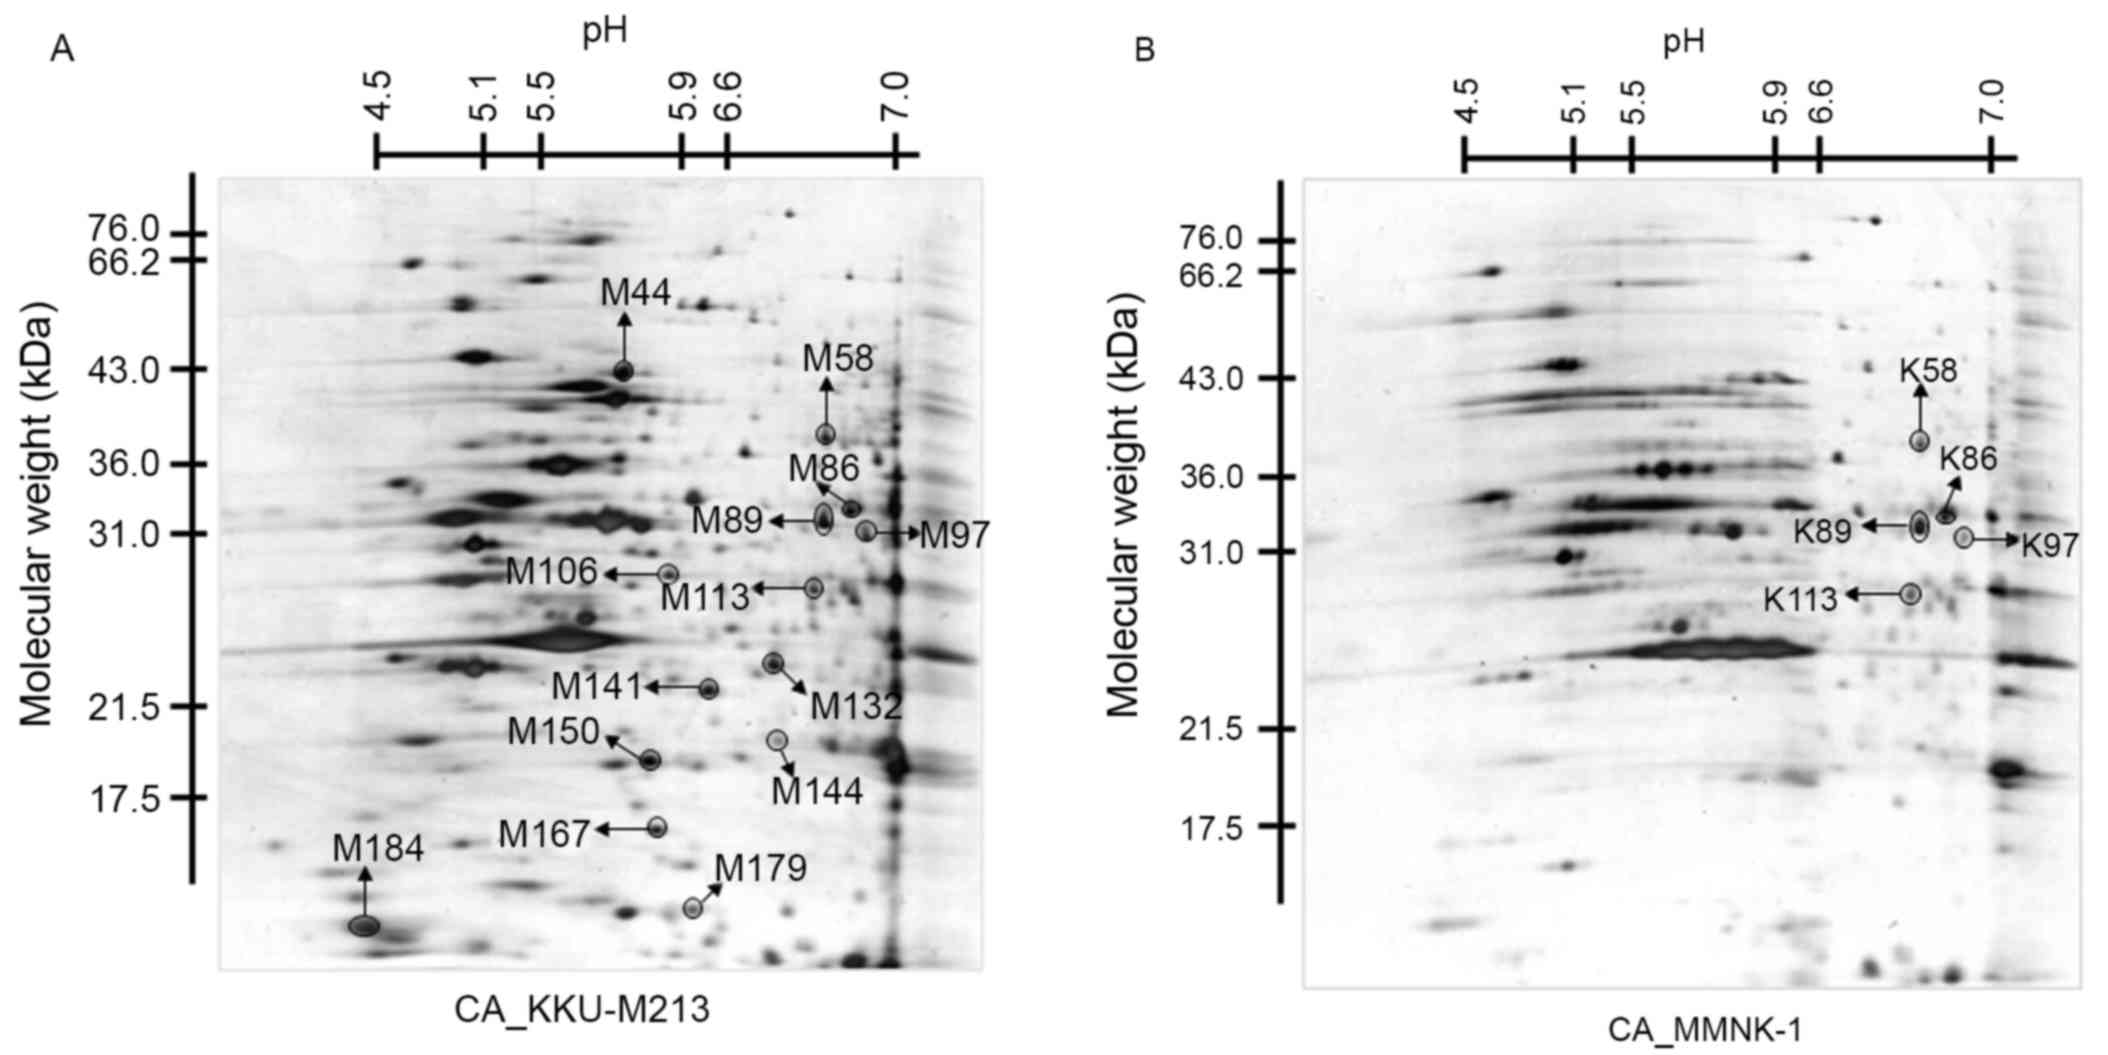
To assess whether the CA- or DCA-induced enhancement
of cell migration is associated with changes in protein expression,
protein expression profiles were assessed using 2-DE. The protein
profile of KKU-M213 cells in the 2D images was compared with that
of MMNK-1 cells under CA- (Fig. 1)
and DCA-treated conditions (data not presented). Prior to
comparison, all spots were subtracted by each untreated condition
to select candidate spots for matched spots analysis.
Following spot matching analysis of the CA-treated
group, 19 protein spots were identified to be overexpressed and 19
protein spots were underexpressed in KKU-M213 cells, compared with
in the MMNK-1 cells. Furthermore, 77 protein spots were observed
only in KKU-M213 cells. In the DCA-treated group, 31 protein spots
were identified to be overexpressed and 37 protein spots were
underexpressed in KKU-M213 cells, compared with those in the MMNK-1
cells. Additionally, 50 protein spots were detected only in
KKU-M213 cells. The protein spots that were expressed exclusively
in KKU-M213 cells, or those that demonstrated ≥2-fold higher
differences in density in the same spot in MMNK-1 cells in
triplicate gels (14 spots for CA- and 13 spots in the DCA-treated
condition), were excised and subjected to in-gel digestion for
further MS analysis.
Following MS analysis, only 1/27 spots exhibited a
protein score >56 (significantly different hit, P<0.05),
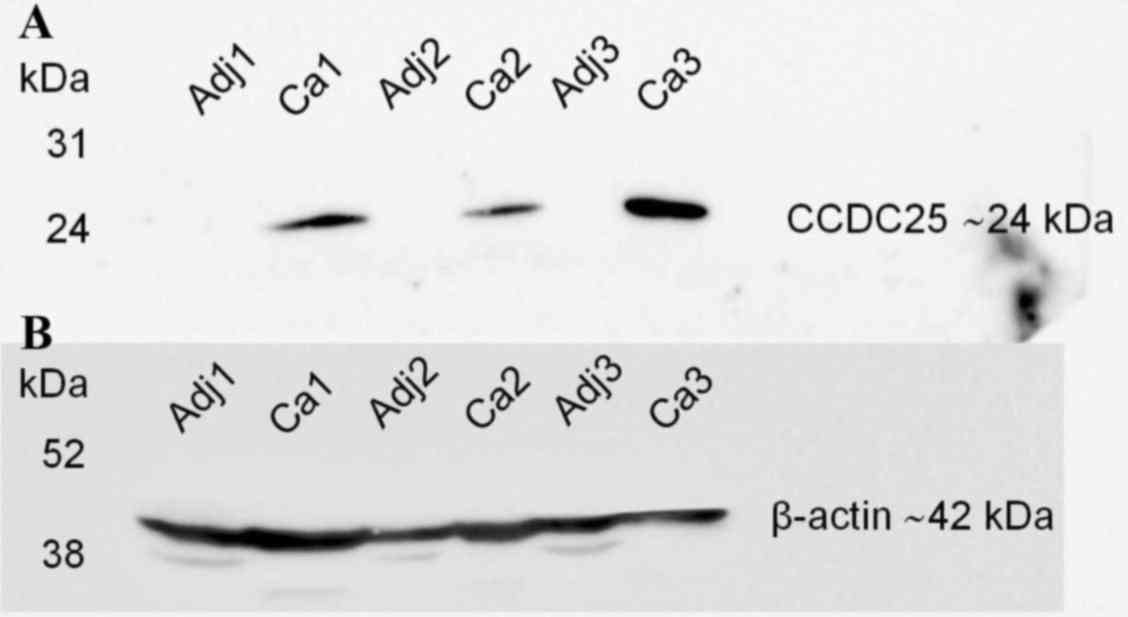
which was CCDC25 in the spot M97. As illustrated in Fig. 2, this spot was significantly expressed
in KKU-M213 cells treated with CA (Fig.
1). The protein scores of all other spots were <56. The
expression levels of CCDC25 in the tissue lysates of CCA and
adjacent non-cancerous tissue samples obtained from three patients
were examined using western blot analysis. High expression of the
CCDC25 protein was observed in the CCA tissue, but not in the
adjacent non-cancerous tissues (Fig.
2).
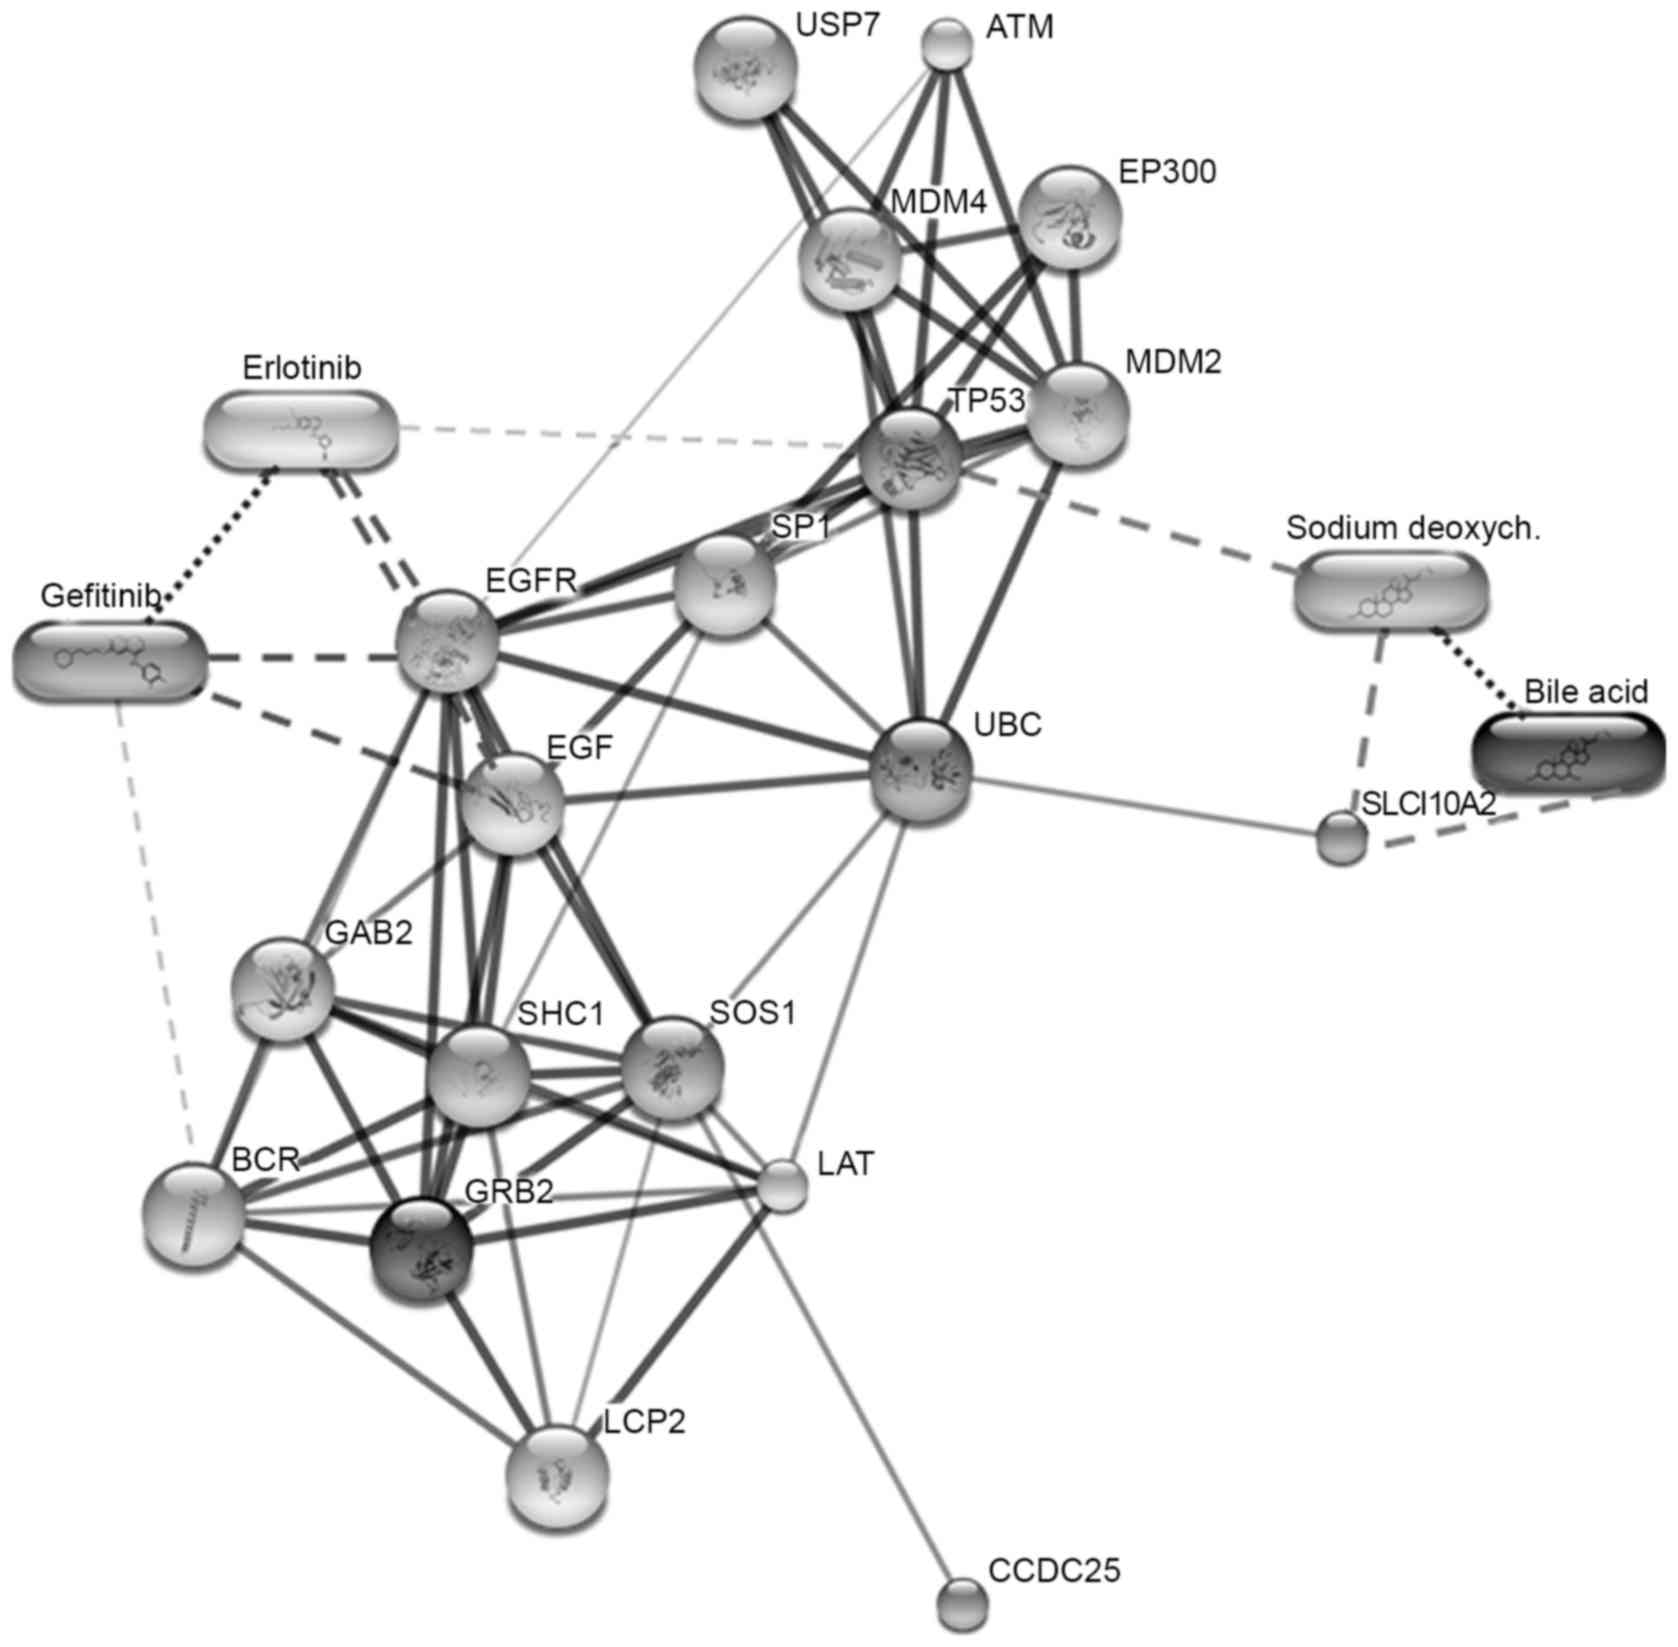
Protein profiles identify two putative
migration-associated EGFRs
Association or interaction of the putative
migration-associated proteins, including EGF, EGFR, growth factor
receptor-bound protein 2 (GRB2), CCDC25, Son of sevenless homolog 1
(SOS1) and Src homology 2 domain containing transforming protein 1,
were predicted using STITCH software (version 3.1). CCDC25 was
identified to be associated with SOS1 and GRB2. These two proteins
are predicted to associate with EGFR signaling (15). Therefore, CCDC25 may be a novel
initiator for EGF signaling pathways involved in cancer cell
migration (Fig. 3).
Discussion
The present results demonstrated that CA and DCA
enhance the migration of CCA cells (KKU-M213) but not of control
(MMNK-1) cells. Stimulation of cancer progression by bile acids
requires numerous signaling pathways, including
phosphoinositide-3-kinase, protein kinase C, MAPK and COX-2
(3). Pai et al (16) reported that DCA activated the
β-catenin signaling pathway, which increased the growth and
invasion of colon cancer cells. Debruyne et al (17) demonstrated that bile acids are able to
stimulate the invasion and haptotaxis of human colorectal cancer
cells through the activation of multiple oncogenic signaling
pathways. Unconjugated CDCA and LCA at concentrations of 100 µM may
activate the transcription of the Snail gene, which downregulates
the expression of E-cadherin and, as a consequence, promote the
invasion of human hepatocellular carcinoma cells (9). These results imply that the stimulatory
effects of bile acids on cancer cells are variable depending on the
combination of various forms of bile acids and cancer cells.
In the present study, CA and DCA were observed to
alter the protein expression patterns of CCA cells and
cholangiocytes. CA and DCA are unconjugated forms; unconjugated
hydrophobic bile acids possess higher affinities for nuclear
receptors, such as the farnesoid X receptor, compared with
conjugated hydrophilic bile acids (10), thus may have an effect on cancer
progression. It is hypothesized that unconjugated bile acids, which
can enter the cells via passive diffusion through the plasma
membrane, can directly activate nuclear receptors and modulate the
transcriptional activity of stimulating protein1 (Sp1) on the Snail
promotor (10). Certain reports have
indicated that unconjugated bile acids may induce cell apoptosis,
particularly at high concentrations (>100 µM) (18–20).
In the present study, a proteomic approach revealed
that CA and DCA upregulate the protein expression of KKU-M213 cells
more compared with that of MMNK-1 cells. Among the upregulated
proteins in KKU-M213 cells stimulated by CA, only CCDC25 was
expressed significantly higher in KKU-M213 cells, compared with in
control MMNK-1 cells. When CCDC25 protein expression in the CCA
tissue and adjacent non-cancerous tissue samples was examined using
western blot analysis, CCDC25 was highly expressed in CCA but not
in the adjacent non-cancerous tissue of all three samples. The
function of CCDC25 remains poorly understood. Previously, it has
been reported that the deletion of a cluster of six genes on
chromosome 8p, including CCDC25, was found to be associated with
poor prognosis of hepatocellular carcinoma patients (21).
In the present study, the identified proteins and
biomolecules of interest were submitted to the STITCH database to
investigate potential cellular functions, and identify the
associated functional interactions among proteins in the cell
(15). The results revealed strong
interactions between CCDC25 and SOS1 or GRB2, which are also highly
associated with EGFR signaling. Previous studies revealed that DCA
at 200 µM induced COX-2 protein expression via the activation of
EGFR (3) and could also increase
cellular Mcl-1 protein expression by inhibiting its degradation via
activating the EGFR/RAF proto-oncogene serine/threonine-protein
kinase signaling cascade in human CCA cell lines (4). Further studies to investigate the
molecular mechanisms underlying the upregulation of CCD25
expression by unconjugated bile acids and the interactions between
CCDC25, SOS1 and GRB2 are warranted. In conclusion, the results of
the present study demonstrated that CA can act as a stimulator of
cell migration and can increase the expression levels of CCD25 in a
human CCA cell line. This molecule is hypothesized to be involved
in cell migration via the EGFR signaling pathway. The inhibition of
this protein may be an alternative therapeutic option for the
treatment of patients with CCA in the future.
Acknowledgements
The authors would like to thank the Centre for
Research and Development of Medical Diagnostic Laboratories,
Faculty of Associated Medical Sciences for providing supporting
instruments, and the Liver Flukes and Cholangiocarcinoma Research
Center, Faculty of Medicine (both Khon Kaen University) for
providing cell lines and tissue samples from patients with CCA. In
addition, the authors would like to thank Professor Yukifumi Nawa
for manuscript editing, and Ms Janthima Jaresitthikunchai, Ms
Naumon Phaonakrop, Ms Daraporn Chua-on and Ms Chatthawee
Charadchaiyanun for technical support throughout the proteome and
western blotting analyses. The present study was supported by Khon
Kaen University (grant no. KKU580602).
References
|
1
|
Malaguarnera G, Paladina I, Giordano M,
Malaguarnera M, Bertino G and Berretta M: Serum markers of
intrahepatic cholangiocarcinoma. Dis Markers. 34:219–228. 2013.
View Article : Google Scholar : PubMed/NCBI
|
|
2
|
Lazaridis KN and Gores GJ:
Cholangiocarcinoma. Gastroenterology. 128:1655–1667. 2005.
View Article : Google Scholar : PubMed/NCBI
|
|
3
|
Sirica AE: Cholangiocarcinoma: Molecular
targeting strategies for chemoprevention and therapy. Hepatology.
41:5–15. 2005. View Article : Google Scholar : PubMed/NCBI
|
|
4
|
Yoon JH, Higuchi H, Werneburg NW, Kaufmann
SH and Gores GJ: Bile acids induce cyclooxygenase-2 expression via
the epidermal growth factor receptor in a human cholangiocarcinoma
cell line. Gastroenterology. 122:985–993. 2002. View Article : Google Scholar : PubMed/NCBI
|
|
5
|
Yoon JH, Werneburg NW, Higuchi H, Canbay
AE, Kaufmann SH, Akgul C, Edwards SW and Gores GJ: Bile acids
inhibit Mcl-1 protein turnover via an epidermal growth factor
receptor/Raf-1-dependent mechanism. Cancer Res. 62:6500–6505.
2002.PubMed/NCBI
|
|
6
|
Gupta RA and Dubois RN: Colorectal cancer
prevention and treatment by inhibition of cyclooxygenase-2. Nat Rev
Cancer. 1:11–21. 2001. View
Article : Google Scholar : PubMed/NCBI
|
|
7
|
Gores GJ: Cholangiocarcinoma: Current
concepts and insights. Hepatology. 37:961–969. 2003. View Article : Google Scholar : PubMed/NCBI
|
|
8
|
Yoon JH, Canbay AE, Werneburg NW, Lee SP
and Gores GJ: Oxysterols induce cyclooxygenase-2 expression in
cholangiocytes: Implications for biliary tract carcinogenesis.
Hepatology. 39:732–738. 2004. View Article : Google Scholar : PubMed/NCBI
|
|
9
|
Lamireau T, Zoltowska M, Levy E, Yousef I,
Rosenbaum J, Tuchweber B and Desmoulière A: Effects of bile acids
on biliary epithelial cells: Proliferation, cytotoxicity, and
cytokine secretion. Life Sci. 72:1401–1411. 2003. View Article : Google Scholar : PubMed/NCBI
|
|
10
|
Fukase K, Ohtsuka H, Onogawa T, Oshio H,
Ii T, Mutoh M, Katayose Y, Rikiyama T, Oikawa M, Motoi F, et al:
Bile acids repress E-cadherin through the induction of Snail and
increase cancer invasiveness in human hepatobiliary carcinoma.
Cancer Sci. 99:1785–1792. 2008. View Article : Google Scholar : PubMed/NCBI
|
|
11
|
Sripa B, Leungwattanawanit S, Nitta T,
Wongkham C, Bhudhisawasdi V, Puapairoj A, Sripa C and Miwa M:
Establishment and characterization of an opisthorchiasis-associated
cholangiocarcinoma cell line (KKU-100). World J Gastroenterol.
11:3392–3397. 2005. View Article : Google Scholar : PubMed/NCBI
|
|
12
|
Maruyama M, Kobayashi N, Westerman KA,
Sakaguchi M, Allain JE, Totsugawa T, Okitsu T, Fukazawa T, Weber A,
Stolz DB, et al: Establishment of a highly differentiated
immortalized human cholangiocyte cell line with SV40T and hTERT.
Transplantation. 77:446–451. 2004. View Article : Google Scholar : PubMed/NCBI
|
|
13
|
Werneburg NW, Yoon JH, Higuchi H and Gores
GJ: Bile acids activate EGF receptor via a TGF-alpha-dependent
mechanism in human cholangiocyte cell lines. Am J Physiol
Gastrointest Liver Physiol. 285:G31–G36. 2003. View Article : Google Scholar : PubMed/NCBI
|
|
14
|
Perkins DN, Pappin DJ, Creasy DM and
Cottrell JS: Probability-based protein identification by searching
sequence databases using mass spectrometry data. Electrophoresis.
20:3551–3567. 1999. View Article : Google Scholar : PubMed/NCBI
|
|
15
|
Kuhn M, Szklarczyk D, Pletscher-Frankild
S, Blicher TH, von Mering C, Jensen LJ and Bork P: STITCH 4:
Integration of protein-chemical interactions with user data.
Nucleic Acids Res. 42(Database Issue): D401–D407. 2014. View Article : Google Scholar : PubMed/NCBI
|
|
16
|
Pai R, Tarnawski AS and Tran T:
Deoxycholic acid activates beta-catenin signaling pathway and
increases colon cell cancer growth and invasiveness. Mol Biol Cell.
15:2156–2163. 2004. View Article : Google Scholar : PubMed/NCBI
|
|
17
|
Debruyne PR, Bruyneel EA, Karaguni IM, Li
X, Flatau G, Müller O, Zimber A, Gespach C and Mareel MM: Bile
acids stimulate invasion and haptotaxis in human colorectal cancer
cells through activation of multiple oncogenic signaling pathways.
Oncogene. 21:6740–6750. 2002. View Article : Google Scholar : PubMed/NCBI
|
|
18
|
Perez MJ and Briz O: Bile-acid-induced
cell injury and protection. World J Gastroenterol. 15:1677–1689.
2009. View Article : Google Scholar : PubMed/NCBI
|
|
19
|
Powell AA, LaRue JM, Batta AK and Martinez
JD: Bile acid hydrophobicity is correlated with induction of
apoptosis and/or growth arrest in HCT116 cells. Biochem J.
356:481–486. 2001. View Article : Google Scholar : PubMed/NCBI
|
|
20
|
Milovic V, Teller IC, Murphy GM, Caspary
WF and Stein J: Deoxycholic acid stimulates migration in colon
cancer cells. Eur J Gastroenterol Hepatol. 13:945–949. 2001.
View Article : Google Scholar : PubMed/NCBI
|
|
21
|
Roessler S, Long EL, Budhu A, Chen Y, Zhao
X, Ji J, Walker R, Jia HL, Ye QH, Qin LX, et al: Integrative
genomic identification of genes on 8p associated with
hepatocellular carcinoma progression and patient survival.
Gastroenterology. 142957–966. (e12)2012. View Article : Google Scholar : PubMed/NCBI
|