Introduction
Colorectal cancer (CRC) is a commonly diagnosed
cancer. It is the third most common fatal malignancy and third
leading cause of cancer-associated mortalities in the western world
(1). The etiology of CRC is
multifactorial. Due to the aggressiveness of CRC and the lack of
targeted therapies, it is necessary to investigate the key pathways
required for cancer development and progression.
Central metabolic pathways differ between normal and
cancer cells in their regulation and dynamics. Cancer cells exhibit
increased glucose and glutamine metabolism to fuel their
bioenergetic and biosynthetic demands (2,3). The
increased aerobic glycolysis properties, which show taking up
glucose and converting it into lactate even with the availability
of oxygen, are termed the Warburg effect (4,5). However,
increased glycolysis alone is insufficient to meet the total
metabolic demands of proliferating cancer cells. Actively growing
cells depend on glutaminolysis, which catabolizes glutamine to
generate ATP and maintain the mitochondrial function for
metabolism, which is termed glutamine addiction (6). Elevated glutaminolysis has also been
considered as an important hallmark of cancer (2,7).
The conversion of glutamine into glutamate,
catalyzed by glutaminase (GLS; the first enzyme in glutaminolysis)
is a key process for glutamine-dependent anapleurosis and
glutathione biosynthesis (8). There
are two different subtypes of GLS: GLS1 (kidney-type) and GLS2
(liver-type) (9,10). The elevated expression of GLS1 has
been observed in several types of cancer, including colorectal
cancer (11), prostate cancer
(12) and breast cancer (13). In addition, it has been reported that
multiple genetic factors are implicated in the regulation of GLS1
expression and glutamine metabolism. Myc, as a proto-oncogene,
stimulates the uptake and catabolism of glutamine (14). The Myc family member, c-Myc,
indirectly stimulates GLS1 expression in Burkitt's lymphoma and
prostate cancer cells through suppression of microRNA-23a/b
(15). In addition, the mammalian
target of rapamycin pathway and the extracellular signal-regulated
protein kinase pathway were also shown to be involved in tumor
growth through the regulation of glutaminolysis (16,17). Due
to the important role of GLS1 in cell survival, a number of
small-molecule inhibitors targeting glutaminase have been
developed, including
bis-2-(5-phenylacetamido-1,2,4-thiadiazol-2-yl)ethyl sulfide
(BPTES) (18), compound 968 (19) and CB-839 (13). Although the alterations of cell
metabolism have been observed on a large scale in cancer cells,
less is known regarding how cells respond to nutrient changes and
the outcome in coordinating cell growth in CRCs.
In the present study, to improve the understanding
of the role of GLS1 in solid colorectal tumors and its clinical
significance, GLS1 expression was diminished by RNA interference or
inhibitor and the present study focused on the role of GLS1 in CRC
cells and its potential association with clinical features. It was
demonstrated that the abrogation of GLS1 function notably inhibited
glutaminolysis and aerobic glycolysis, which resulted in the
decrease of internal ATP levels and cell survival. Accordingly,
GLS1 expression was significantly elevated in CRC tissues in
comparison with adjacent normal ones, which was associated with the
cell differentiation status and tumor-node-metastasis (TNM) stage.
These observations highlight the critical associations of GLS1,
glucose uptake and tumor progression, and indicate that glutaminase
inhibitors may provide therapeutic benefit in CRC treatment through
the regulation of glycolysis and glutaminolysis. Due to the
functional importance of GLS1 in regulating cell metabolism, it was
proposed that GLS1 may serve as a target for colorectal cancer
therapy.
Materials and methods
Cell cultures and reagents
Colorectal cancer cell lines HT-29 and HCT116 were
purchased from American Type Culture Collection (Manassas, VA,
USA). The two cell lines were cultured in McCoy's 5A modified
medium (catalog no. 12330031, Gibco; Thermo Fisher Scientific,
Inc., Waltham, MA, USA) supplemented with 10% fetal bovine serum
(FBS) in a humidified atmosphere of 5% CO2 at 37°C.
Nutrient depletion studies were performed using glucose and
glutamine-free Dulbecco's modified Eagle's medium (DMEM) (catalog
no. A1443001, Gibco; Thermo Fisher Scientific, Inc.). Reconstituted
medium for all experiments was supplemented with 10% FBS, and, when
required, glucose (catalog no. A2494001, Gibco; Thermo Fisher
Scientific, Inc.) or glutamine (catalog no. 25030081, Gibco; Thermo
Fisher Scientific, Inc.) was added to the medium to final
concentrations of 25 and 2 mM, respectively. BPTES (SML0601) was
purchased from Sigma-Aldrich; Merck KGaA (Darmstadt, Germany) and
was dissolved in dimethyl sulfoxide at a concentration of 1, 5 or
10 µM for use. The Mission short hairpin (sh)RNA lentiviral
transduction particles (non-target, catalog no. SHC002V; and GLS1,
catalog no. SHCLNV) were purchased from Sigma-Aldrich; Merck KGaA.
The targeting sequence of GLS1 shRNA1 was
5′-GCACAGACATGGTTGGTATAT-3′ (clone ID: TRCN0000051135), and GLS1
shRNA2 was 5′-GCCCTGAAGCAGTTCGAAATA-3′ (clone ID: TRCN0000051136).
HT29 or HCT-116 cells were transfected with GLS1 shRNA1 or shRNA2
respectively. HT29 cells with non-target control or GLS1 shRNA2
were injected into nude mice for xenograft assay. The infection of
mission shRNA lentiviruses transduction particles and selection of
positive colonies were performed according to the supplier's
protocol (Sigma-Aldrich; Merck KGaA). The silencing efficacy of
shRNAs was validated using western blot analysis, as described
subsequently.
Cell growth assays
A total of 1×10⁴ HT29 or HCT116 cells were seeded
onto each well of a 96-well plate with five replicates for each
group in DMEM. On the second day, the medium was changed with or
without glucose or glutamine for 5 days. The cell numbers or cell
viabilities were determined as below. For the MTT assay, 20 ml of
MTT solution (5 mg/ml) was added to each well, and following 4 h of
incubation at 37°C, the medium was aspirated and dimethyl sulfoxide
was added. The optical density values were determined at 570 nm
using a Sunrise microplate reader (Tecan Austria GmbH, Grödig,
Austria). To measure viability by direct counting, cells were
collected and stained with 0.4% Trypan Blue (catalog no. T6146,
Sigma-Aldrich; Merck KGaA). Cells excluding and taking up dye in
the whole slide were counted on a hemocytometer under
phase-contrast microscopy (magnification, ×20; model IX50; Olympus
Corporation, Tokyo, Japan).
Cell death assay
For the Guava ViaCount assay, 5×10⁵ HT29 or HCT116
cells were seeded onto each well of 6-well plate in DMEM. On the
second day, the medium was changed with or without glucose or
glutamine for 48 h. Subsequently, the cells were trypsinized to
produce a single cell suspension and the viable cell number in each
well was counted using the ViaCount assay (Guava Technologies,
Hayward, CA, USA).
Colony formation assay
Cells were seeded onto 60 mm dishes at a density of
200 cells/dish. The cells were grown for 2 weeks in McCoy's 5A
modified medium (catalog no. 12330031, Gibco; Thermo Fisher
Scientific, Inc.) supplemented with 10% FBS at 37°C in a humidified
atmosphere containing 5% CO2. The colonies were
subsequently fixed and stained with 0.1% crystal violet solution.
The colonies were calculated as the mean number of cells in 10
randomly selected fields using phase-contrast microscopy
(magnification, ×20; model IX50; Olympus Corporation, Tokyo,
Japan).
In vivo xenograft assay
Mice were housed in a laminar flow caging system
(Thoren Caging Systems, Inc., Hazleton, PA, USA), and all food,
bedding and water were autoclaved. Male BALB/c nu/nu mice (Beijing
Vital River Laboratory Animal Technology Co., Ltd., Beijing, China)
were aged between 4 and 6 weeks and weighted 18–20 g. They were
injected subcutaneously in the limb with 1×10⁷ HT29 or HCT116 cells
(three animals per group). Tumor growth was monitored by measuring
tumor size using Vernier calipers every week for a 4-week period
and calculating tumor volume using a standard formula: Tumor volume
(mm3)=width (mm2)x length (mm) ×0.5. At the end of the
experiment, tumor weight was assessed by sacrificing the mice by
heart puncture under ether anesthesia as previously described
(20), removing and weighing the
tumor.
Western blot analysis
Cells were collected and lysed in lysis buffer (50
mmol/l Tris, pH 7.5, 250 mmol/l NaCl, 0.1% SDS, 2 mM
dithiothreitol, 0.5% NP-40, 1 mmol/l phenylmethylsulfonyl fluoride
and protease inhibitor cocktail). Protein concentrations were
measured using the bicinchoninic assay kit from Thermo Fisher
Scientific, Inc. A total of 40 µg protein/lane was separated using
10% SDS-PAGE and transferred onto Hybond enhanced chemiluminescence
(ECL) nitrocellulose membranes. Following electrophoresis, proteins
were transferred to a polyvinylidene difluoride membranes (EMD
Millipore, Billerica, MA, USA). The membrane was blocked with 5%
nonfat milk in phosphate-buffered saline for 1 h at room
temperature and subsequently incubated with antibodies against
general GLS1 antibody (catalog no. ab93434, Abcam, Cambridge, UK)
and β-actin antibody (catalog no. bs-0061R, Beijing Biosynthesis
Biotechnology Co., Ltd., Beijing, China) at a dilution of 1:1,000,
overnight at 4°C. The membrane was then incubated with a goat
anti-rabbit immunoglobulin G conjugated with horseradish peroxidase
(1:5,000, catalog no. BA1056, Wuhan Boster Biological Technology,
Ltd., Wuhan, China) secondary antibody, for 1 h at room
temperature, and detected using ECL (Pierce, Rockford, IL, USA) or
the Odyssey Imaging System (Li-Cor Biosciences, Lincoln, NE,
USA).
Metabolic analysis
Glutamine and glutamate levels in the medium were
analyzed using Nova Flex (NOVA Biomedical, Waltham, MA, USA).
Glucose and lactate levels were determined using respective assay
kits purchased from BioVision, Inc. (EZCell™ Direct Glucose Uptake
assay kit, catalog no. K924; EZScreen™ Lactate Colorimetric assay
kit, catalog no. K951, respectively). Data were presented as the
mean of triplicates and were presented as a proportion of the
control group.
ATP analysis assay
ATP Bioluminescence assay kit CLS II (Roche Applied
Science, Madison, WI, USA) was used to determine the intracellular
ATP levels. Following treatment, cells were lysed and ATP levels
were measured according to the manufacturer's protocol.
Tissue sample study
A total of 50 primary human colorectal tumor tissues
and adjacent non-tumor tissues were obtained from Xijing Hospital
of Digestive Diseases (Xijing, China; May 2012-January 2014), with
informed consent obtained from each patient and approval from the
Clinical Research Ethics Committee of Xijing Hospital, the Fourth
Military Medical University (Xi'an, China). In each case, a
diagnosis of primary colorectal cancer was made. All clinical
cancerous specimens were collected through surgery or endoscopy.
All specimens were histologically diagnosed by the Department of
Pathology, Xijing Hospital, Fourth Military Medical University
(Xi'an, China). Information on patient age, sex, size of primary
tumor, tumor differentiation, tumor classification and node
classification were collected and verified using the previously
described system (21) and are
summarized in Table I. The associated
procedures were performed following ethical and legal standards
regarding human subjects.
 | Table I.Association between glutaminase 1
expression and colorectal cancer characteristics. |
Table I.
Association between glutaminase 1
expression and colorectal cancer characteristics.
|
|
| GLS expression,
n |
|
|---|
|
|
|
|
|
|---|
| Parameter | Number | − | + − +++ | P-value |
|---|
| Total | 50 | 16 | 34 |
|
| Sex |
|
|
| 0.189a |
| Male | 26 | 8 | 18 |
|
|
Female | 24 | 8 | 16 |
|
| Differential
status |
|
|
|
<0.001b |
| Poor | 9 | 1 | 8 |
|
|
Moderate | 22 | 5 | 17 |
|
| Well | 19 | 10 | 9 |
|
| TNM stage |
|
|
|
<0.001b |
| I–II | 8 | 6 | 2 |
|
| III | 16 | 5 | 11 |
|
| IV | 26 | 5 | 21 |
|
Immunohistochemistry (IHC)
For immunohistochemical analysis, endogenous
peroxidase activity was blocked using 3% H2O2
for 12 h. Non-specific binding was blocked with mice serum (catalog
no. SA1020, Wuhan Boster Biological Technology, Ltd) for 2 h at
room temperature. Subsequently, the slides were incubated with GLS1
antibody (dilution 1:200, catalog no. ab93434, Abcam) in PBS at 4°C
overnight in a humidified container. Biotinylated goat anti-rabbit
immunoglobulin G (1:400; Sigma-Aldrich; Merck KGaA) was incubated
with the sections for 1 h at room temperature. Brown color,
indicative of peroxidase activity, was developed by incubating with
0.1% 3,3-diaminobenzidine (Sigma-Aldrich; Merck KGaA) in PBS with
0.05% H2O2 for 5 min at room temperature. The
appropriate positive and negative controls were included in each
IHC run. Immunohistochemistry was scored as following by 3
investigators: Negative, 1; minimal, 2; moderate, 3, strong, 4; or
maximal, 5. Tumors with weak, moderate or strong immunostaining
intensity were classified as staining positive (+), whereas tumors
with no immunostaining were classified as staining negative
(−).
Statistical analysis
Statistical analysis was completed using SPSS
software (version 19.0; IBM SPSS, Armonk, NY, USA). All data are
presented as the mean ± standard deviation of triplicate values
from 3 separate experiments. P<0.05 was considered to indicate a
statistically significant difference. Independent Student's t-test
or Student-Newman-Keuls test after one-way analysis of variance was
used to compare the continuous variables between the two groups or
more than two groups. For clinical sample analysis, Fisher's exact
test or Kruskal-Wallis test was used to determine the sex,
differentiation status and TNM stage, respectively.
Results
Glutamine is critical for CRC
survival
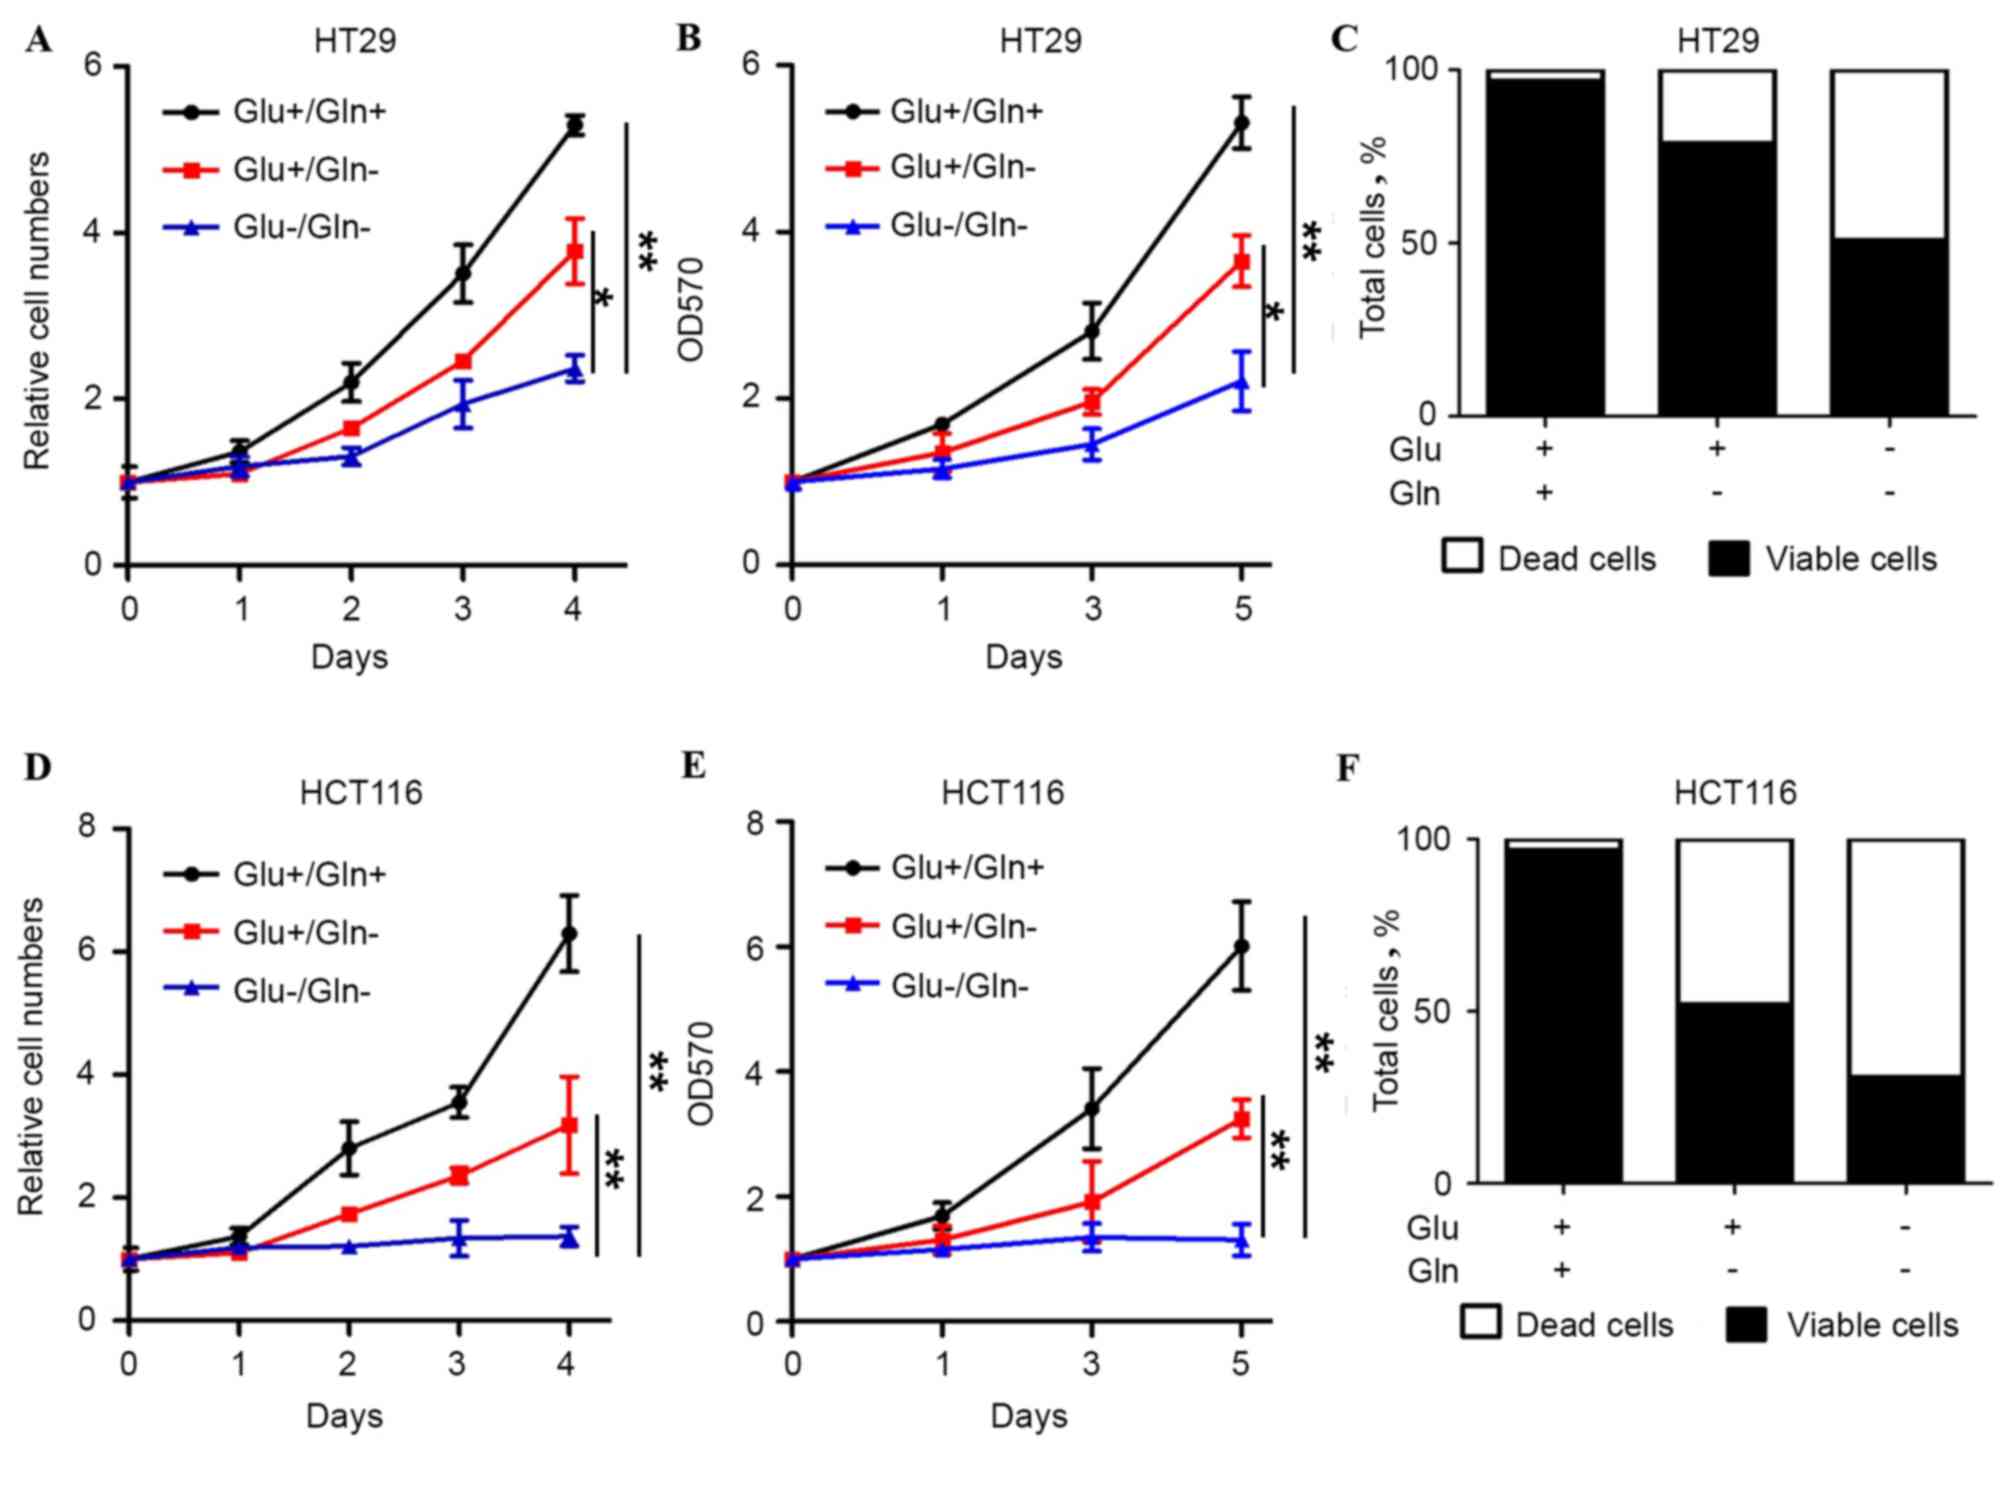
To determine how glutamine is necessary for the
proliferation and survival of colon cancer cells, cell behavior in
HT29 and HCT116 cells under different nutrient conditions was
determined. The two cell lines exhibited proliferation in the
presence of glucose and glutamine, whereas the cells did not grow
in the absence of glucose and glutamine, indicating that the two
nutrients are necessary for colon cancer cell survival (Fig. 1). In the glutamine withdrawal group,
the growth and viability of HT29 and HCT116 cells was also
significantly decreased. Similar results were also observed with
the guava assay. Glutamine withdrawal caused increased cell death
compared with the presence of glucose and glutamine (Fig. 1C and F). Therefore, it was speculated
that glutamine, which is an important energy source, is critical
for cell growth and the prevention of cell death in colon
cancer.
GLS1 sustains CRC cell growth in vitro
and in vivo
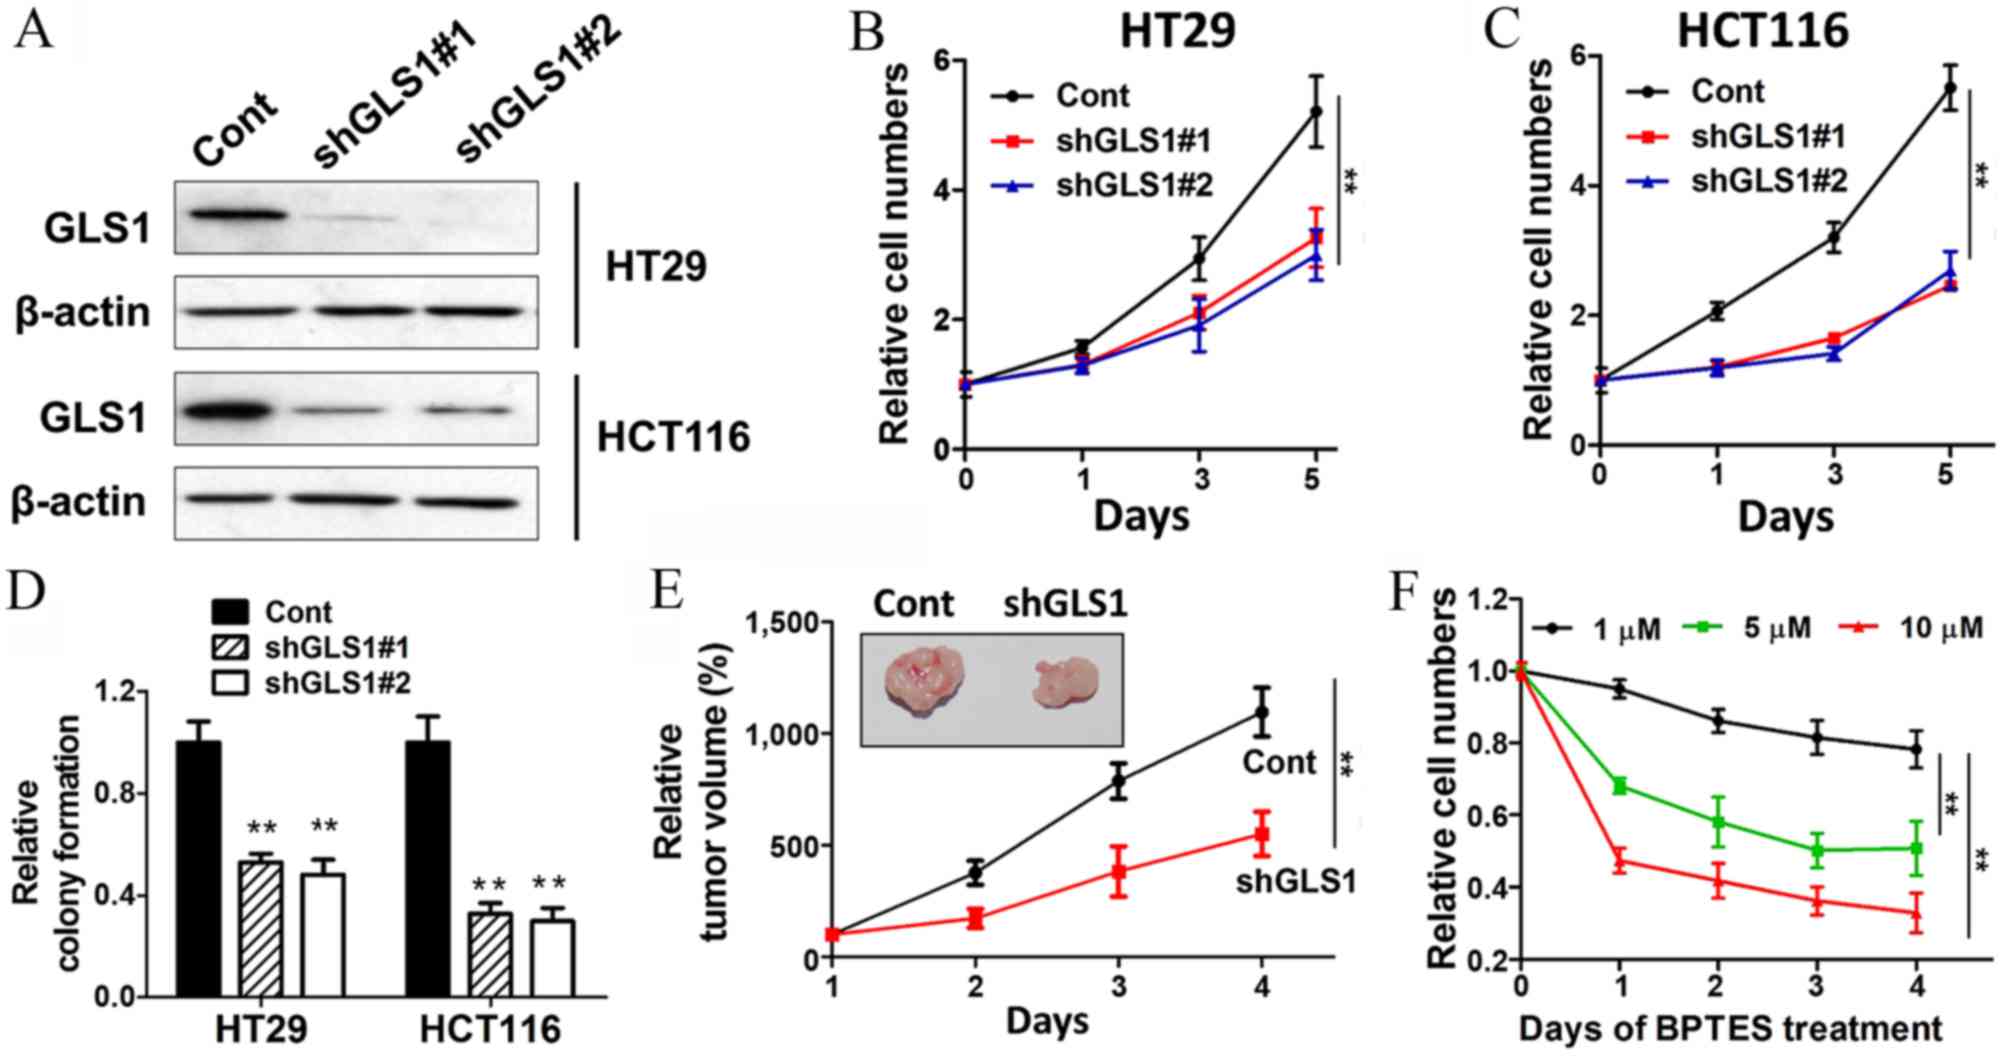
Due to the key function of GLS1, which converts
glutamine into glutamate, it was proposed that GSL1 may be an
important factor for the survival of colon cancer. GLS1 was knocked
down with two shRNAs, and the two shRNAs showed significant
repression of GLS1 expression (Fig.
2A). The cell growth abilities were markedly decreased with
GLS1 shRNA transfection (Fig. 2B and
C). GLS1 knockdown also inhibited colony formation in HT29 and
HCT116 cells (Fig. 2D). To determine
whether knockdown of GLS1 can block the cell growth in vivo,
HT29 cells transfected with either control or GLS1 shRNA were
injected into nude mice and allowed to grow for 4 weeks. The
results showed that GLS1 shRNA markedly diminished the capacities
of cell growth and tumor formation (Fig.
2E). Furthermore, BPTES (a GLS1 inhibitor) was used as a tool
to complement the GLS1 knockdown approach in the present study.
Consistent with the aforementioned results, BPTES blocked the
growth of colon cancer cells in a dose-dependent manner (Fig. 2F). These results demonstrated that the
pleiotropic role of glutamine in tumor growth is dependent on GLS1
activity and glutaminolysis.
GLS1 dictates glycolysis via
glutaminolysis
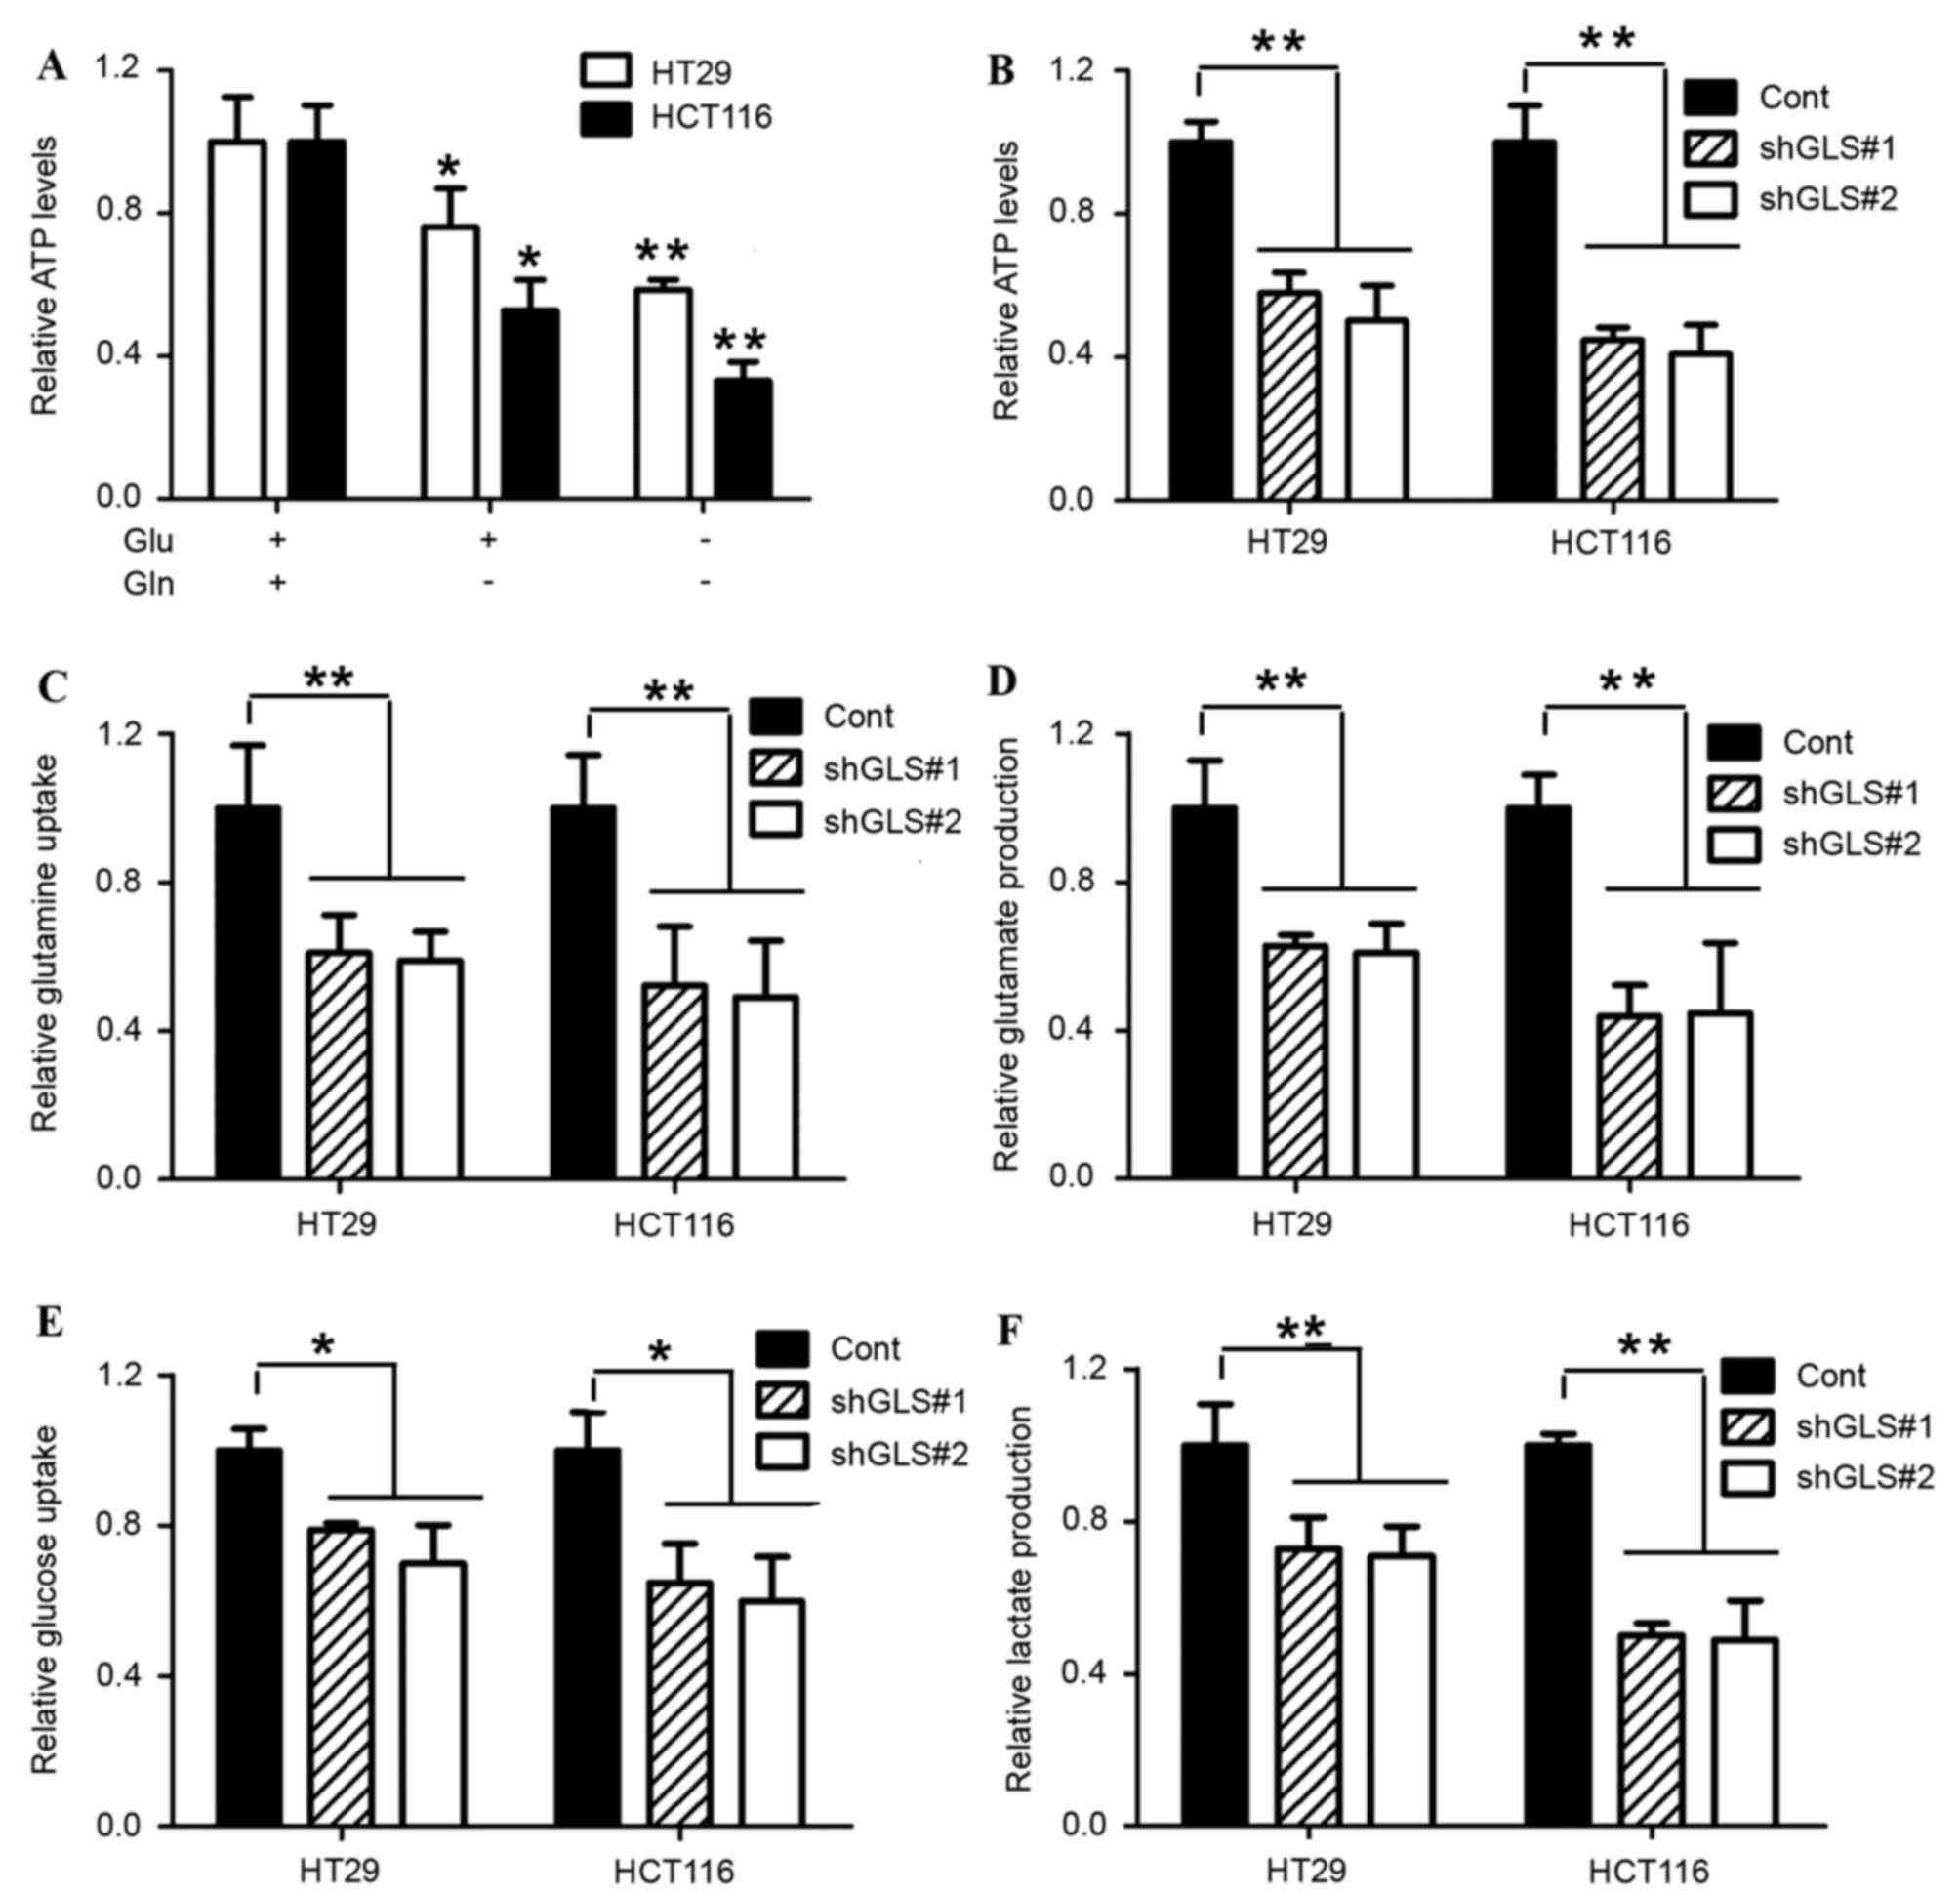
In the majority of proliferating cells, the internal
ATP production is predominantly supported by glucose and glutamine.
In the present study, it was speculated that the inhibition of
colon cancer cell growth with glutamine withdrawal was attributed
to the loss of internal ATP production. Therefore, ATP levels were
determined with or without glutamine treatment, and it was found
that the glutamine withdrawal markedly decreased the internal ATP
levels in HT29 and HCT116 cells (Fig.
3A). The reduction of GLS1 by shRNA markedly diminished the
cell growth and internal ATP levels (Fig.
3B). Glutamine is converted by GLS1 into glutamate for either
glutathione biosynthesis or catabolism by the tricarboxylic acid
(TCA) cycle. To evaluate GLS1 oxidative glutamine metabolism,
glutamine consumption and glutamate production were analyzed in
HT29 and HCT116 cells. As expected, GLS1 depletion significantly
suppressed glutamine consumption and subsequent glutamate
production (Fig. 3C and D).
A previous study reported that the inhibition of
glucose uptake by glutamine was observed in prostate and pancreatic
cancer cells (12,22). Therefore, the present study
investigated whether this regulatory mechanism is widespread, and
is also observed in colon cancer. HT29 and HCT116 cells were
transfected with GLS1 shRNA. The GLS1 knockdown markedly decreased
cell glucose uptake (Fig. 3E). In
addition, the inhibition of GLS1 also blocked lactate production.
Thus, in addition to the regulation of glutaminolysis, GLS1 also
performs a role in the regulation of the glucose uptake and
glycolysis process. It was proposed that GLS1 controls the
coordination between glutamine and glucose, and restricts cell
survival as a metabolic checkpoint in colon cancer.
GLS1 expression is increased in CRC
tissues and associated with clinicopathological factors
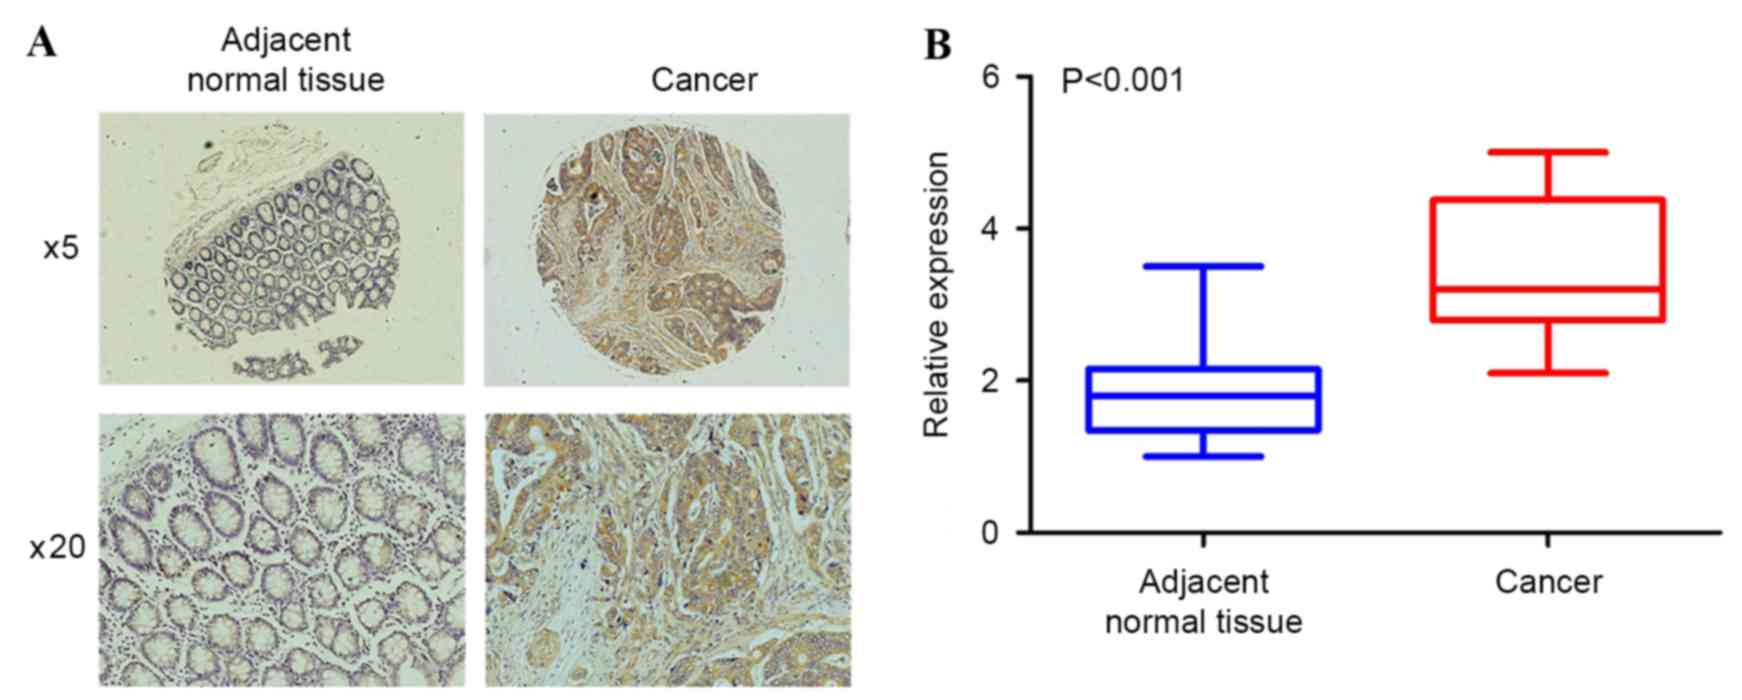
To evaluate the clinical significance of GLS1 in
colorectal cancer, the present study examined GLS1 expression in 50
pairs of human colorectal tumors and adjacent normal colon samples
with immunohistochemical analysis. As shown in Fig. 4A, the adjacent normal colon tissues
did not exhibit significant positive staining for GLS1. By
contrast, the expression level of GLS1 was upregulated in the
colorectal tumor samples. Statistical analysis revealed that the
average fold change of GLS1 expression in colorectal cancer was
markedly increased compared with the adjacent normal colon tissues
(1.85 vs. 3.53; P<0.001; unpaired Student's t-test; Fig. 4B). To determine the clinical
significance of elevated GLS1 expression in patients with CRC, the
association between GLS1 protein expression and clinicopathological
factors was examined, including sex, age, differentiation status
and TNM stage in patients with CRC. The results showed that GLS1
expression was negatively associated with differentiation status,
and positively associated with TNM stage (Table I). Therefore, an increase in the
percentages and levels of GLS1 positive expression indicated a low
differentiation status and an increase in TNM stage in patients
with CRC.
Discussion
Cancer cell metabolism is reprogrammed compared with
normal tissue, which results in tumor formation and progression. In
addition to elevated aerobic glycolysis, cancer cells exhibit
increased dependence on glutamine for growth (23). Since a variety of energy sources enter
the TCA cycle in a variety of ways, the restriction of each
nutrient may have different effects on cell growth. In rapidly
growing cells, glucose-derived citrate is preferentially involved
in the synthesis of fatty acids required for cell growth. The
importance of glutaminolysis in maintaining the malignant phenotype
has also been stressed (15). Thus,
glutaminolysis is critical to compensate for the reduced TCA
intermediates (3). Targeting glucose
metabolism alone may not be sufficient for cancer therapy.
GLS1 performs a critical role in catalyzing
glutaminolysis, and connects with a wide variety of distinct
biological processes through the conversion of glutamine into
glutamate (9). The expression of GLS1
is often upregulated in tumors and rapidly dividing cells (15). Although the underlying mechanism of
the elevated GLS1 expression by a number of oncogenes has been
reported, the way that GLS1 regulates cell metabolism and growth in
CRCs is largely unknown. In the present study, an important role
for GLS1 in coupling glutaminolysis of the TCA cycle with elevated
aerobic glycolysis in CRCs was defined, which consequently
represses the internal ATP levels and cell survival.
The present study firstly demonstrated that HT29 and
HCT116 cells have increased sensitivity to the deprivation of
glutamine compared with the addition of glucose and glutamine,
indicating the glutamine addiction phenotype, which may be
considered as a target of interest for therapy. Recently, a study
reported that, regarding the heterogeneous genetic and metabolic
baseline between HCT116 cells and HT29 cells, HCT116, in contrast
to HT29, depends on glutamine metabolism, as compound 968 exhibited
increased toxicity in this cell line (24). Accordingly, HCT116 was also observed
to be more sensitive to glutamine withdrawal compared with HT29
cells, although the two cell lines require glutamine for survival.
In addition, GLS1 was knocked down with shRNA in the two cell
lines. The repression of GLS1 decreased cell growth and colony
formation in vitro and inhibited the xenograft formation in
nude mice. Therefore, glutamine and GLS1 are critical for CRC cell
growth and survival.
The coordination of glucose and glutamine as
abundant nutrients is required for cell growth, which feeds into
multiple pathways. Several studies have provided evidence that
glutamine dependent anapleurosis functions upstream of glucose
uptake and utilization, and glutaminolysis is required for the
uptake of glucose (12,22). It was also observed that the
repression of GLS1 decreased glucose uptake of CRC cells. In
addition, since the majority of the glucose is secreted as lactate
in actively growing cells, lactate production was revealed to
decrease as GLS1 was inhibited. Therefore, it was hypothesized that
GLS1-mediated glutaminolysis may also induce cell aerobic
glycolysis in addition to the induction of glucose uptake via
glucose transport. In addition, the synthesis of lactate generates
ATP required to maintain intracellular bioenergetics. GLS1
reduction led to a significant reduction of internal ATP levels,
thus inhibiting cell growth and progression. Therefore, it was
speculated that GLS1 controls the coordination between glutamine
and glucose, and restricts cell survival as a metabolic
checkpoint.
To evaluate the clinical significance of GLS1 in
colorectal cancer, GLS1 expression was examined in 50 pairs of
human colorectal tumors and adjacent normal colon samples with IHC
analysis. The expression level of GLS1 was upregulated in the
colorectal tumor samples, indicating a large scale of CRC exerts
aerobic glycolysis and glutamine addiction phenotype. Furthermore,
GLS1 expression is negatively associated with differentiation
status and positively associated with TNM stage. Thus, the high
expression of GLS1 indicated the malignant CRC phenotype in
patients, and GLS1 may also dictate the poor differentiation of
CRCs. Currently, the GLS1 CB-839 inhibitor is undergoing clinical
trials in certain types of cancer, including triple-negative breast
cancer and non-small cell lung cancer (13). Consistent with this, in the present
study, administration of BPTES (another GLS1 inhibitor)
significantly decreased tumor cell growth. Therefore, the present
study extends the application of drugs targeting GLS1, indicating
the promising role of GLS1 in CRC treatment.
Acknowledgements
The present study was supported by the National
Natural Science Foundation of China (grant no. 81172368), the Wu
Jieping Medical Foundation (grant no. 320.6700.1203) and the
Science and Technology Innovation Nursery Foundation of Chinese
People's Liberation Army General Hospital (grant no. 14KMM30).
Glossary
Abbreviations
Abbreviations:
|
CRC
|
colorectal cancer
|
|
GLS
|
glutaminase
|
|
BPTES
|
bis-2-(5-phenylacetamido-1,2,4-thiadiazol-2-yl)ethyl sulfide
|
|
TNM
|
tumor-node-metastasis
|
References
|
1
|
Siegel R, Desantis C and Jemal A:
Colorectal cancer statistics, 2014. CA Cancer J Clin. 64:104–117.
2014. View Article : Google Scholar : PubMed/NCBI
|
|
2
|
DeBerardinis RJ, Lum JJ, Hatzivassiliou G
and Thompson CB: The biology of cancer: Metabolic reprogramming
fuels cell growth and proliferation. Cell Metab. 7:11–20. 2008.
View Article : Google Scholar : PubMed/NCBI
|
|
3
|
Dang CV: Links between metabolism and
cancer. Genes Dev. 26:877–890. 2012. View Article : Google Scholar : PubMed/NCBI
|
|
4
|
Vander Heiden MG, Cantley LC and Thompson
CB: Understanding the Warburg effect: The metabolic requirements of
cell proliferation. Science. 324:1029–1033. 2009. View Article : Google Scholar : PubMed/NCBI
|
|
5
|
Cairns RA, Harris IS and Mak TW:
Regulation of cancer cell metabolism. Nat Rev Cancer. 11:85–95.
2011. View
Article : Google Scholar : PubMed/NCBI
|
|
6
|
Wise DR and Thompson CB: Glutamine
addiction: A new therapeutic target in cancer. Trends Biochem Sci.
35:427–433. 2010. View Article : Google Scholar : PubMed/NCBI
|
|
7
|
Daye D and Wellen KE: Metabolic
reprogramming in cancer: Unraveling the role of glutamine in
tumorigenesis. Semin Cell Dev Biol. 23:362–369. 2012. View Article : Google Scholar : PubMed/NCBI
|
|
8
|
Hensley CT, Wasti AT and DeBerardinis RJ:
Glutamine and cancer: Cell biology, physiology, and clinical
opportunities. J Clin Invest. 123:3678–3684. 2013. View Article : Google Scholar : PubMed/NCBI
|
|
9
|
Curthoys NP and Watford M: Regulation of
glutaminase activity and glutamine metabolism. Annu Rev Nutr.
15:133–159. 1995. View Article : Google Scholar : PubMed/NCBI
|
|
10
|
Mates JM, Segura JA, Martín-Rufian M,
Campos-Sandoval JA, Alonso FJ and Márquez J: Glutaminase isoenzymes
as key regulators in metabolic and oxidative stress against cancer.
Curr Mol Med. 13:514–534. 2013. View Article : Google Scholar : PubMed/NCBI
|
|
11
|
Huang F, Zhang Q, Ma H, Lv Q and Zhang T:
Expression of glutaminase is upregulated in colorectal cancer and
of clinical significance. Int J Clin Exp Pathol. 7:1093–1100.
2014.PubMed/NCBI
|
|
12
|
Pan T, Gao L, Wu G, Shen G, Xie S, Wen H,
Yang J, Zhou Y, Tu Z and Qian W: Elevated expression of glutaminase
confers glucose utilization via glutaminolysis in prostate cancer.
Biochem Biophys Res Commun. 456:452–458. 2015. View Article : Google Scholar : PubMed/NCBI
|
|
13
|
Gross MI, Demo SD, Dennison JB, Chen L,
Chernov-Rogan T, Goyal B, Janes JR, Laidig GJ, Lewis ER, Li J, et
al: Antitumor activity of the glutaminase inhibitor CB-839 in
triple-negative breast cancer. Mol Cancer Ther. 13:890–901. 2014.
View Article : Google Scholar : PubMed/NCBI
|
|
14
|
Kaadige MR, Elgort MG and Ayer DE:
Coordination of glucose and glutamine utilization by an expanded
Myc network. Transcription. 1:36–40. 2010. View Article : Google Scholar : PubMed/NCBI
|
|
15
|
Gao P, Tchernyshyov I, Chang TC, Lee YS,
Kita K, Ochi T, Zeller KI, De Marzo AM, Van Eyk JE, Mendell JT and
Dang CV: c-Myc suppression of miR-23a/b enhances mitochondrial
glutaminase expression and glutamine metabolism. Nature.
458:762–765. 2009. View Article : Google Scholar : PubMed/NCBI
|
|
16
|
Tanaka K, Sasayama T, Irino Y, Takata K,
Nagashima H, Satoh N, Kyotani K, Mizowaki T, Imahori T, Ejima Y, et
al: Compensatory glutamine metabolism promotes glioblastoma
resistance to mTOR inhibitor treatment. J Clin Invest.
125:1591–1602. 2015. View
Article : Google Scholar : PubMed/NCBI
|
|
17
|
Carr EL, Kelman A, Wu GS, Gopaul R,
Senkevitch E, Aghvanyan A, Turay AM and Frauwirth KA: Glutamine
uptake and metabolism are coordinately regulated by ERK/MAPK during
T lymphocyte activation. J Immunol. 185:1037–1044. 2010. View Article : Google Scholar : PubMed/NCBI
|
|
18
|
Robinson MM, McBryant SJ, Tsukamoto T,
Rojas C, Ferraris DV, Hamilton SK, Hansen JC and Curthoys NP: Novel
mechanism of inhibition of rat kidney-type glutaminase by
bis-2-(5-phenylacetamido-1,2,4-thiadiazol-2-yl)ethyl sulfide
(BPTES). Biochem J. 406:407–414. 2007. View Article : Google Scholar : PubMed/NCBI
|
|
19
|
Stalnecker CA, Ulrich SM, Li Y,
Ramachandran S, McBrayer MK, DeBerardinis RJ, Cerione RA and
Erickson JW: Mechanism by which a recently discovered allosteric
inhibitor blocks glutamine metabolism in transformed cells. Proc
Natl Acad Sci USA. 112:394–399. 2015. View Article : Google Scholar : PubMed/NCBI
|
|
20
|
Williams DM, Schachter J, Drutz DJ and
Sumaya CV: Pneumonia due to Chlamydia trachomatis in the
immunocompromised (nude) mouse. J Infect Dis. 143:238–241. 1981.
View Article : Google Scholar : PubMed/NCBI
|
|
21
|
Chu D, Zhang Z, Li Y, Wu L and Zhang J,
Wang W and Zhang J: Prediction of colorectal cancer relapse and
prognosis by tissue mRNA levels of NDRG2. Mol Cancer Ther.
10:47–56. 2011. View Article : Google Scholar : PubMed/NCBI
|
|
22
|
Kaadige MR, Looper RE, Kamalanaadhan S and
Ayer DE: Glutamine-dependent anapleurosis dictates glucose uptake
and cell growth by regulating MondoA transcriptional activity. Proc
Natl Acad Sci USA. 106:14878–14883. 2009. View Article : Google Scholar : PubMed/NCBI
|
|
23
|
Tennant DA, Durán RV and Gottlieb E:
Targeting metabolic transformation for cancer therapy. Nat Rev
Cancer. 10:267–277. 2010. View
Article : Google Scholar : PubMed/NCBI
|
|
24
|
Richard SM and Martinez Marignac VL:
Sensitization to oxaliplatin in HCT116 and HT29 cell lines by
metformin and ribavirin and differences in response to
mitochondrial glutaminase inhibition. J Cancer Res Ther.
11:336–340. 2015. View Article : Google Scholar : PubMed/NCBI
|