Introduction
Renal cell carcinoma (RCC), the third most common
urological cancer, accounts for ~3% of all adult malignancies and
represents 90% of all kidney cancers (1,2). Estimated
cancer statistics in the USA revealed that RCC was among the top
ten cancer types in terms of its incidence and mortality rate, with
63,920 new cancer cases and 13,860 mortalities from kidney and
renal pelvis cancer estimated to occur in 2014 (3). For early and local RCC, surgical
resection remains the best curative therapy approach, while 20–30%
of patients develop local and/or distant disease recurrence
(4). For advanced RCC, surgical
resection has no curative effect and the disease is resistant to
standard chemotherapy and radiotherapy, with a five-year survival
rate of <10% for patients with metastatic RCC (5,6). Thus, it
is essential to understand the mechanisms of RCC tumorigenesis and
development, and to search for novel biomarkers to improve the
clinical outcomes of RCC.
MicroRNAs (miRNAs/miRs) are a class of non-coding
RNAs with a length of ~22 nucleotides (7,8). They
regulate gene expression post-transcriptionally by imperfectly
binding with the 3′-untranslated region (3′UTR) of targeted
messenger RNAs (mRNAs) to suppress translation or induce mRNA
degradation (7). miRNAs regulate
various cellular processes including cell differentiation,
proliferation, metabolism and apoptosis (1). Investigations of miRNAs have provided a
new direction in our understanding of the mechanisms of
tumorigenesis of RCC. A number of miRNAs have been observed to be
deregulated in RCC, including miR-206 (9), miR-30c (10) and miR-29b (11). Previous studies of microarrays
indicated that miR-514a-3p (previously known as miR-514) was
downregulated in RCC (12,13), although the expression of miR-514a-3p
has not been verified in RCC tissues by quantitative polymerase
chain reaction (qPCR). In the present study, the expression of
miR-514a-3p in RCC and adjacent normal tissues was explored and the
function of miR-514a-3p in RCC cell lines was assessed.
Materials and methods
Sample collection
A total of 30 paired tissues (RCC and adjacent
normal tissues) were collected from Peking University Shenzhen
Hospital (Guangdong, China). The adjacent normal tissues were
extracted at 2 cm away from visible RCC lesions. Written informed
consent was obtained from all patients. The collection and usage of
the samples was reviewed and approved by the Ethics Committees of
Peking University Shenzhen Hospital. The tissues were immersed in
RNAlater for over 30 min (Qiagen, Hilden, Germany) after being
dissected, and then stored at −80°C. The tissues collected were
reviewed and classified by hematoxylin and eosin staining. The
clinical and pathological characteristics of the patients are
presented in Table I.
 | Table I.Clinicopathological features of renal
cell carcinoma patients. |
Table I.
Clinicopathological features of renal
cell carcinoma patients.
| Characteristics | Number of cases |
|---|
| Mean age (range)
(years) | 50 (25–70) |
| Sex |
|
|
Male/female | 19/11 |
| Histological
type |
|
| Clear
cell/papillary | 25/5 |
| pT stage |
|
| T1/T2/T3
+T4 | 18/8/4 |
| Fuhrman grade |
|
|
I/II/III+IV | 18/7/5 |
| AJCC clinical
stages |
|
|
I/II/III+IV | 17/8/5 |
Cell culture
Two RCC cell lines (786-O and ACHN; American Type
Culture Collection, Manassas, VA, USA) were used in this study.
Cells were cultured in a humidified incubator containing 5%
CO2 at a temperature of 37°C in Dulbecco's modified
Eagle's medium (DMEM; Gibco; Thermo Fisher Scientific, Inc.,
Waltham, MA, USA) with 10% fetal bovine serum (FBS; Gibco), 1%
antibiotics (100 µl/ml penicillin and 100 mg/ml streptomycin
sulfates; Gibco) and 1% glutamine (Gibco).
RNA extraction, cDNA synthesis and
qPCR
Total RNA was extracted from the samples and cells
by TRIzol reagent (Invitrogen; Thermo Fisher Scientific, Inc.) and
purified with the RNeasy maxi kit (Qiagen) according to the
manufacturer's protocol. The RNA concentration was measured using a
NanoDrop 2000/2000c (Thermo Fisher Scientific, Inc.). One microgram
of RNA from each sample was used to obtain cDNA by performing
reverse transcription PCR with a miScript reverse transcription kit
(Qiagen). Then qPCR was performed with a miScript SYBR-Green PCR
kit (Qiagen) on the Roche Lightcycler 480 real-time PCR system
(Roche Diagnostics, Basel, Switzerland). U6 was used as an internal
control and the sequences of the primers are shown in Table II. The thermocycling conditions were
as follows: 95°C for 1 min, then 40 cycles of 95°C for 10 sec, 55°C
for 30 sec and 70°C for 30 sec. The expression levels of
miR-514a-3p in tissues and cells were analyzed with the
2−ΔΔCq method.
| Table II.Sequences used in the study. |
Table II.
Sequences used in the study.
|
| Sequence |
|---|
| miR-514a-3p
mimic | Sense:
5′-AUUGACACUUCUGUGAGUAGA-3′ |
|
| Antisense:
5′-UACUCACAGAAGUGUCAAUUU-3′ |
| Negative
control | Sense:
5′-UUCUCCGAACGUGUCACGUTT-3′ |
|
| Antisense:
5′-ACGUGACACGUUCGGAGAATT-3′ |
| Inhibitor NC |
5′-CAGUACUUUUGUGUAGUACAA-3′ |
| U6 forward
primer |
5′-CTCGCTTCGGCAGCACA-3′ |
| U6 reverse
primer |
5′-ACGCTTCACGAATTTGCGT-3′ |
| miR-514a-3p forward
primer | 5′-
ATTGACACTTCTGTGAGTAGA-3′ |
| miR-514a-3p reverse
primer | Universal primer
(miScript SYBR-Green PCR kit) |
Cell transfection
Synthesized miR-514a-3p mimic (GenePharma, Suzhou,
China) or mimic negative control (NC) were transfected into cells
with Lipofectamine® 2000 (Invitrogen), which was mixed
in Opti-MEM® I reduced serum medium (Gibco) according to
the manufacturer's protocol. qPCR was performed to measure the
expression of miR-514a-3p in cells following transfection. The
sequences used in the study are shown in Table II.
Cell scratch assay
Cell scratch assay was performed to assess the cell
migratory ability of 786-O and ACHN cells. Approximately
3×10⁵ cells were seeded in each well of a six-well
plate. Twenty-four h later, the cells were transfected with
miR-514a-3p mimics or mimic NC. At 6 h after transfection the cell
monolayer was scratched with a sterile 1-ml pipette tip to generate
a line-shaped wound. To remove the floating cells every well was
rinsed with phosphate-buffered saline (PBS). Then the cells were
cultured in DMEM supplemented with 5% FBS. A digital camera system
was used to acquire images of the scratches at 0 and 24 h after
making the scratch. The experiments were performed in triplicate
and repeated three times.
Cell proliferation assay
3-(4,5-dimethylthiazol-2-yl)-2,
5-diphenyltetrazolium bromide (MTT) assay and CCK-8 assay were
performed to assess cell proliferative ability following
transfection. A total of 5,000 cells were seeded in each well of a
96-well plate and 12 h later the cells were transfected with
miR-514a-3p mimics or mimic NC. For the CCK-8 assay, 10 µl Cell
Counting Kit-8 (CCK-8, Beyotime Institute of Biotechnology,
Shanghai, China) was added into the wells for detection at 0, 24,
48 and 72 h after transfection, and 1 h later the optical density
(OD) of each well was measured using an ELISA microplate reader
(Bio-Rad Laboratories, Inc., Hercules, CA, USA) at a wavelength of
490 nm. For the MTT assay, 20 µl MTT (5 mg/ml; Sigma-Aldrich; Merck
KGaA, Darmstadt, Germany) was added into the wells for detection at
0, 24, 48 and 72 h after transfection, and 4 h later the mixed
medium was replaced by 150 µl dimethylsulfoxide (Sigma-Aldrich;
Merck KGaA). Next, the 96-well plate was agitated for 15 min at
room temperature. Then the OD of each well was measured by the
ELISA microplate reader at a wavelength of 490 nm. The experiments
were performed in sextuplicate and repeated at least three
times.
Transwell assay
Transwell assay was performed to assess the cell
migratory and invasive ability. In the assay, Transwell chamber
inserts (BD Biosciences, New York, NJ, USA) with (for migration) or
without Matrigel (BD; for invasion) were used following the
manufacturer's protocol. Transfected cells (1×10⁴) in
200 µl DMEM were seeded in the upper channel of the inserts. Cells
were allowed to migrate for 36 h and invade for 48 h. The cells
that migrated or invaded to the bottom of the inserts were stained
with crystal violet for 25 min and then washed with PBS 3 times.
The cells would be counted using a microscope. The experiments were
performed in triplicate and repeated at least three times.
Hoechst 33342 staining assay
Approximately 3×10⁵ cells were seeded in
each well of a six-well plate, and 12 h later the cells were
transfected with miR-514a-3p mimics or mimic NC. After 48 h the
cells were stained with Hoechst 33342 (5 µg/ml; Thermo Fisher
Scientific, Inc.) for 20 min. Images of the cells were acquired
with an immunofluorescent inverted fluorescence microscope (Leica
DM IRB, Wetzlar, Germany) after washing twice in PBS.
Flow cytometry assay
The apoptotic rates of cells were measured by
performing flow cytometry assay with an Alexa Fluor® 488
Αnnexin V/dead cell apoptosis kit (Invitrogen). Approximately
3×10⁵ cells were seeded in each well of a six-well plate
and 12 h later the cells were transfected with miR-514a-3p mimics
or mimic NC. At 48 h after transfection all cells were harvested
and stained according to the manufacturer's protocol. After 15 min
of staining, 400 µl binding buffer (provided with the apoptosis
kit) was added to each tube. Then flow cytometry (EPICS XL-4;
Beckman Coulter, Inc., Brea, CA, USA) was used to analyze the
apoptosis rate. The experiments were performed in triplicate and
repeated at least three times.
Statistical analysis
A paired t-test was used to compare the expression
levels of miR-514a-3p in matched tumor/normal tissues and cells.
Student's t-test was used to analyze assays for characterizing
phenotypes of cells. All statistical analyses were carried out
using the SPSS 19.0 statistical software package (IBM SPSS, Armonk,
NY, USA). The results in all figures are shown as the means ±
standard error. P<0.05 was considered to indicate a
statistically significant difference.
Results
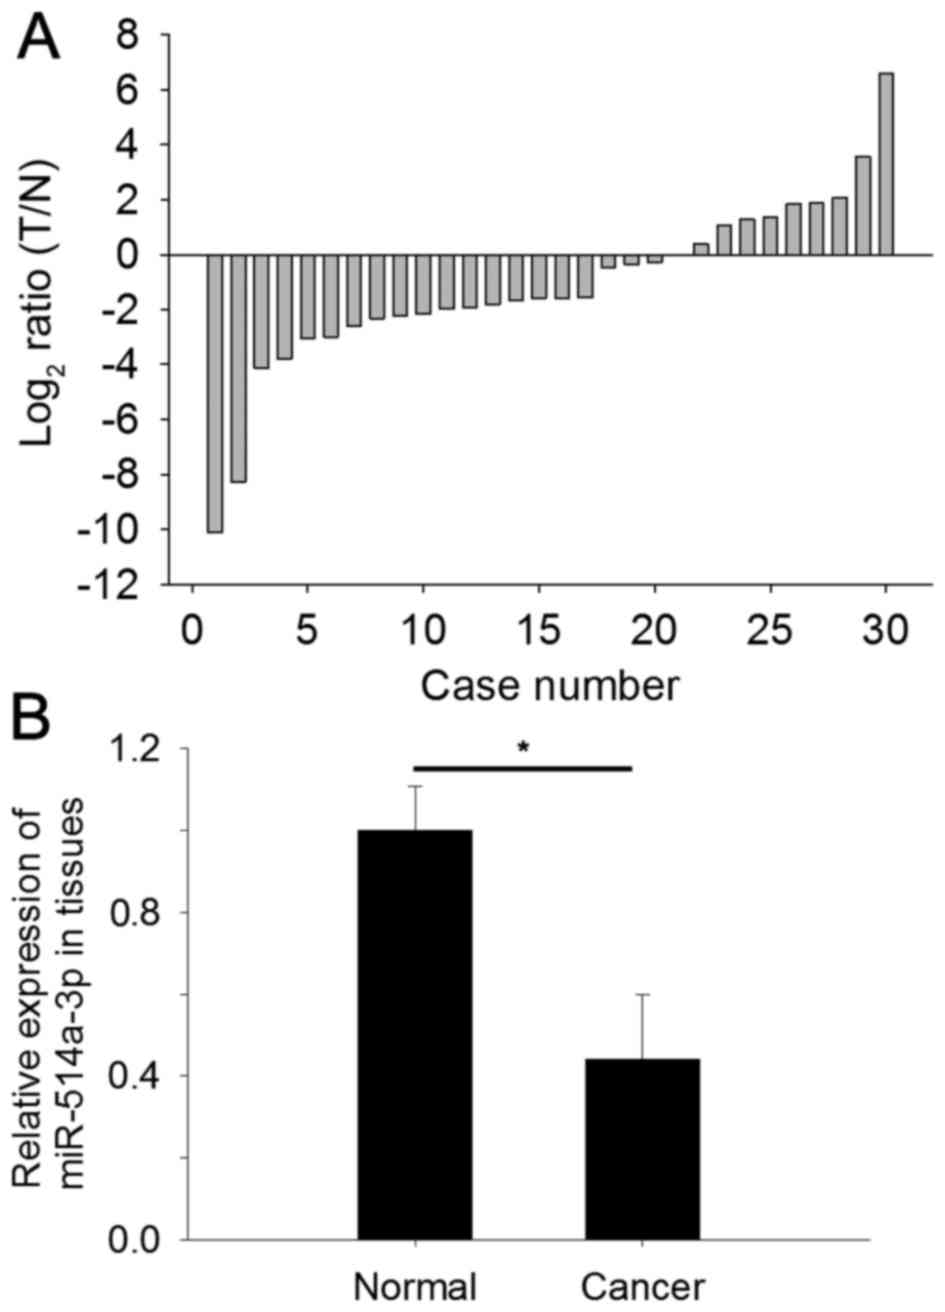
miR-514a-3p is downregulated in RCC
tissues
To determine the expression level of miR-514a-3p,
qPCR was performed in 30 paired RCC tissues and adjacent normal
tissues. The relative expression of miR-514a-3p [log2 (T/N), where
T represents RCC tissues and N represents normal tissues] in
tissues is shown in Fig. 1A. The
relative expression of miR-514a-3p in RCC (0.44±0.16) was
significantly lower compared with adjacent normal tissues, as shown
in Fig. 1B (P<0.05).
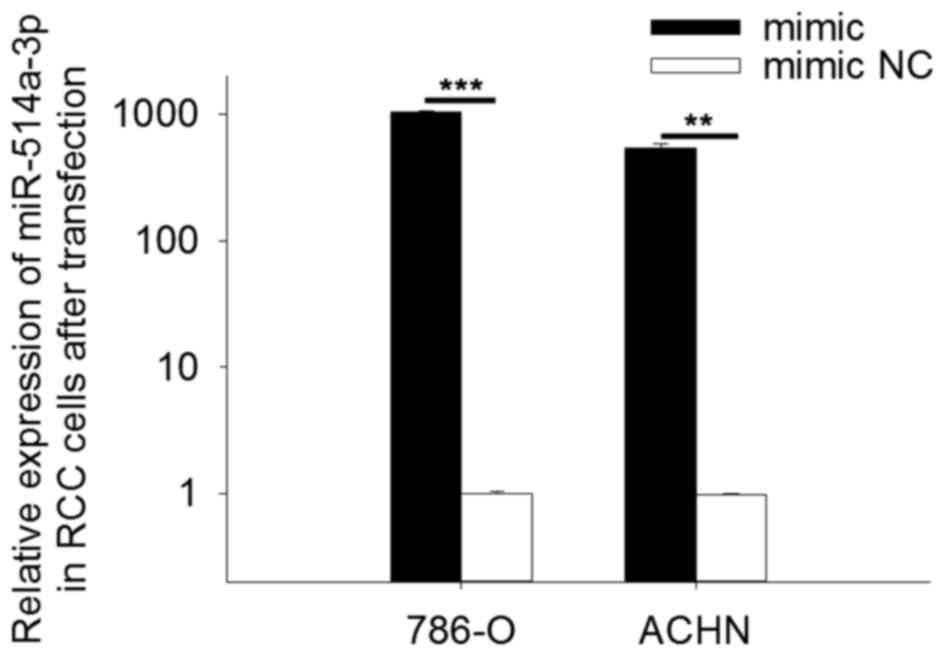
Validation of expression of
miR-514a-3p following transfection
To determine the expression level of miR-514a-3p
following transfection, qPCR was performed. The results revealed
that in cells transfected with miR-514a-3p mimics the expression of
miR-514a-3p was 1043.84 times higher (786-O cells, P<0.001) and
541.09 times higher (ACHN cells, P<0.01) than in cells
transfected with mimic NC. The results are shown in Fig. 2.
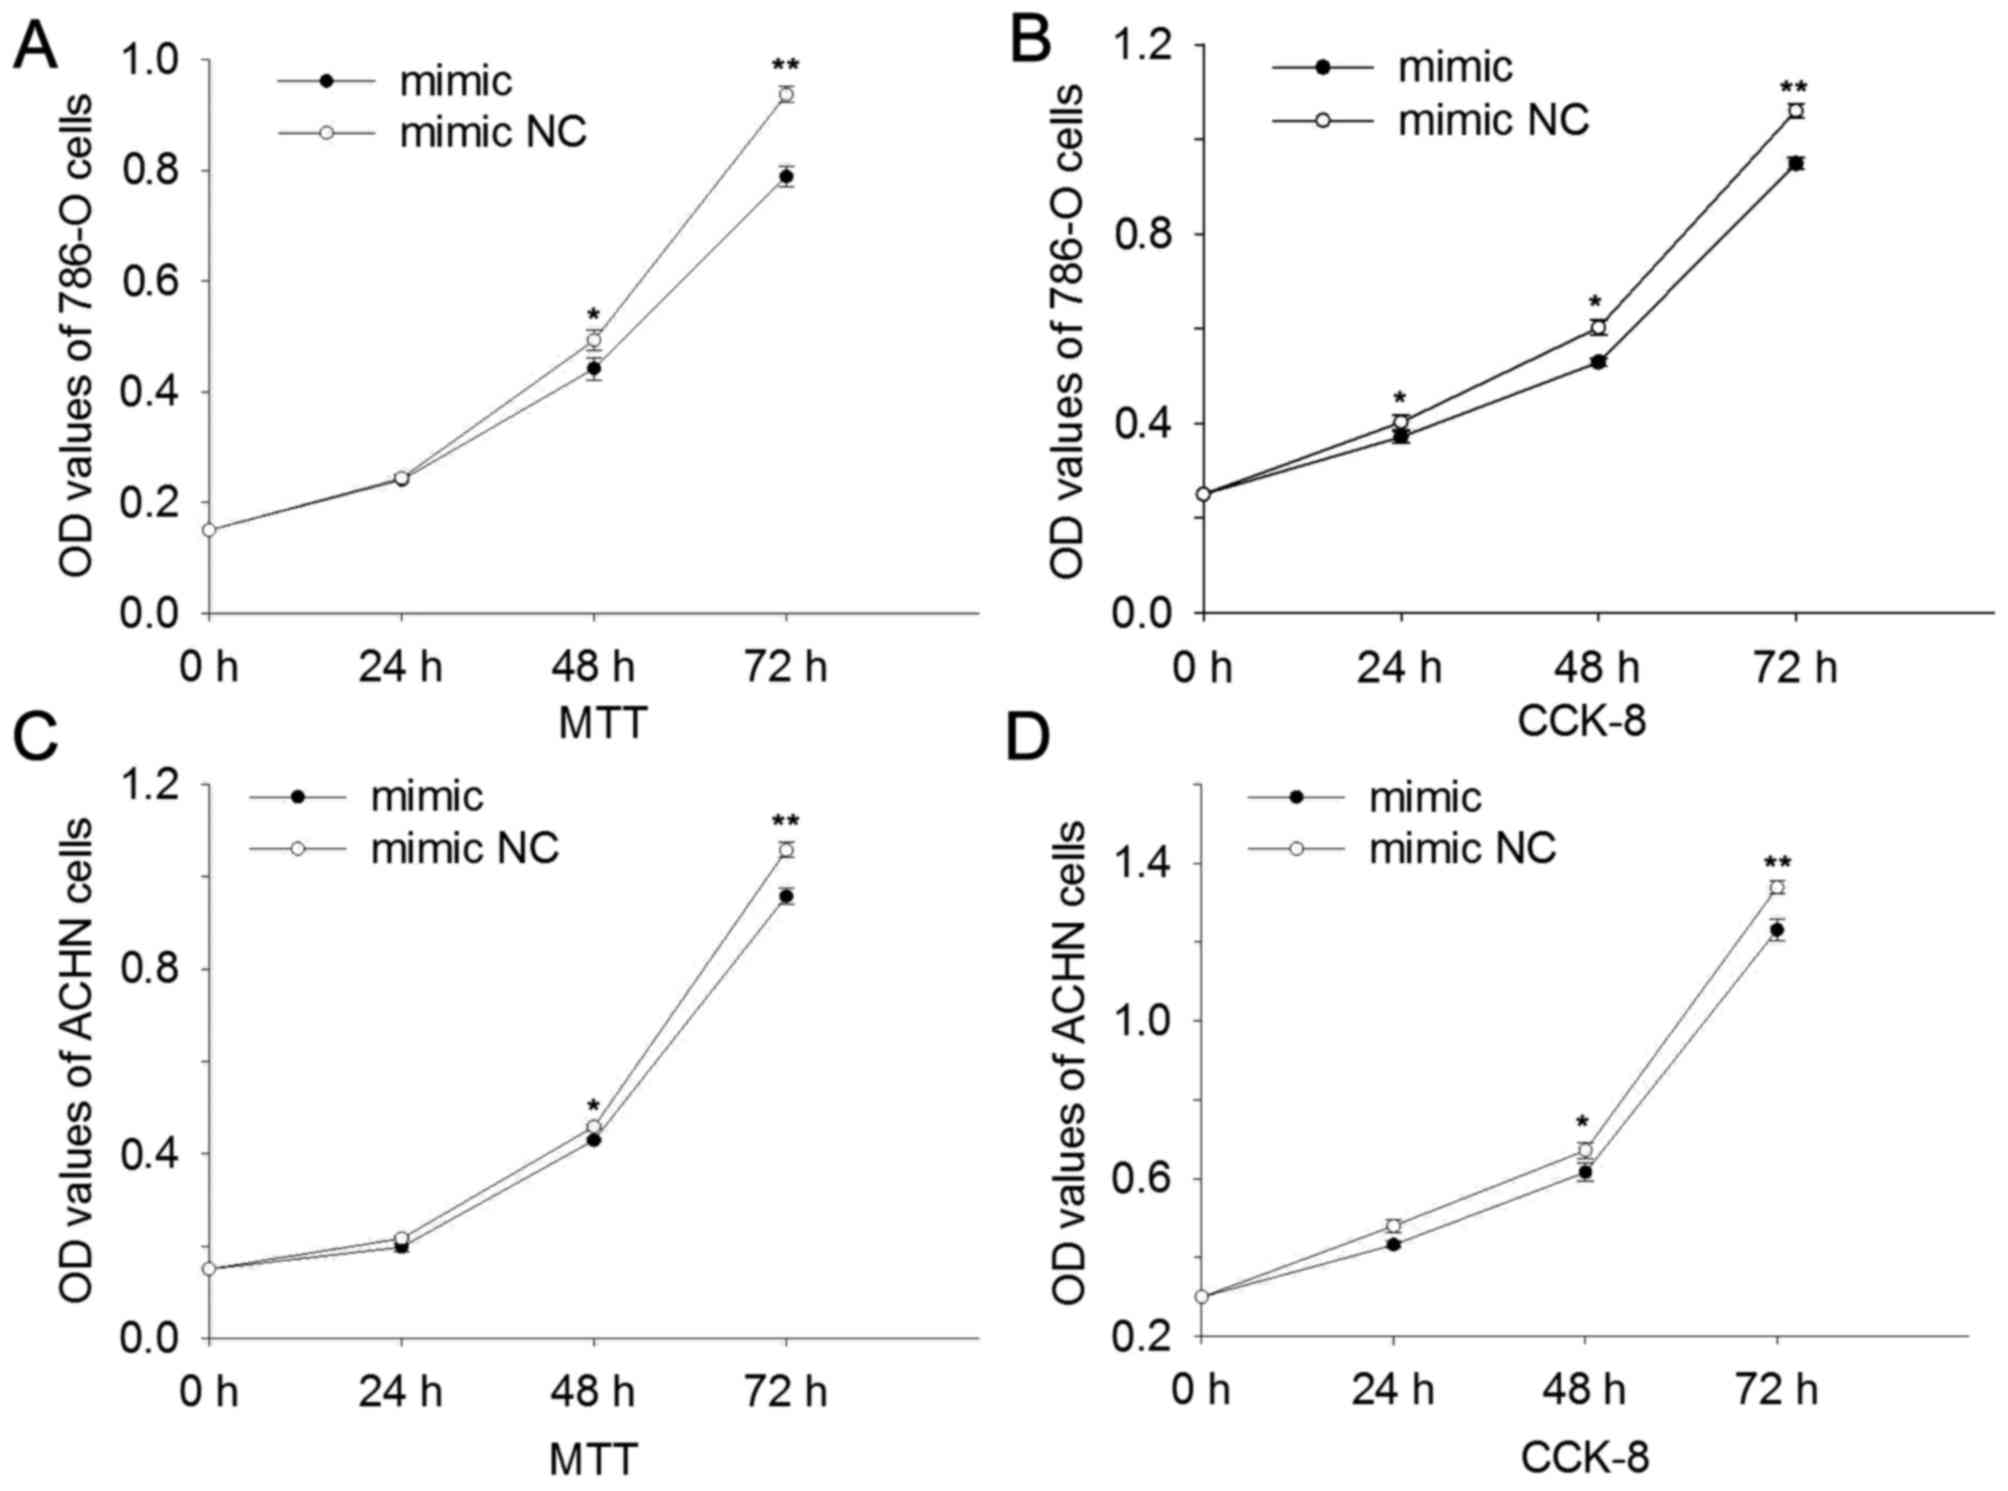
miR-514a-3p suppresses cell
proliferation
MTT and CCK-8 assays were performed, and the results
suggested that upregulation of miR-514a-3p suppressed cell
proliferation. In 786-O cells the results revealed that at 24, 48
and 72 h the cell proliferation was reduced by 1.37, 10.40
(P<0.05) and 15.78% (P<0.01) (MTT assay, Fig. 3A) and 7.68 (P<0.05), 12.17
(P<0.05) and 10.50% (P<0.01) (CCK-8 assay, Fig. 3B) compared with cells transfected with
mimic NC. In ACHN cells the results revealed that at 24, 48 and 72
h the cell proliferation was reduced by 8.68, 6.46 (P<0.05) and
9.50% (P<0.01) (MTT assay, Fig.
3C) and 9.92, 8.24 (P<0.05) and 8.02% (P<0.01) (CCK-8
assay, Fig. 3D). The results revealed
that miR-514a-3p suppressed cell proliferation in RCC.
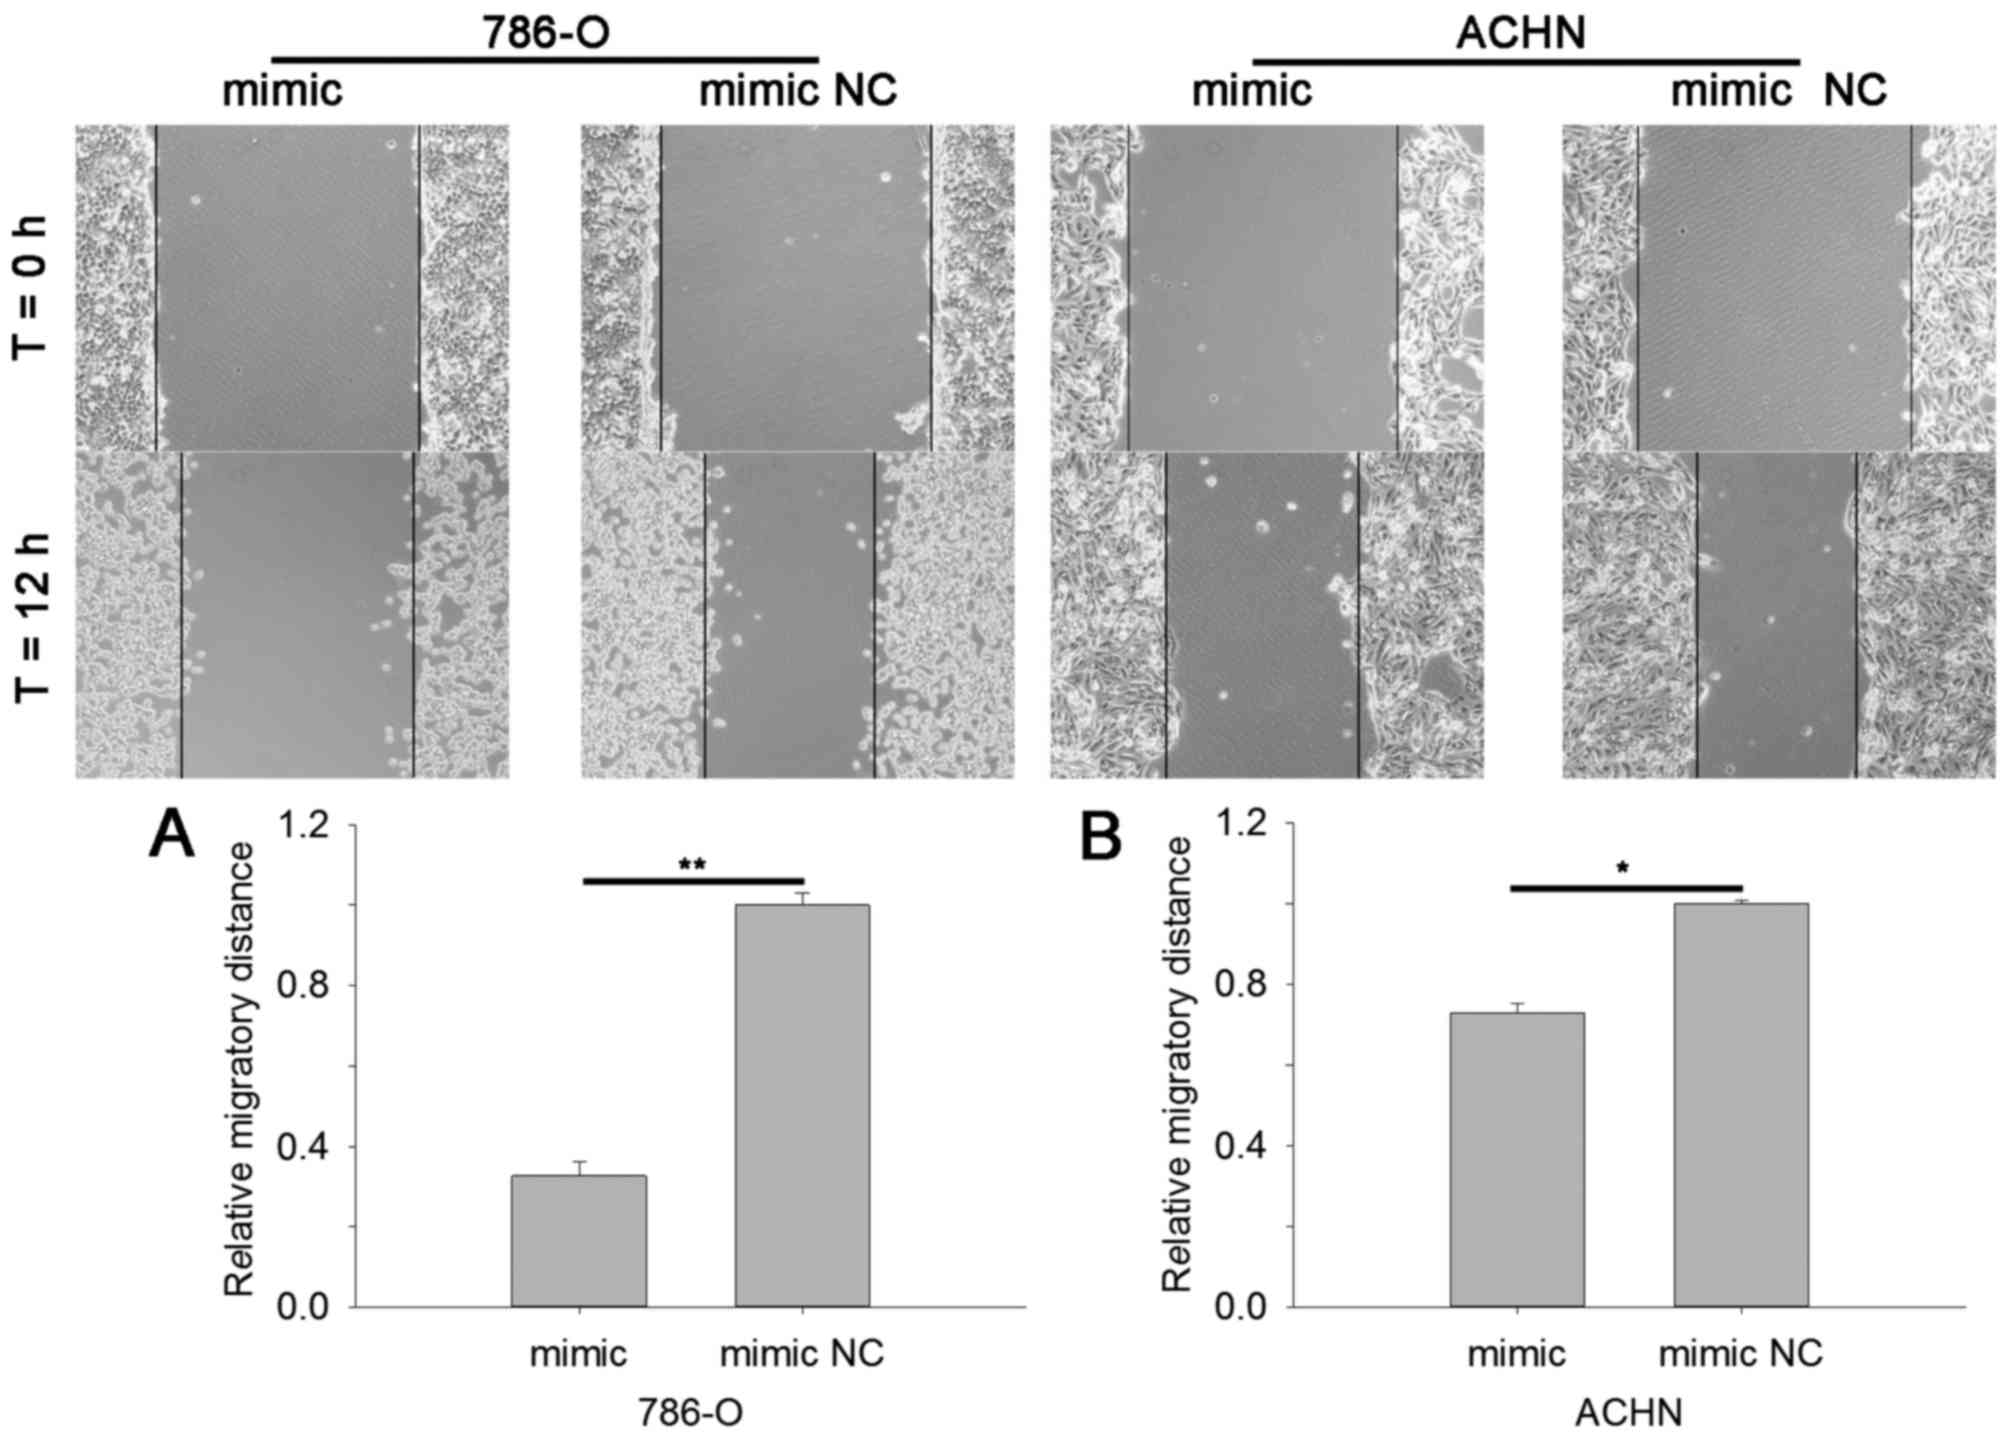
miR-514a-3p suppresses RCC cell
mobility
Cell scratch assay and Transwell assay were
performed to assess cell mobility. The results of cell scratch
assay revealed that in cells transfected with miR-514a-3p mimics
the migratory distance was reduced by 67.29% (786-O, P<0.01) and
27.26% (ACHN, P<0.05) compared with cells transfected with mimic
NC, as shown in Fig. 4A and B. The
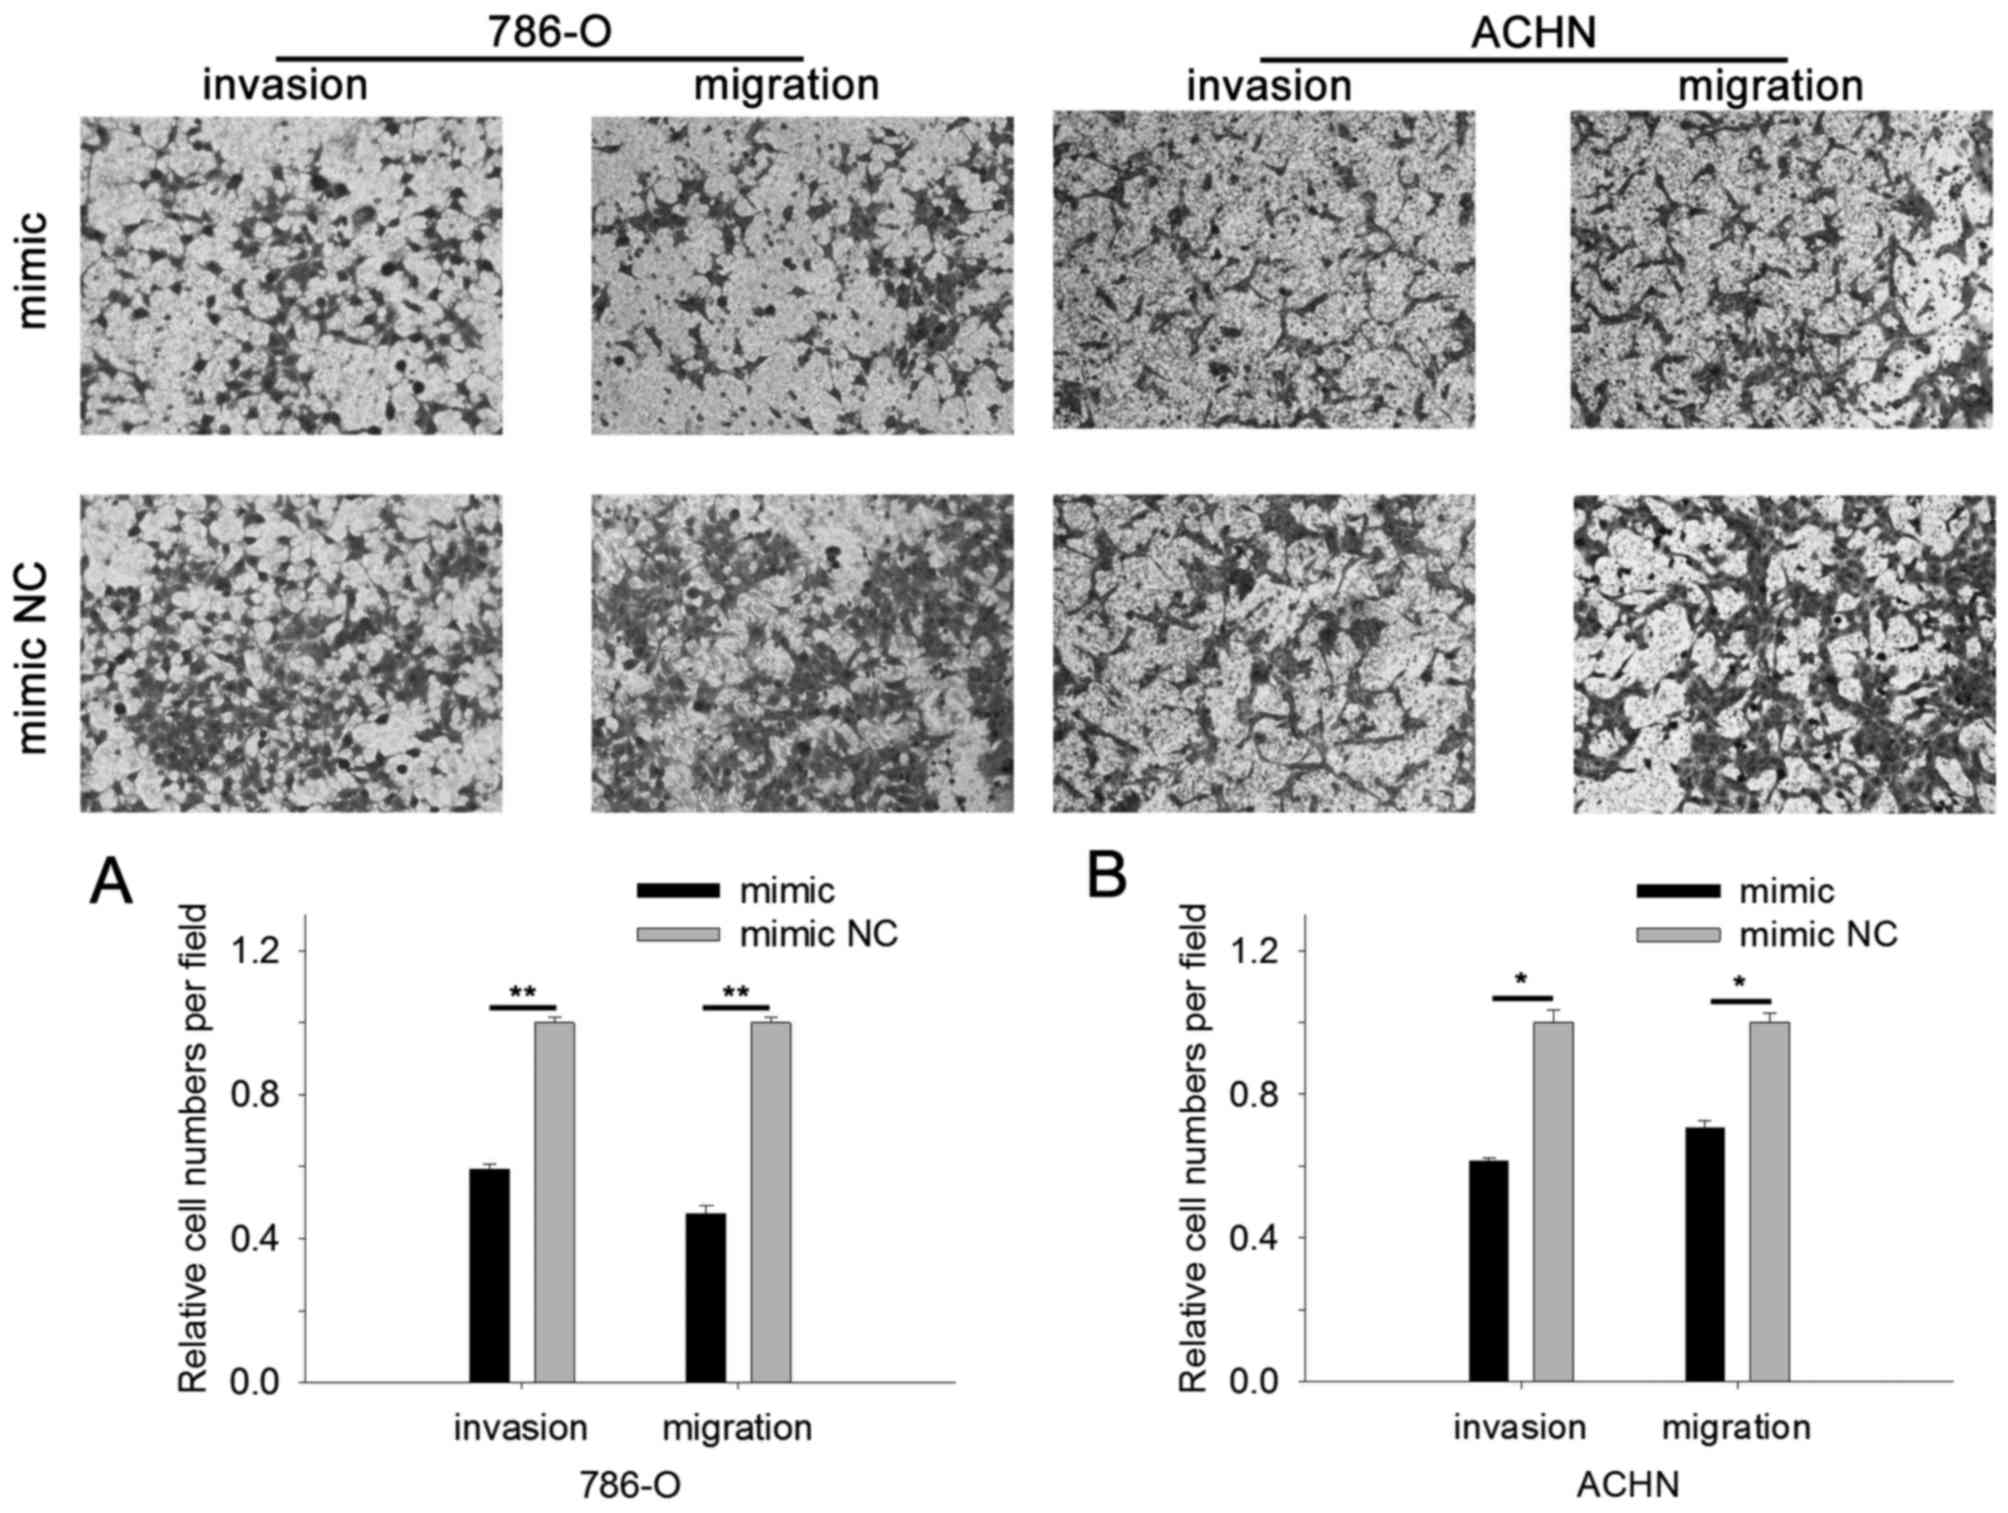
results of Transwell assay revealed that upregulation of
miR-514a-3p suppressed cell migration and invasion. As shown in
Fig. 5A, the invasive 786-O cell
number was reduced by 40.61% (P<0.01) and migratory cells were
reduced by 53.08% (P<0.01) for cells transfected with
miR-514a-3p mimics. For ACHN cells, upregulation of miR-514a-3p
reduced invasive cells by 38.55% (P<0.05) and migratory cells by
29.44% (P<0.05), as shown in Fig.
5B. The results indicated that miR-514a-3p suppressed RCC cell
mobility.
miR-514a-3p induces cell
apoptosis
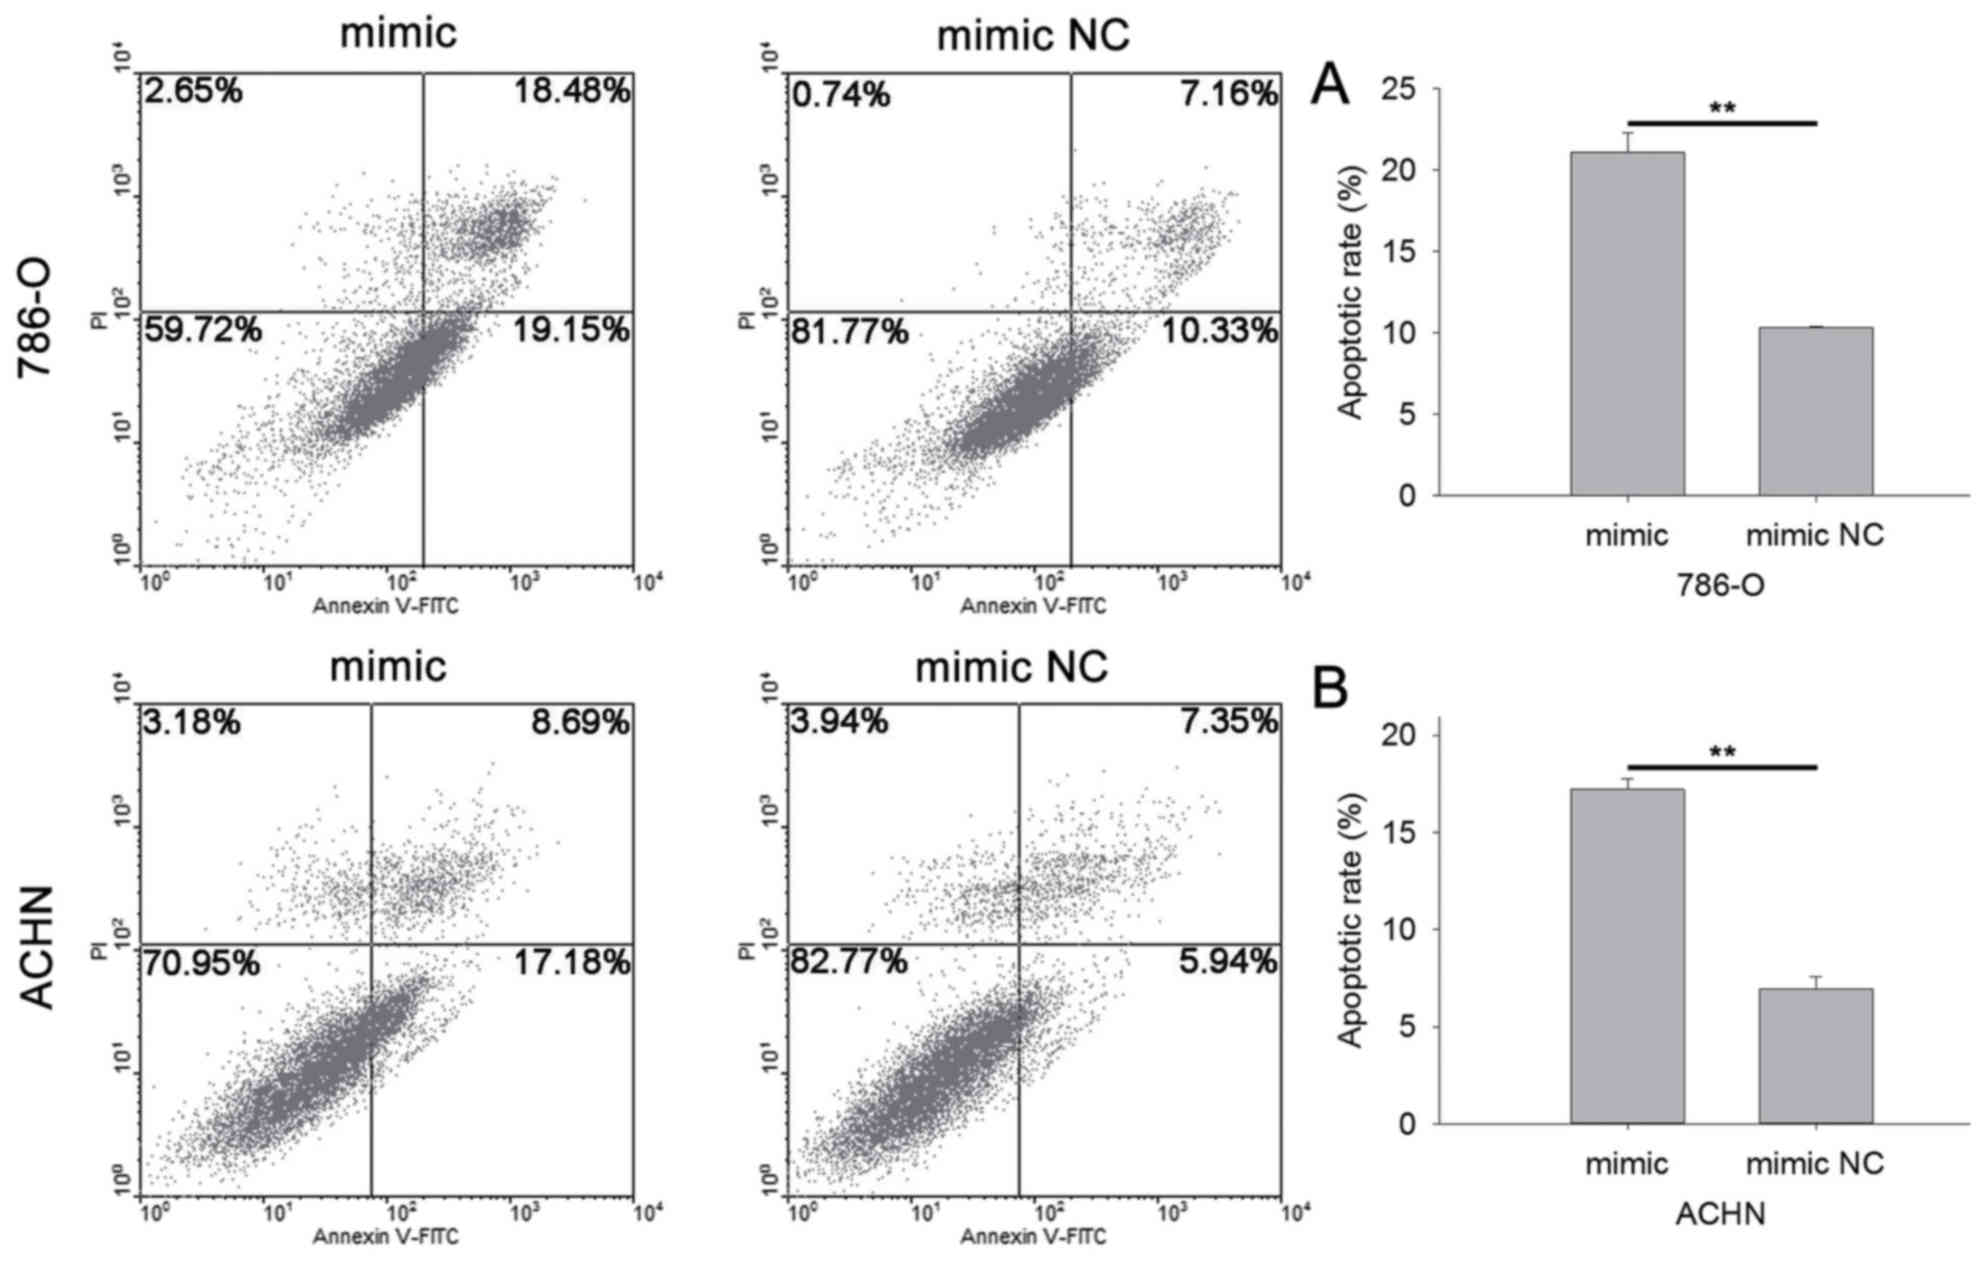
The apoptotic rate was qualified by flow cytometry
and Hoechst 33342 staining. The results of flow cytometry indicated
that the apoptotic rate of cells transfected with miR-514a-3p
mimics or mimic NC was 21.08 vs. 10.32% (P<0.01) in 786-O cells
(Fig. 6A) and 17.21 vs. 6.95%
(P<0.01) in ACHN cells (Fig. 6B).
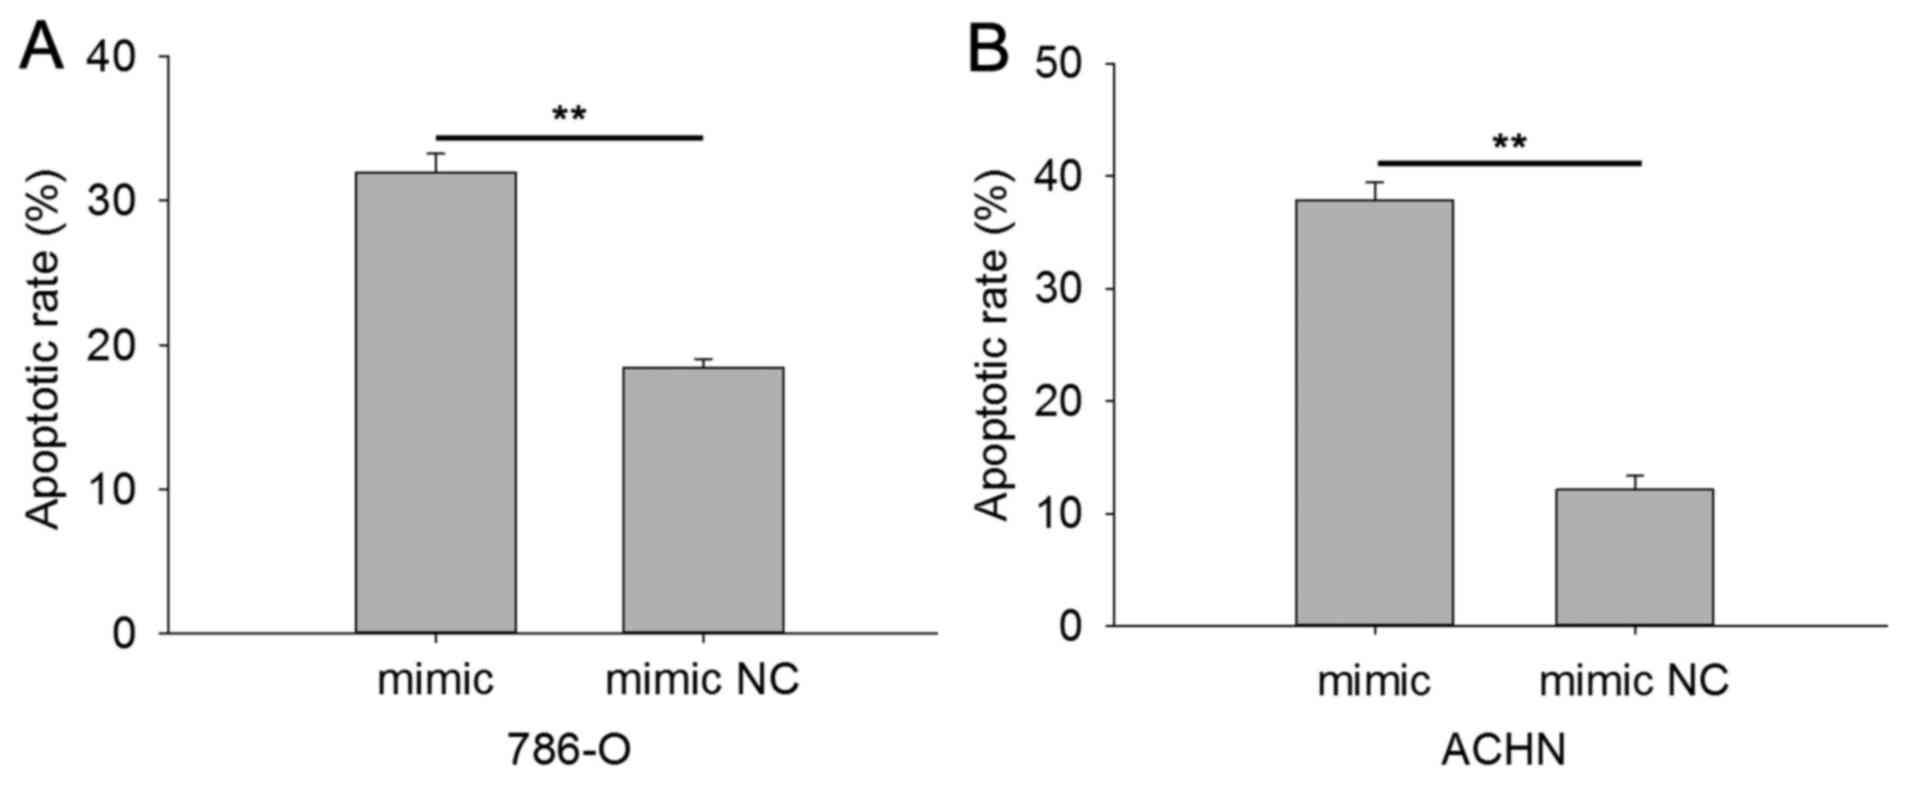
The results of Hoechst 33342 staining are shown in Fig. 7, indicating that the apoptotic rate
was 31.91 vs. 18.41% in 786-O cells transfected with miR-514a-3p
mimics vs. mimic NC (Fig. 7A). In
ACHN cells the apoptotic rate was 37.86% in cells transfected with
mimic and 12.17% in cells transfected with NC (P<0.01; Fig. 7B). The results revealed that
miR-514a-3p induced cell apoptosis in RCC.
Discussion
Emerging evidence has highlighted the role of
non-coding RNA in post-transcriptional regulation of human
tumorigenesis. Non-coding RNAs are divided into three groups: long
non-coding RNAs, small non-coding RNAs and housekeeping RNAs
(14). miRNA is a kind of non-coding
RNA which is generated through multiple processes (15–17). For
most miRNA in mammals, the primary miRNAs (pri-miRNAs) are the
transcripts transcribed by RNA polymerase II and at the length of
300–1,000 nucleotides. Pri-miRNA is processed in the nucleus by
Drosha and DiGeorge syndrome critical region 8 to produce a small
double-stranded hairpin-shaped pre-miRNA transcript, which is the
precursor miRNA. Finally, the mature miRNA is generated with the
help of Dicer (15–17). The mature miRNA regulates gene
expression post-transcriptionally by binding with the 3′UTR of
targeted mRNA (18–20).
Previous studies have revealed that miRNAs have
unique expression profiles in different types of cancer or diseases
at different stages, which indicates that miRNAs could be used as
biomarkers for diagnosis and serve a significant role in the
occurrence and development of tumors (21,22). In
RCC, certain miRNAs have been described as either oncogenes or
tumor suppressors based on the function and expression level of
miRNAs. For example, miR-29s, miR-1, miR-133a and miR-497 have been
described as tumor suppressors for downregulation in RCC (5,23,24), and the downregulation of miR-497 is
associated with a poor prognosis for RCC patients. Conversely,
miR-29b, miR-21 and miR-210 are overexpressed in RCC (1,11), and
high expression of miR-29b is associated with the
tumor-node-metastasis stage and prognosis of RCC. Thus, miRNAs are
potential biomarkers for diagnosis, prognostic judgment or targeted
therapy in tumors.
miR-514a-3p (previously known as miR-514), located
on chrXq27.3, has been demonstrated to be abnormally expressed in
melanoma and metastatic RCC (25,26). In
melanoma, Stark et al observed that miR-514a-3p negatively
regulated nuclear factor 1 (NF1) and cyclin-dependent kinase 2
(CDK2) (26). Wotschofsky et
al assessed the expression of miR-514a-3p in 111 RCC patients
(22 cases with metastases and 89 without) and the results revealed
that miR-514a-3p was further downregulated in metastatic RCC
compared with non-metastatic RCC tissues (25). It was also indicated that miR-514a-3p
could be used as an indicator of recurrence risk and an independent
prognostic risk factor (25). In the
present study, the results of qPCR revealed that miR-514a-3p was
downregulated in RCC tissues compared with adjacent normal tissues.
It was hypothesized that miR-514a-3p may serve a tumor suppressor
role in RCC. In addition, RCC cellular function was assessed
following overexpression of miR-514a-3p in RCC cells by
transfecting miR-514a-3p mimics. It was observed that
overexpression of miR-514a-3p suppressed RCC cell proliferation,
migration and invasion, and induced RCC cell apoptosis. Thus,
miR-514a-3p is a potential biomarker for RCC and may contribute to
a better understanding of the mechanism of RCC. Taken together, the
results of the present study demonstrated that miR-514a-3p served a
role as tumor suppressor in RCC.
Few studies have investigated the unique expression
profile of miR-514a-3p in different cancers. In melanoma, only NF1
and CDK2 were confirmed to be regulated by miR-514a-3p. It remains
to be elucidated how miR-514a-3p functions as a tumor suppressor.
Further study should focus on the mechanism of miR-514a-3p in
RCC.
In conclusion, the results of the present study
demonstrate that miR-514a-3p is significantly downregulated in RCC
tissues and serves a role as tumor suppressor. Thus, miR-514a-3p is
a potential biomarker for RCC. Further studies should be performed,
focusing on the pathway of miR-514a-3p and the possibility of its
use as a biomarker for RCC.
Acknowledgements
This study was supported by the National Natural
Science Foundation of China (no. 81101922), the Guangdong Natural
Science Foundation (no. 2015A030313889), the Science and Technology
Development Fund Project of Shenzhen (nos. JCYJ20120616144352139,
JCYJ20130402114702124, JCYJ20140415162542975 and
JCYJ20150403091443329) and the Fund of Guangdong Key Medical
Subject.
References
|
1
|
Neal CS, Michael MZ, Rawlings LH, Van der
Hoek MB and Gleadle JM: The VHL-dependent regulation of microRNAs
in renal cancer. BMC Med. 8:642010. View Article : Google Scholar : PubMed/NCBI
|
|
2
|
Rasmussen F: Metastatic renal cell cancer.
Cancer Imaging. 13:374–380. 2013. View Article : Google Scholar : PubMed/NCBI
|
|
3
|
Siegel R, Ma J, Zou Z and Jemal A: Cancer
statistics, 2014. CA Cancer J Clin. 64:9–29. 2014. View Article : Google Scholar : PubMed/NCBI
|
|
4
|
Rini BI, Rathmell WK and Godley P: Renal
cell carcinoma. Curr Opin Oncol. 20:300–306. 2008. View Article : Google Scholar : PubMed/NCBI
|
|
5
|
Zhao X, Zhao Z, Xu W, Hou J and Du X:
Down-regulation of miR-497 is associated with poor prognosis in
renal cancer. Int J Clin Exp Pathol. 8:758–764. 2015.PubMed/NCBI
|
|
6
|
Ljungberg B, Bensalah K, Canfield S,
Dabestani S, Hofmann F, Hora M, Kuczyk MA, Lam T, Marconi L,
Merseburger AS, et al: EAU guidelines on renal cell carcinoma: 2014
update. Eur Urol. 67:913–924. 2015. View Article : Google Scholar : PubMed/NCBI
|
|
7
|
Huang J, Yao X, Zhang J, Dong B, Chen Q,
Xue W, Liu D and Huang Y: Hypoxia-induced downregulation of miR-30c
promotes epithelial-mesenchymal transition in human renal cell
carcinoma. Cancer Sci. 104:1609–1617. 2013. View Article : Google Scholar : PubMed/NCBI
|
|
8
|
Luo Z, Zhang L, Li Z, Jiang C, Dai Y, Liu
X, Zheng Y, Yu H, Xiang J and Li G: miR-149 promotes
epithelial-mesenchymal transition and invasion in nasopharyngeal
carcinoma cells. Zhong Nan Da Xue Xue Bao Yi Xue Ban. 36:604–609.
2011.PubMed/NCBI
|
|
9
|
Cai Y, Li H and Zhang Y: Downregulation of
microRNA-206 suppresses clear cell renal carcinoma proliferation
and invasion by targeting vascular endothelial growth factor A.
Oncol Rep. 35:1778–1786. 2016. View Article : Google Scholar : PubMed/NCBI
|
|
10
|
Wang J, Duan L, Guo T, Gao Y, Tian L, Liu
J, Wang S and Yang J: Downregulation of miR-30c promotes renal
fibrosis by target CTGF in diabetic nephropathy. J Diabetes
Complications. 30:406–414. 2016. View Article : Google Scholar : PubMed/NCBI
|
|
11
|
Xu Y, Zhu J, Lei Z, Wan L, Zhu X, Ye F and
Tong Y: Expression and functional role of miR-29b in renal cell
carcinoma. Int J Clin Exp Pathol. 8:14161–14170. 2015.PubMed/NCBI
|
|
12
|
Tang K and Xu H: Prognostic value of
meta-signature miRNAs in renal cell carcinoma: An integrated miRNA
expression profiling analysis. Sci Rep. 5:102722015. View Article : Google Scholar : PubMed/NCBI
|
|
13
|
Nakada C, Matsuura K, Tsukamoto Y,
Tanigawa M, Yoshimoto T, Narimatsu T, Nguyen LT, Hijiya N, Uchida
T, Sato F, et al: Genome-wide microRNA expression profiling in
renal cell carcinoma: Significant down-regulation of miR-141 and
miR-200c. J Pathol. 216:418–427. 2008. View Article : Google Scholar : PubMed/NCBI
|
|
14
|
Esteller M: Non-coding RNAs in human
disease. Nat Rev Genet. 12:861–874. 2011. View Article : Google Scholar : PubMed/NCBI
|
|
15
|
Miyoshi K, Miyoshi T and Siomi H: Many
ways to generate microRNA-like small RNAs: Non-canonical pathways
for microRNA production. Mol Genet Genomics. 284:95–103. 2010.
View Article : Google Scholar : PubMed/NCBI
|
|
16
|
Ha M and Kim VN: Regulation of microRNA
biogenesis. Nat Rev Mol Cell Biol. 15:509–524. 2014. View Article : Google Scholar : PubMed/NCBI
|
|
17
|
Denby L and Baker AH: Targeting non-coding
RNA for the therapy of renal disease. Curr Opin Pharmacol.
27:70–77. 2016. View Article : Google Scholar : PubMed/NCBI
|
|
18
|
Li M, Wang Y, Song Y, Bu R, Yin B, Fei X,
Guo Q and Wu B: MicroRNAs in renal cell carcinoma: A systematic
review of clinical implications (Review). Oncol Rep. 33:1571–1578.
2015. View Article : Google Scholar : PubMed/NCBI
|
|
19
|
Huang X, Huang M, Kong L and Li Y: miR-372
suppresses tumour proliferation and invasion by targeting IGF2BP1
in renal cell carcinoma. Cell prolif. 48:593–599. 2015. View Article : Google Scholar : PubMed/NCBI
|
|
20
|
Liu XJ, Hong Q, Wang Z, Yu YY, Zou X and
Xu LH: MicroRNA21 promotes interstitial fibrosis via targeting
DDAH1: A potential role in renal fibrosis. Mol Cell Biochem.
411:181–189. 2016. View Article : Google Scholar : PubMed/NCBI
|
|
21
|
Su Z, Chen D, Zhang E, Li Y, Yu Z, Shi M,
Jiang Z, Ni L, Yang S, Gui Y, et al: MicroRNA-509-3p inhibits
cancer cell proliferation and migration by targeting the
mitogen-activated protein kinase kinase kinase 8 oncogene in renal
cell carcinoma. Mol Med Rep. 12:1535–1543. 2015.PubMed/NCBI
|
|
22
|
Song T, Zhang X, Wang C, Wu Y, Cai W, Gao
J and Hong B: MiR-138 suppresses expression of hypoxia-inducible
factor 1α (HIF-1α) in clear cell renal cell carcinoma 786-O cells.
Asian Pac J Cancer Prev. 12:1307–1311. 2011.PubMed/NCBI
|
|
23
|
Kawakami K, Enokida H, Chiyomaru T,
Tatarano S, Yoshino H, Kagara I, Gotanda T, Tachiwada T, Nishiyama
K, Nohata N, et al: The functional significance of miR-1 and
miR-133a in renal cell carcinoma. Eur J Cancer. 48:827–836. 2012.
View Article : Google Scholar : PubMed/NCBI
|
|
24
|
Nishikawa R, Chiyomaru T, Enokida H,
Inoguchi S, Ishihara T, Matsushita R, Goto Y, Fukumoto I, Nakagawa
M and Seki N: Tumour-suppressive microRNA-29s directly regulate
LOXL2 expression and inhibit cancer cell migration and invasion in
renal cell carcinoma. FEBS Lett. 589:2136–2145. 2015. View Article : Google Scholar : PubMed/NCBI
|
|
25
|
Wotschofsky Z, Busch J, Jung M,
Kempkensteffen C, Weikert S, Schaser KD, Melcher I, Kilic E, Miller
K, Kristiansen G, et al: Diagnostic and prognostic potential of
differentially expressed miRNAs between metastatic and
non-metastatic renal cell carcinoma at the time of nephrectomy.
Clin Chim Acta. 416:5–10. 2013. View Article : Google Scholar : PubMed/NCBI
|
|
26
|
Stark MS, Bonazzi VF, Boyle GM, Palmer JM,
Symmons J, Lanagan CM, Schmidt CW, Herington AC, Ballotti R,
Pollock PM and Hayward NK: miR-514a regulates the tumour suppressor
NF1 and modulates BRAFi sensitivity in melanoma. Oncotarget.
6:17753–17763. 2015. View Article : Google Scholar : PubMed/NCBI
|