Introduction
Prostate cancer is a malignancy that occurs in the
prostate epithelial cells and it is the most common type of
reproductive system cancer in males worldwide (1,2). Cancer
statistics in 2016 revealed that prostate cancer accounts for ~20%
novel cancer cases in males in the USA (3). Radical prostatectomy is an effective
treatment to improve patient survival time (4), but it is only suitable for ~10% of all
cases (5). A number of other
therapies, including radiotherapy, hormonal therapy, chemotherapy
and immunotherapy, have been developed for prostate cancer
treatment (6); however, there is
limited information regarding the long-term survival rate, and the
mortality rate of patients with prostate cancer remains high
(7). Therefore, investigations into
novel treatment strategies for patients with prostate cancer are
required.
Gene therapy and small molecule drugs are novel
strategies for cancer treatment, and have received increasing
attention over the past few decades (8). Recently, a number of studies have been
conducted to reveal the underlying molecular mechanisms and
identify treatment targets for prostate cancer (9–20).
Specific genes involved in the DNA damage response, including
breast cancer 1, breast cancer 2 and tumor protein 53 genes, are
mutated during the progression of prostate cancer (9–11). A
number of activated carcinogenic signaling pathways, including
c-Myc, protein kinase B and Ras, induce the replication and genomic
instability of prostate cancer cells (12–14). The
histone-lysine N-methyltransferase gene is overexpressed in
prostate cancer and may act as a therapeutic target (15). Previous studies have primarily focused
on a certain gene or pathway; therefore, it is necessary to explore
the underlying molecular mechanisms and therapy targets for
prostate cancer using other methods.
Identification and analysis of differentially
expressed genes (DEGs) is an effective method to acquire multiple
novel targets for the treatment of diseases (16,17). An
expression profiling analysis for prostate cancer has been studied
previously (18). In addition, DNA
methylation alterations in prostate cancer have been analyzed using
the gene expression profile GSE38241 (19), and clinically relevant subtypes,
including subgroups I (the clinically least aggressive subclass)
and subgroups II/III (clinically aggressive tumor subclasses), of
prostate cancer have been studied using the gene expression profile
GSE3933 (20). However, DEGs and
their regulatory factors between prostate cancer and normal samples
were not analyzed as part of the present study.
In the present study, the expression-profiling data
GSE38241 and GSE3933 were integrated to identify DEGs between
prostate cancer samples and normal samples. The functions of DEGs
were analyzed using Gene Ontology (GO) and the Kyoto Encyclopedia
of Genes and Genomes (KEGG) enrichment analysis. Furthermore,
protein-protein interactions (PPIs) of DEGs were investigated and
hub genes, genes identified to be key genes, in the PPI network
were identified. In addition, transcriptional regulatory networks
were constructed on the basis of the associations between
transcription factors (TFs) and DEGs. The results of the present
study may identify the underlying molecular mechanisms of prostate
cancer and provide targets for the treatment of prostate
cancer.
Materials and methods
mRNA expression profiles of prostate
cancer
The datasets of prostate cancer gene expression
profiling by array with large sample size and high data quality
were searched in the Gene Expression Omnibus database (http://www.ncbi.nlm.nih.gov/geo). Prostate cancer
and normal control samples were included in the eligible dataset,
and samples were not treated by additional treatments such as drugs
and radiation. As a result, two prostate cancer expression
profiling datasets were chosen for analysis, GSE38241 (18) and GSE3933 (19). Data of 39 samples (18 prostate cancer
samples and 21 normal samples) in GSE38241 were produced using
platform GPL4133 Agilent-014850 Whole Human Genome Microarray 4×44K
G4112F. Data of 112 samples in GSE3933 were produced using three
platforms, consisting of GPL2695 SHBB (26 samples), GPL3044 SHCQ
(45 samples) and GPL3289 SHBW (41 samples). In the dataset GSE3933,
only the data of 45 samples (29 prostate cancer samples and 16
normal samples) obtained from platform GPL3044 were selected for
additional analysis, since gene probes detected by platform GPL3044
overlapped more with those from platform GPL4133. Data and probe
annotation files were downloaded for analysis.
Data preprocessing
Subsequent to obtaining the raw data, probe IDs of
the matrix data were first translated into corresponding gene
symbols. If one gene symbol was matched by a number of probe IDs,
the mean expression value was selected as the expression level of
this gene. In order to obtain reliable results, only the common
genes in the two datasets were selected for the following analysis.
During the process of merging the two different datasets, batch
errors (21) were removed using the
ComBat command of sva package in R language (http://www.bioconductor.org/packages/release/bioc/html/sva.html
version 3.5) (22). Subsequently,
quantile normalization of genes was performed by preprocessCore
package in R (http://www.bioconductor.org/packages/release/bioc/html/preprocessCore.html;
version 1.38.1) and an expression profile matrix was generated
consisting of 12,621 genes.
Identification of DEGs
The linear models for microarray data package
(http://www.bioconductor.org/packages/release/bioc/html/limma.html;
version 3.22.7) (23), a widely-used
tool for the identification of DEGs, was applied to identify DEGs
between prostate cancer samples and normal samples. The raw P-value
for each gene was calculated and subsequently adjusted into the
false discovery rate (FDR) using the Benjamini-Hochberg method
(24). Only the genes that met the
threshold criteria of |log2 fold change| >1 and
FDR<0.05 were identified as DEGs.
Functional enrichment analysis of
DEGs
In order to investigate the signaling pathways and
biological processes which may be involved in the progression of
prostate cancer, GO (25) and KEGG
(26) enrichment analysis were
performed using the Database for Annotation, Visualization and
Integrated Discovery (27,28). This provided a number of functional
annotation tools to reveal the biological function of genes.
Functional terms with P<0.05 were considered to indicate a
statistically significant difference.
PPI networks and module analysis
PPIs of DEGs were searched in the Search Tool for
the Retrieval of Interacting Genes/Proteins database (29), which integrates a number of known and
predicted associations between proteins. The PPI network was
visualized using Cytoscape (30), an
open source software for integrating biomolecular networks. In the
network, ‘node’ represents a gene or protein, and ‘line’ represents
an interaction between two nodes. The degree of each node is equal
to the number of nodes that the node interacted with. The node
degree represents its topological importance; the higher the
degree, the more important the node is (31). Hub genes were identified on the basis
of the degree of genes in the PPI network. Molecular Complex
Detection (MCODE) (32) is a tool
used to determine the dense connections in large PPI networks,
which may represent molecular complexes. In the present study,
MCODE was utilized to screen the modules from the PPI network with
a network aggregation score >10.
Constructing the transcriptional
regulatory networks
TFs targeting DEGs were identified from DEGs on the
basis of information in the TRANSFAC database (http://gene-regulation.com/pub/databases.html; version
7.0) (33), which provided data on
eukaryotic transcription factors, consensus binding sequences
(positional weight matrices), experimentally proven binding sites
and regulated genes. Transcription regulatory networks were
visualized using Cytoscape, as aforementioned, in order to observe
the interactions between TFs and target DEGs.
Results
Identified DEGs
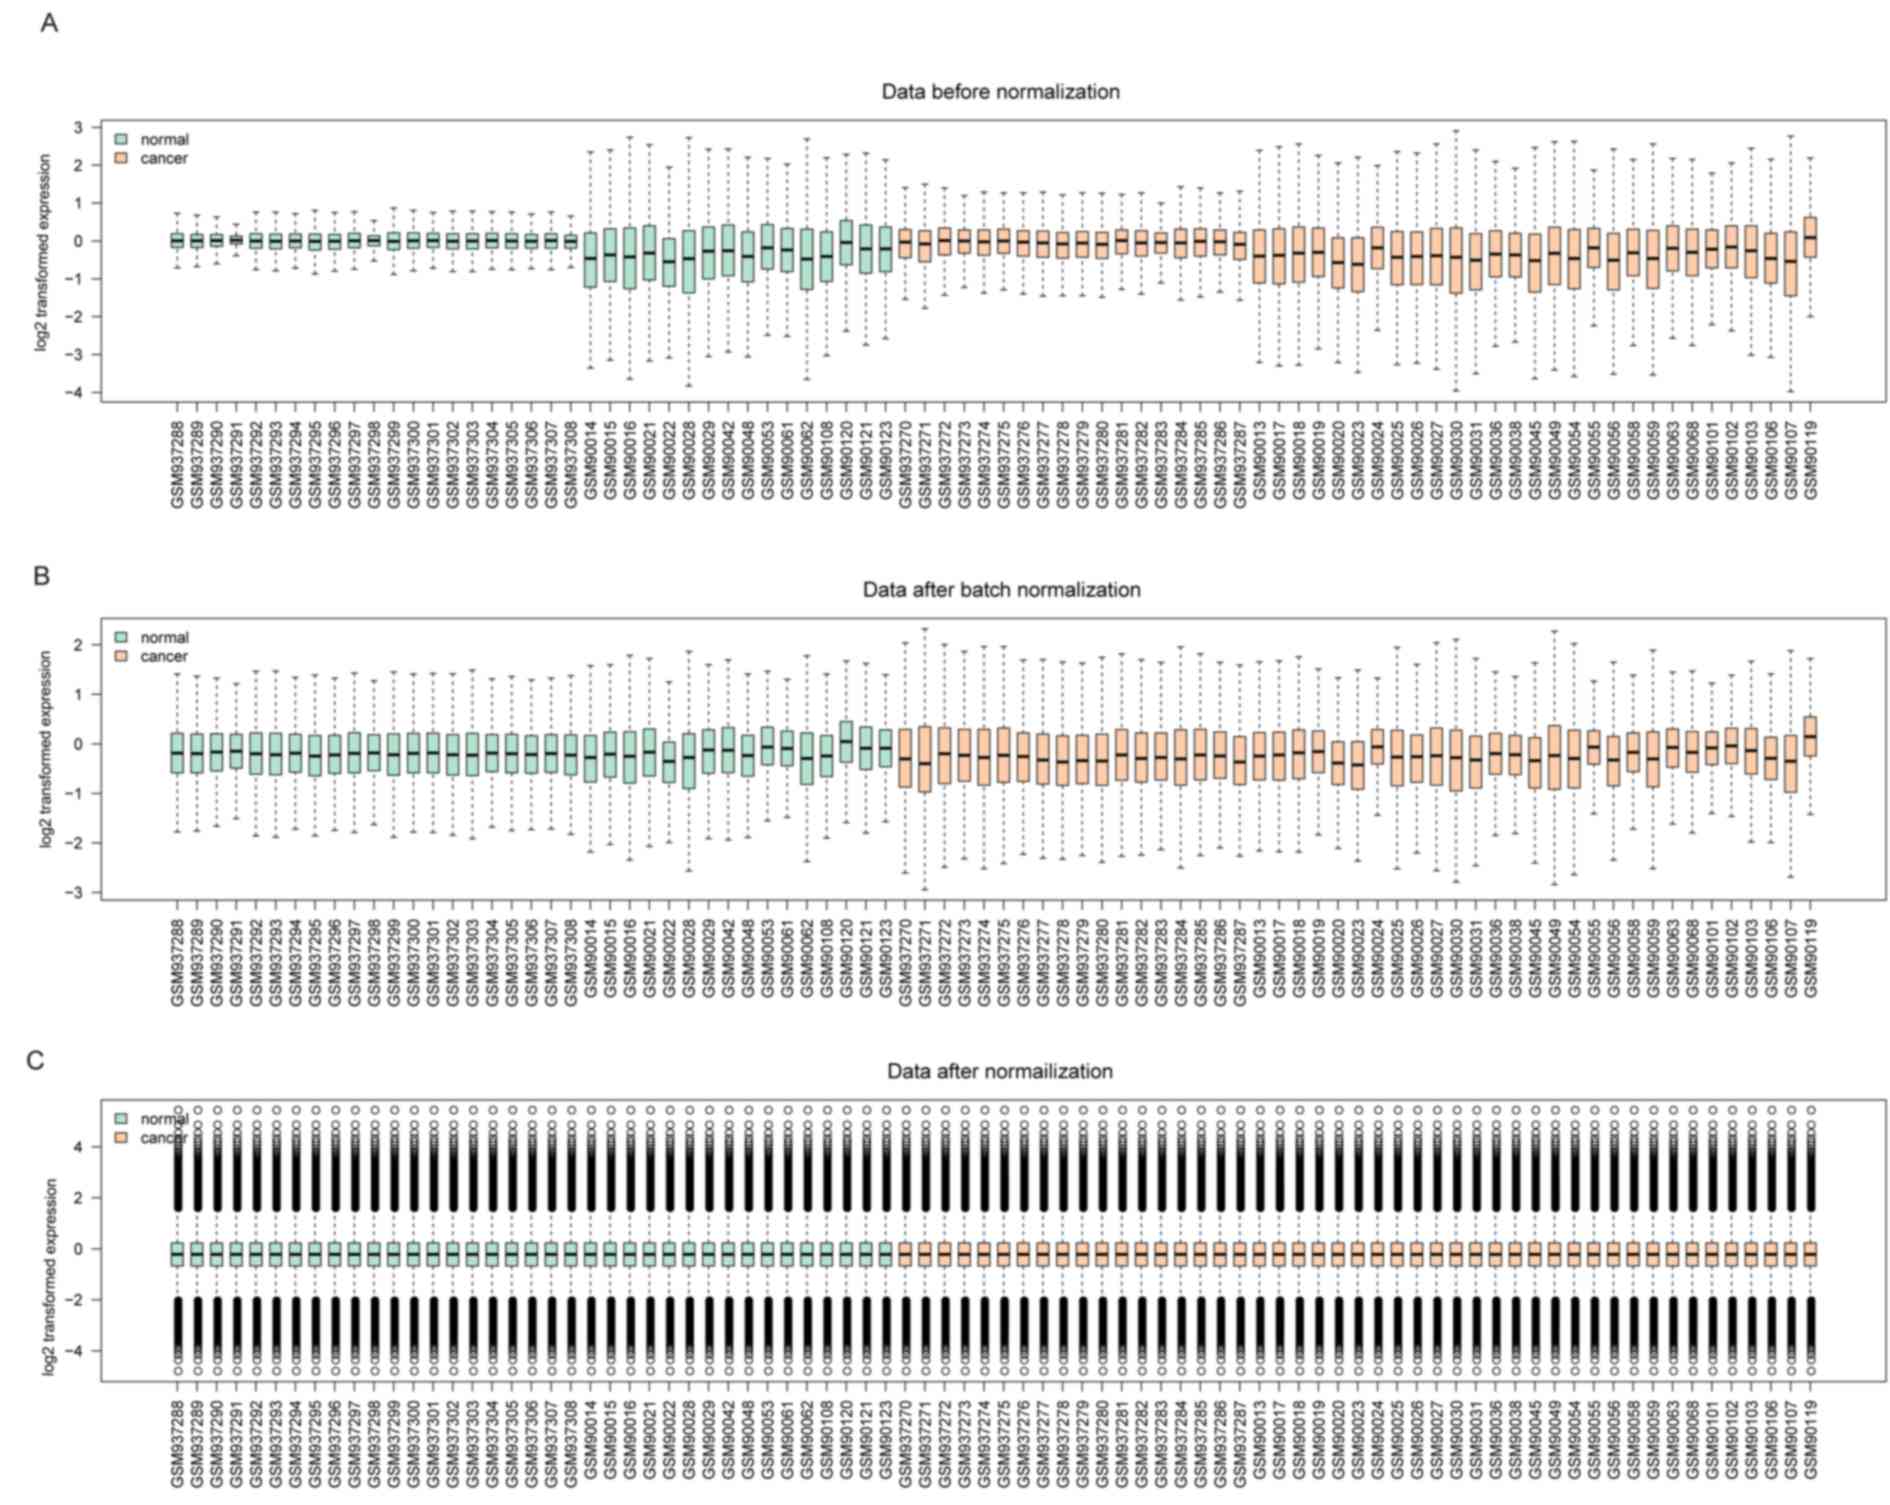
Prior to normalization, the medians of gene
expression in each sample were markedly distinct (Fig. 1A). However, the medians became
consistent and were at a similar level following normalization
(Fig. 1B and C), suggesting that the
normalization process was successful and the normalized data may be
used for additional analysis.
On the basis of the threshold criteria, a total of
529 DEGs were obtained, including 129 upregulated and 400
downregulated genes in prostate cancer samples, compared with
normal samples.
Enrichment analysis of DEGs
To reveal the biological functions of DEGs, GO and
KEGG pathway enrichment analyses were performed for the up- and
downregulated genes. Upregulated genes were primarily enriched in
cell cycle-associated GO terms, including cell cycle phase, spindle
and adenosine 5′-phosphate binding (Table
I). Downregulated genes were identified to be significantly
involved in a set of GO terms including muscle organ development,
negative regulation of cell proliferation and cell adhesion
(Table I).
 | Table I.Top 5 most significant upregulated
and downregulated DEGs from GO analysis across 3 categories
including BP, CC and MM. |
Table I.
Top 5 most significant upregulated
and downregulated DEGs from GO analysis across 3 categories
including BP, CC and MM.
| A, Upregulated
DEGs |
|---|
|
|---|
| ID | Term | Count | P-value |
|---|
| GOTERM_BP_FAT | GO:0000279-M
phase | 27 |
1.68×10⁻²⁰ |
| GOTERM_BP_FAT | GO:0022403-cell
cycle phase | 29 |
2.93×10⁻²⁰ |
| GOTERM_BP_FAT | GO:0000280-nuclear
division | 22 |
2.64×10⁻¹⁸ |
| GOTERM_BP_FAT |
GO:0007067-mitosis | 22 |
2.64×10⁻¹⁸ |
| GOTERM_BP_FAT | GO:0000087-M phase
of mitotic cell cycle | 22 |
3.84×10⁻¹⁸ |
| GOTERM_CC_FAT |
GO:0005819-spindle | 10 |
4.39×10⁻⁷ |
| GOTERM_CC_FAT |
GO:0000775-chromosome, centromeric
region | 9 |
1.34×10⁻⁶ |
| GOTERM_CC_FAT |
GO:0000793-condensed chromosome | 9 |
1.81×10⁻⁶ |
| GOTERM_CC_FAT |
GO:0000777-condensed chromosome
kinetochore | 7 |
1.93×10⁻⁶ |
| GOTERM_CC_FAT |
GO:0000779-condensed chromosome,
centromeric region | 7 |
4.16×10⁻⁶ |
| GOTERM_MF_FAT | GO:0005524-ATP
binding | 27 |
1.39×10⁻⁵ |
| GOTERM_MF_FAT | GO:0030554-adenyl
nucleotide binding | 28 |
1.49×10⁻⁵ |
| GOTERM_MF_FAT | GO:0032559-adenyl
ribonucleotide binding | 27 |
1.76×10⁻⁵ |
| GOTERM_MF_FAT | GO:0001883-purine
nucleoside binding | 28 |
1.97×10⁻⁵ |
| GOTERM_MF_FAT |
GO:0001882-nucleoside binding | 28 |
2.23×10⁻⁵ |
|
| B, Downregulated
DEGs |
|
| ID | Term | Count | P-value |
|
| GOTERM_BP_FAT | GO:0007517-muscle
organ development | 23 |
2.94×10⁻⁹ |
| GOTERM_BP_FAT | GO:0008285-negative
regulation of cell proliferation | 27 |
2.35×10⁻⁷ |
| GOTERM_BP_FAT | GO:0007155-cell
adhesion | 39 |
6.17×10⁻⁷ |
| GOTERM_BP_FAT |
GO:0022610-biological adhesion | 39 |
6.27×10⁻⁷ |
| GOTERM_BP_FAT | GO:0003012-muscle
system process | 16 |
7.10×10⁻⁶ |
| GOTERM_CC_FAT |
GO:0044421-extracellular region part | 59 |
2.25×10⁻¹² |
| GOTERM_CC_FAT |
GO:0005576-extracellular region | 90 |
4.38×10⁻¹¹ |
| GOTERM_CC_FAT |
GO:0031012-extracellular matrix | 29 |
3.94×10⁻⁹ |
| GOTERM_CC_FAT |
GO:0005578-proteinaceous extracellular
matrix | 26 |
5.96×10⁻⁸ |
| GOTERM_CC_FAT |
GO:0043292-contractile fiber | 16 |
8.23×10⁻⁸ |
| GOTERM_MF_FAT | GO:0046870-cadmium
ion binding | 7 |
3.11×10⁻⁸ |
| GOTERM_MF_FAT | GO:0003779-actin
binding | 27 |
5.32×10⁻⁸ |
| GOTERM_MF_FAT |
GO:0008092-cytoskeletal protein
binding | 34 |
9.74×10⁻⁸ |
| GOTERM_MF_FAT | GO:0005507-copper
ion binding | 12 |
5.45×10⁻⁷ |
| GOTERM_MF_FAT |
GO:0005198-structural molecule
activity | 33 |
3.76×10⁻⁵ |
According to KEGG pathway enrichment analysis,
upregulated genes were significantly associated with cell cycle and
oocyte meiosis signaling pathways (Table
II). Downregulated DEGs were principally implicated in vascular
smooth muscle and focal adhesion signaling pathways (Table II).
| Table II.KEGG pathway analysis of the
upregulated and downregulated differentially expressed genes. |
Table II.
KEGG pathway analysis of the
upregulated and downregulated differentially expressed genes.
| A, Upregulated
genes |
|---|
|
|---|
| Pathway term | Count | P-value |
|---|
| hsa04110: Cell
cycle | 7 |
3.79×10⁻⁴ |
| hsa04114: Oocyte
meiosis | 5 |
1.04×10⁻² |
| hsa00983: Drug
metabolism | 3 |
4.45×10⁻² |
|
| B, Downregulated
genes |
|
| Pathway term | Count | P-value |
|
| hsa04270: Vascular
smooth muscle contraction | 15 |
2.66×10⁻⁷ |
| hsa04510: Focal
adhesion | 16 |
6.41×10⁻⁵ |
| hsa00982: Drug
metabolism | 9 |
8.87×10⁻⁵ |
| hsa05414: Dilated
cardiomyopathy | 9 |
1.35×10⁻³ |
| hsa00980:
Metabolism of xenobiotics by cytochrome P450 | 7 |
2.70×10⁻³ |
PPI networks construction and MCODE
analysis
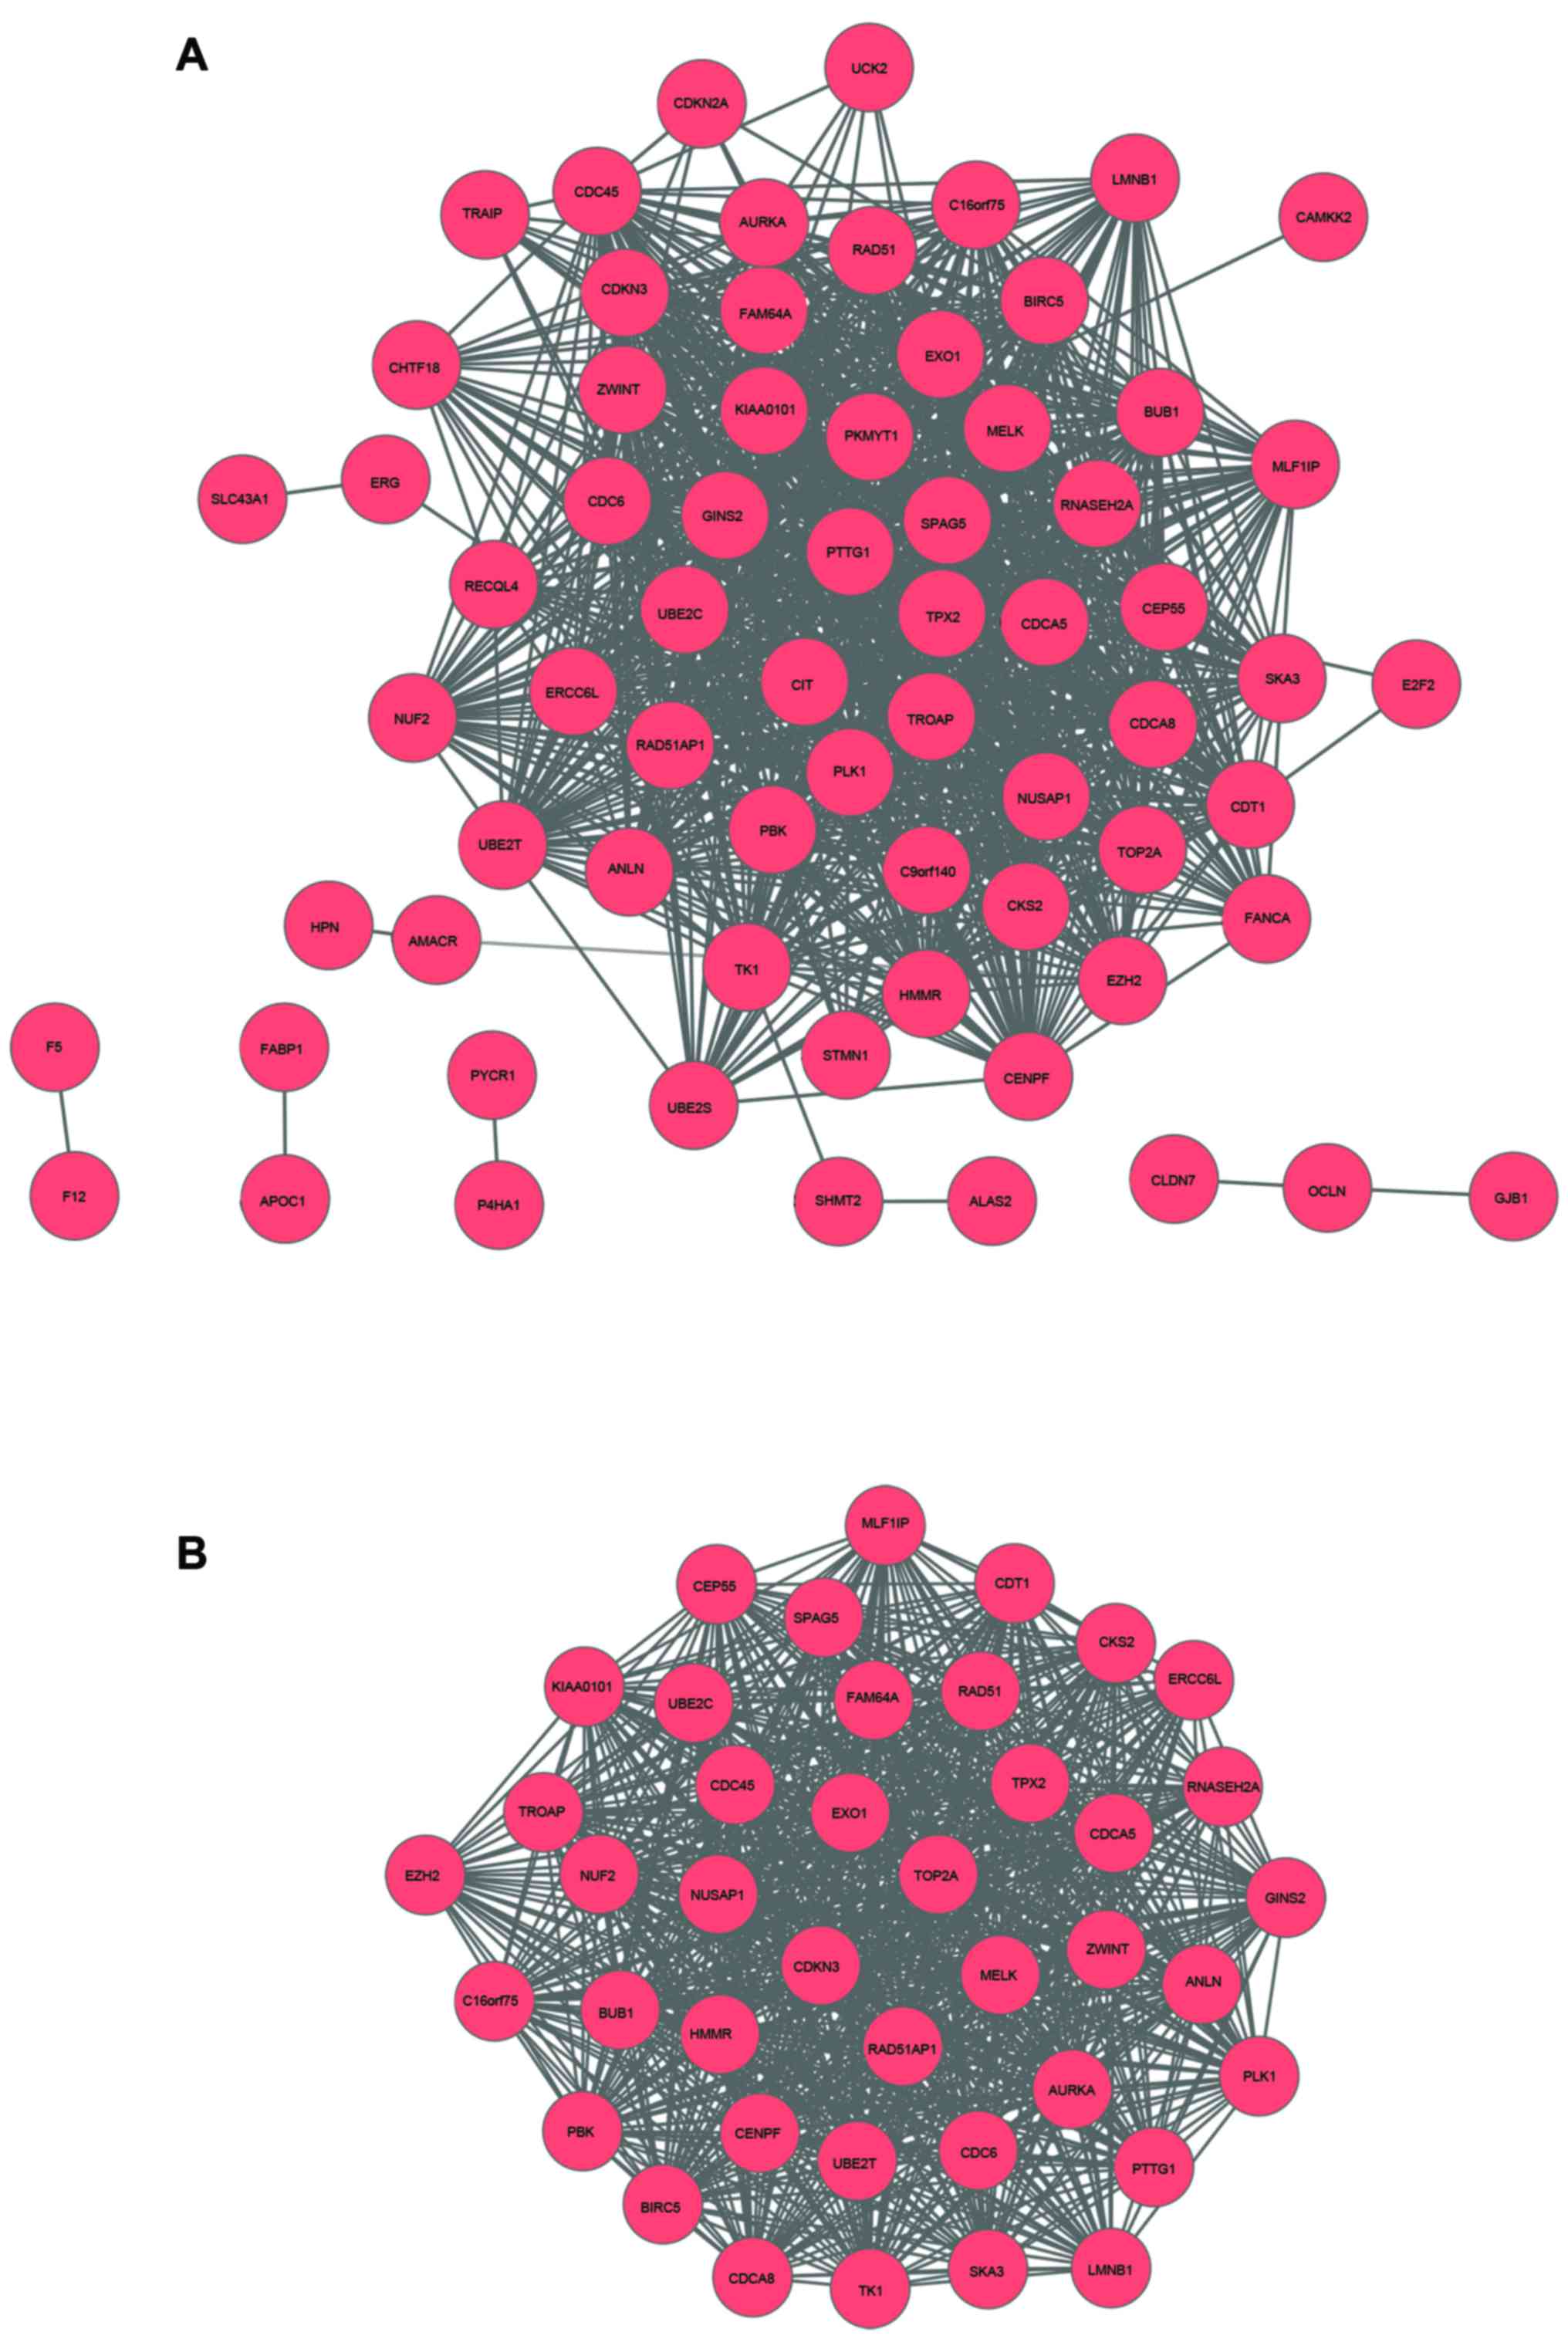
To investigate interactions between the DEGs, PPI
networks for the DEGs were constructed. There were 69 nodes and 180
edges in the PPI network of the upregulated genes (Fig. 2A). According to the degrees of nodes,
four genes were selected as the hub nodes of the PPI network, cell
division cycle associated 8 (CDCA8), cell division cycle
associated 5 (CDCA5, ubiquitin-conjugating enzyme E2C
(UBE2C) and thymidine kinase 1 (TK1). These four DEGs
interacted with >45 nodes in the PPI network, suggesting the
four DEGs served crucial roles in the PPI network. One sub-network
was selected from the upregulated PPI network (network aggregation
score, 19.366), containing 41 nodes and 794 edges (Fig. 2B). Enrichment analysis of genes in the
sub-network revealed that genes in the sub-network were primarily
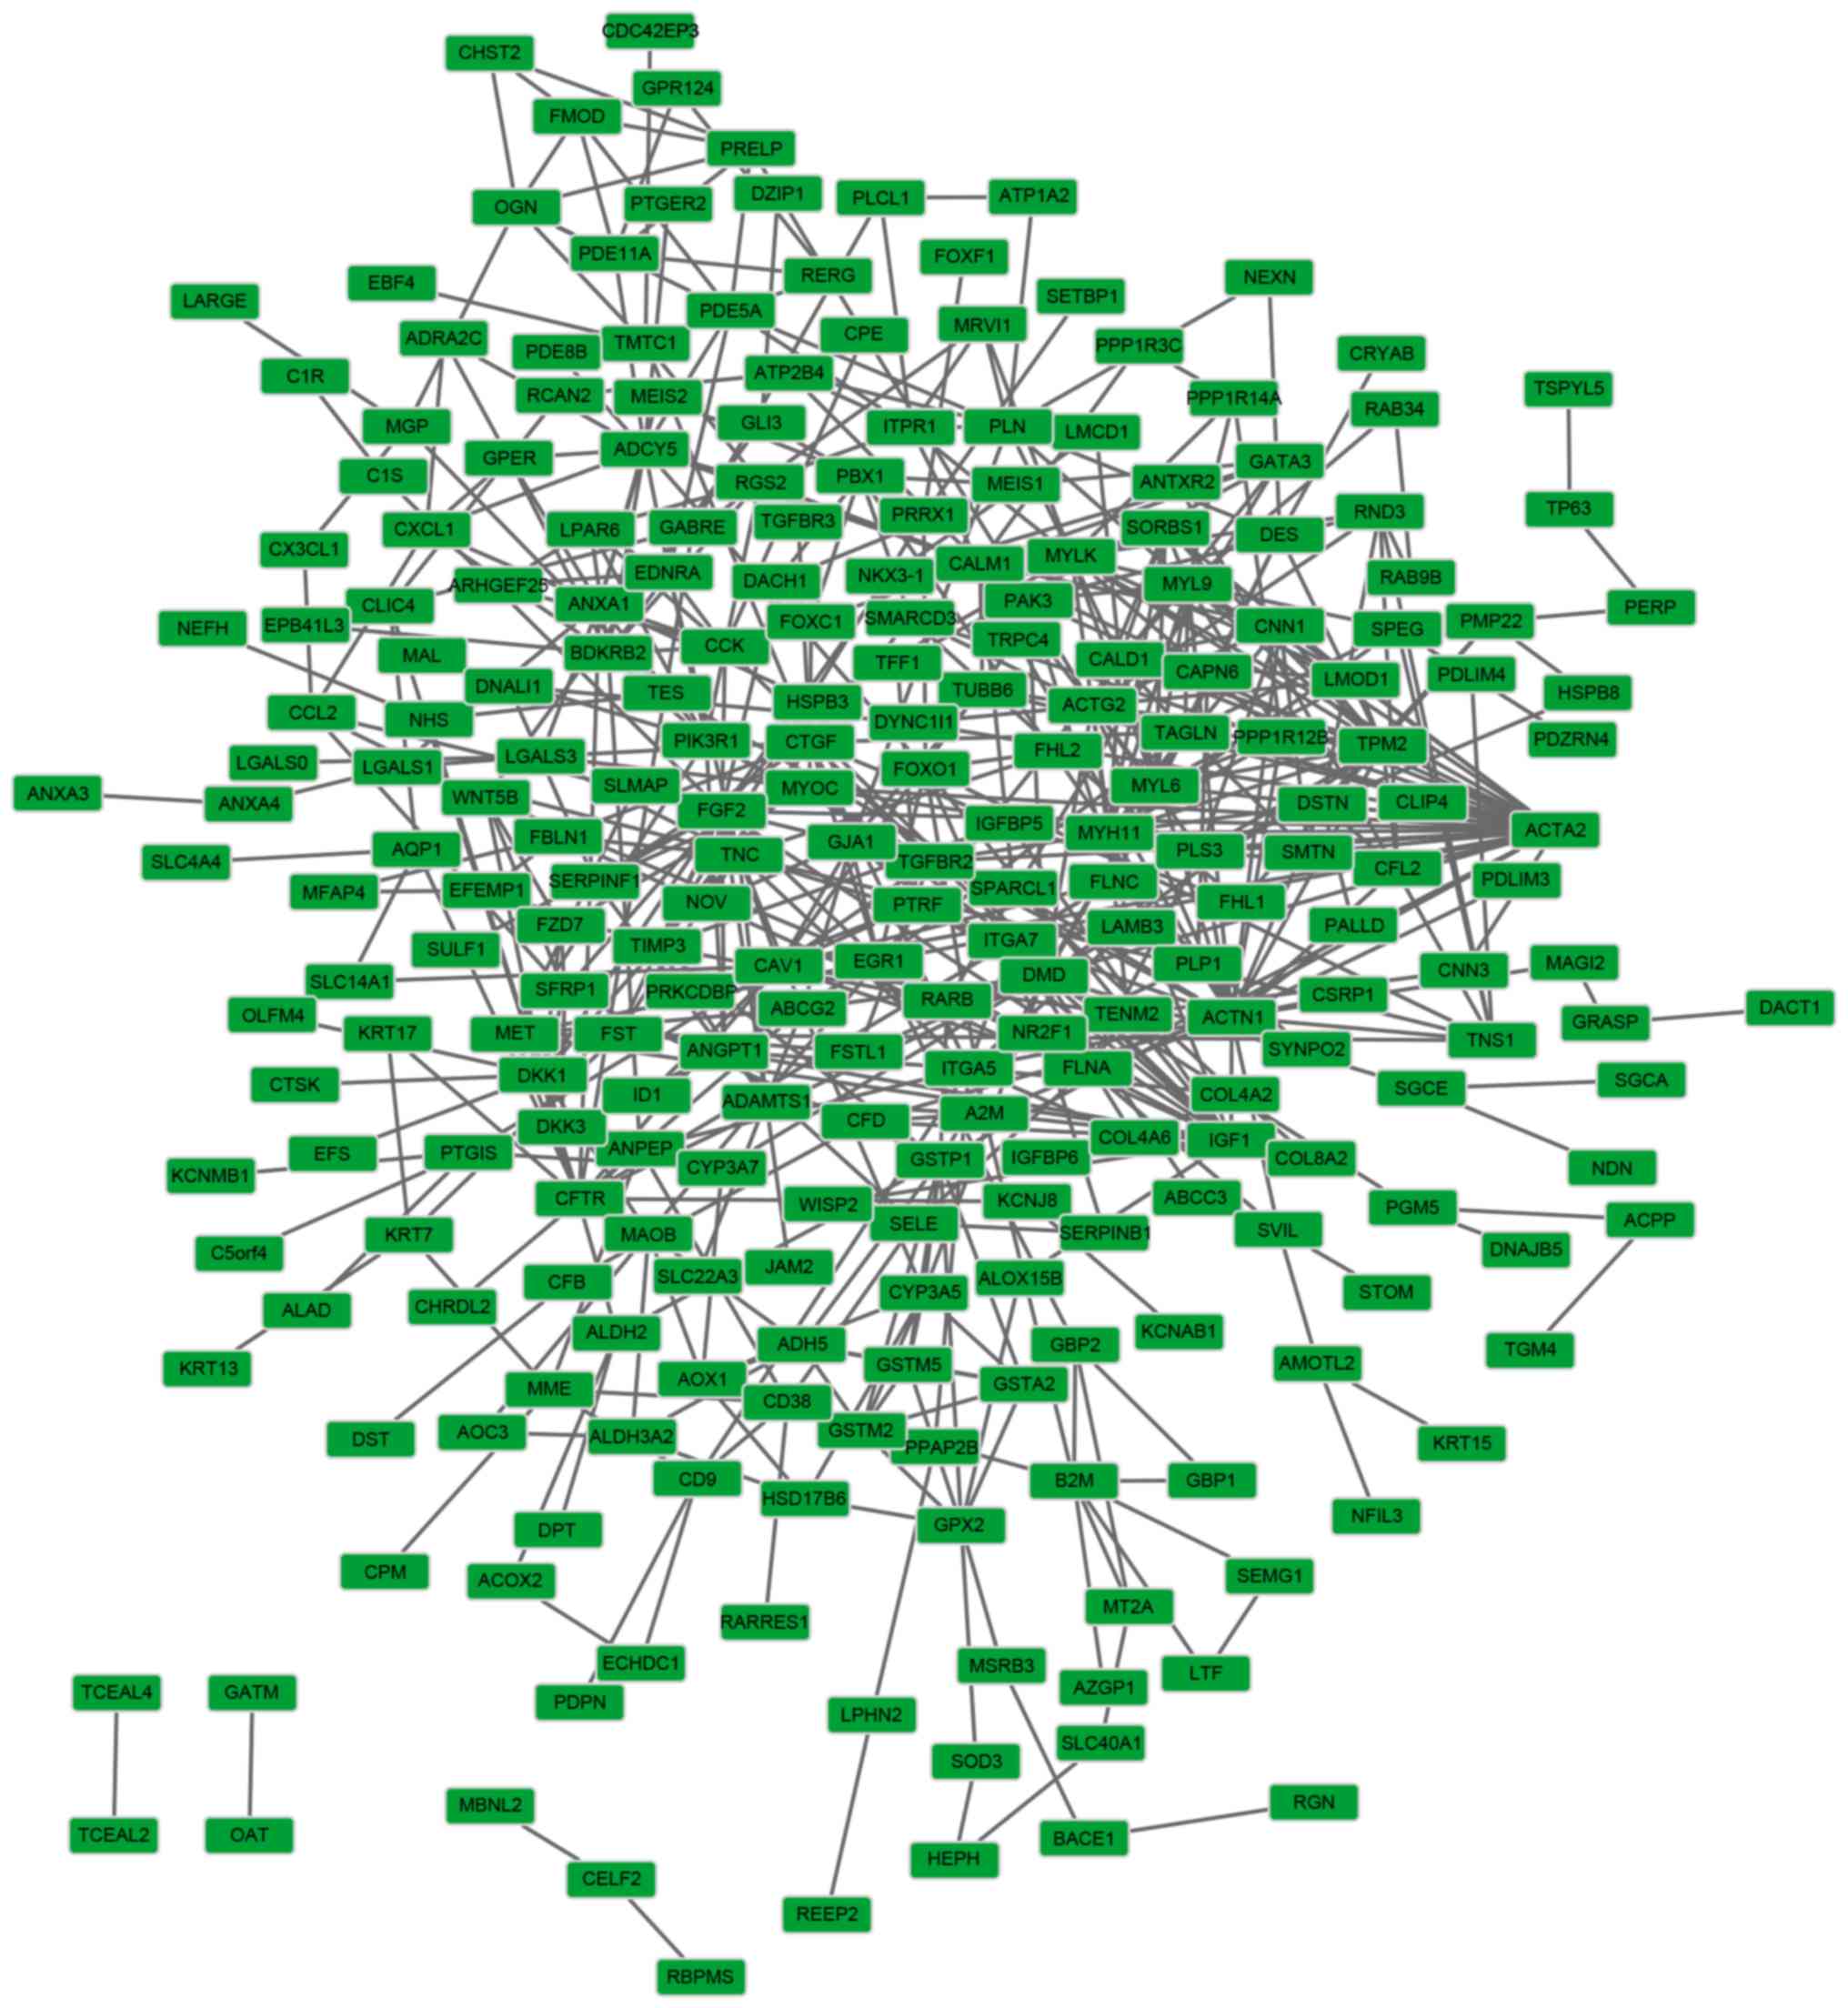
associated with cell cycle and cell division (Tables III and IV). Furthermore, 257 nodes and 594 edges
were included in the PPI network of the downregulated genes
(Fig. 3). However, no significant
module was screened with the threshold of network aggregation score
>10.
| Table III.Top 5 most significant genes within
the sub-network of upregulated genes from GO analysis of 3
categories including BP, CC and MM. |
Table III.
Top 5 most significant genes within
the sub-network of upregulated genes from GO analysis of 3
categories including BP, CC and MM.
| Category | Term | Count | P-value |
|---|
| GOTERM_BP_FAT | GO:0000279-M
phase | 23 |
4.23×10⁻²⁷ |
| GOTERM_BP_FAT | GO:0022403-cell
cycle phase | 24 |
1.28×10⁻²⁶ |
| GOTERM_BP_FAT |
GO:0007067-mitosis | 20 |
3.12×10⁻²⁵ |
| GOTERM_BP_FAT | GO:0000280-nuclear
division | 20 |
3.12×10⁻²⁵ |
| GOTERM_BP_FAT | GO:0000087-M phase
of mitotic cell cycle | 20 |
4.44×10⁻²⁵ |
| GOTERM_CC_FAT |
GO:0005819-spindle | 11 |
4.94×10⁻¹³ |
| GOTERM_CC_FAT |
GO:0000775-chromosome, centromeric
region | 10 |
4.83×10⁻¹² |
| GOTERM_CC_FAT |
GO:0000777-condensed chromosome
kinetochore | 8 |
3.94×10⁻¹¹ |
| GOTERM_CC_FAT |
GO:0015630-microtubule cytoskeleton | 14 |
5.31×10⁻¹¹ |
| GOTERM_CC_FAT |
GO:0000779-condensed chromosome,
centromeric region | 8 |
1.01×10⁻¹⁰ |
| GOTERM_MF_FAT | GO:0005524-ATP
binding | 13 |
3.65×10⁻⁵ |
| GOTERM_MF_FAT | GO:0032559-adenyl
ribonucleotide binding | 13 |
4.17×10⁻⁵ |
| GOTERM_MF_FAT | GO:0030554-adenyl
nucleotide binding | 13 |
7.02×10⁻⁵ |
| GOTERM_MF_FAT | GO:0001883-purine
nucleoside binding | 13 |
8.15×10⁻⁵ |
| GOTERM_MF_FAT |
GO:0001882-nucleoside binding | 13 |
8.72×10⁻⁵ |
| Table IV.KEGG pathway analysis of the
sub-network of upregulated genes. |
Table IV.
KEGG pathway analysis of the
sub-network of upregulated genes.
| Category | Term | Count | P-value |
|---|
| KEGG_PATHWAY | hsa04110: Cell
cycle | 5 |
1.48×10⁻⁴ |
| KEGG_PATHWAY | hsa04114: Oocyte
meiosis | 4 |
1.88×10⁻³ |
Construction of the transcriptional
regulatory networks
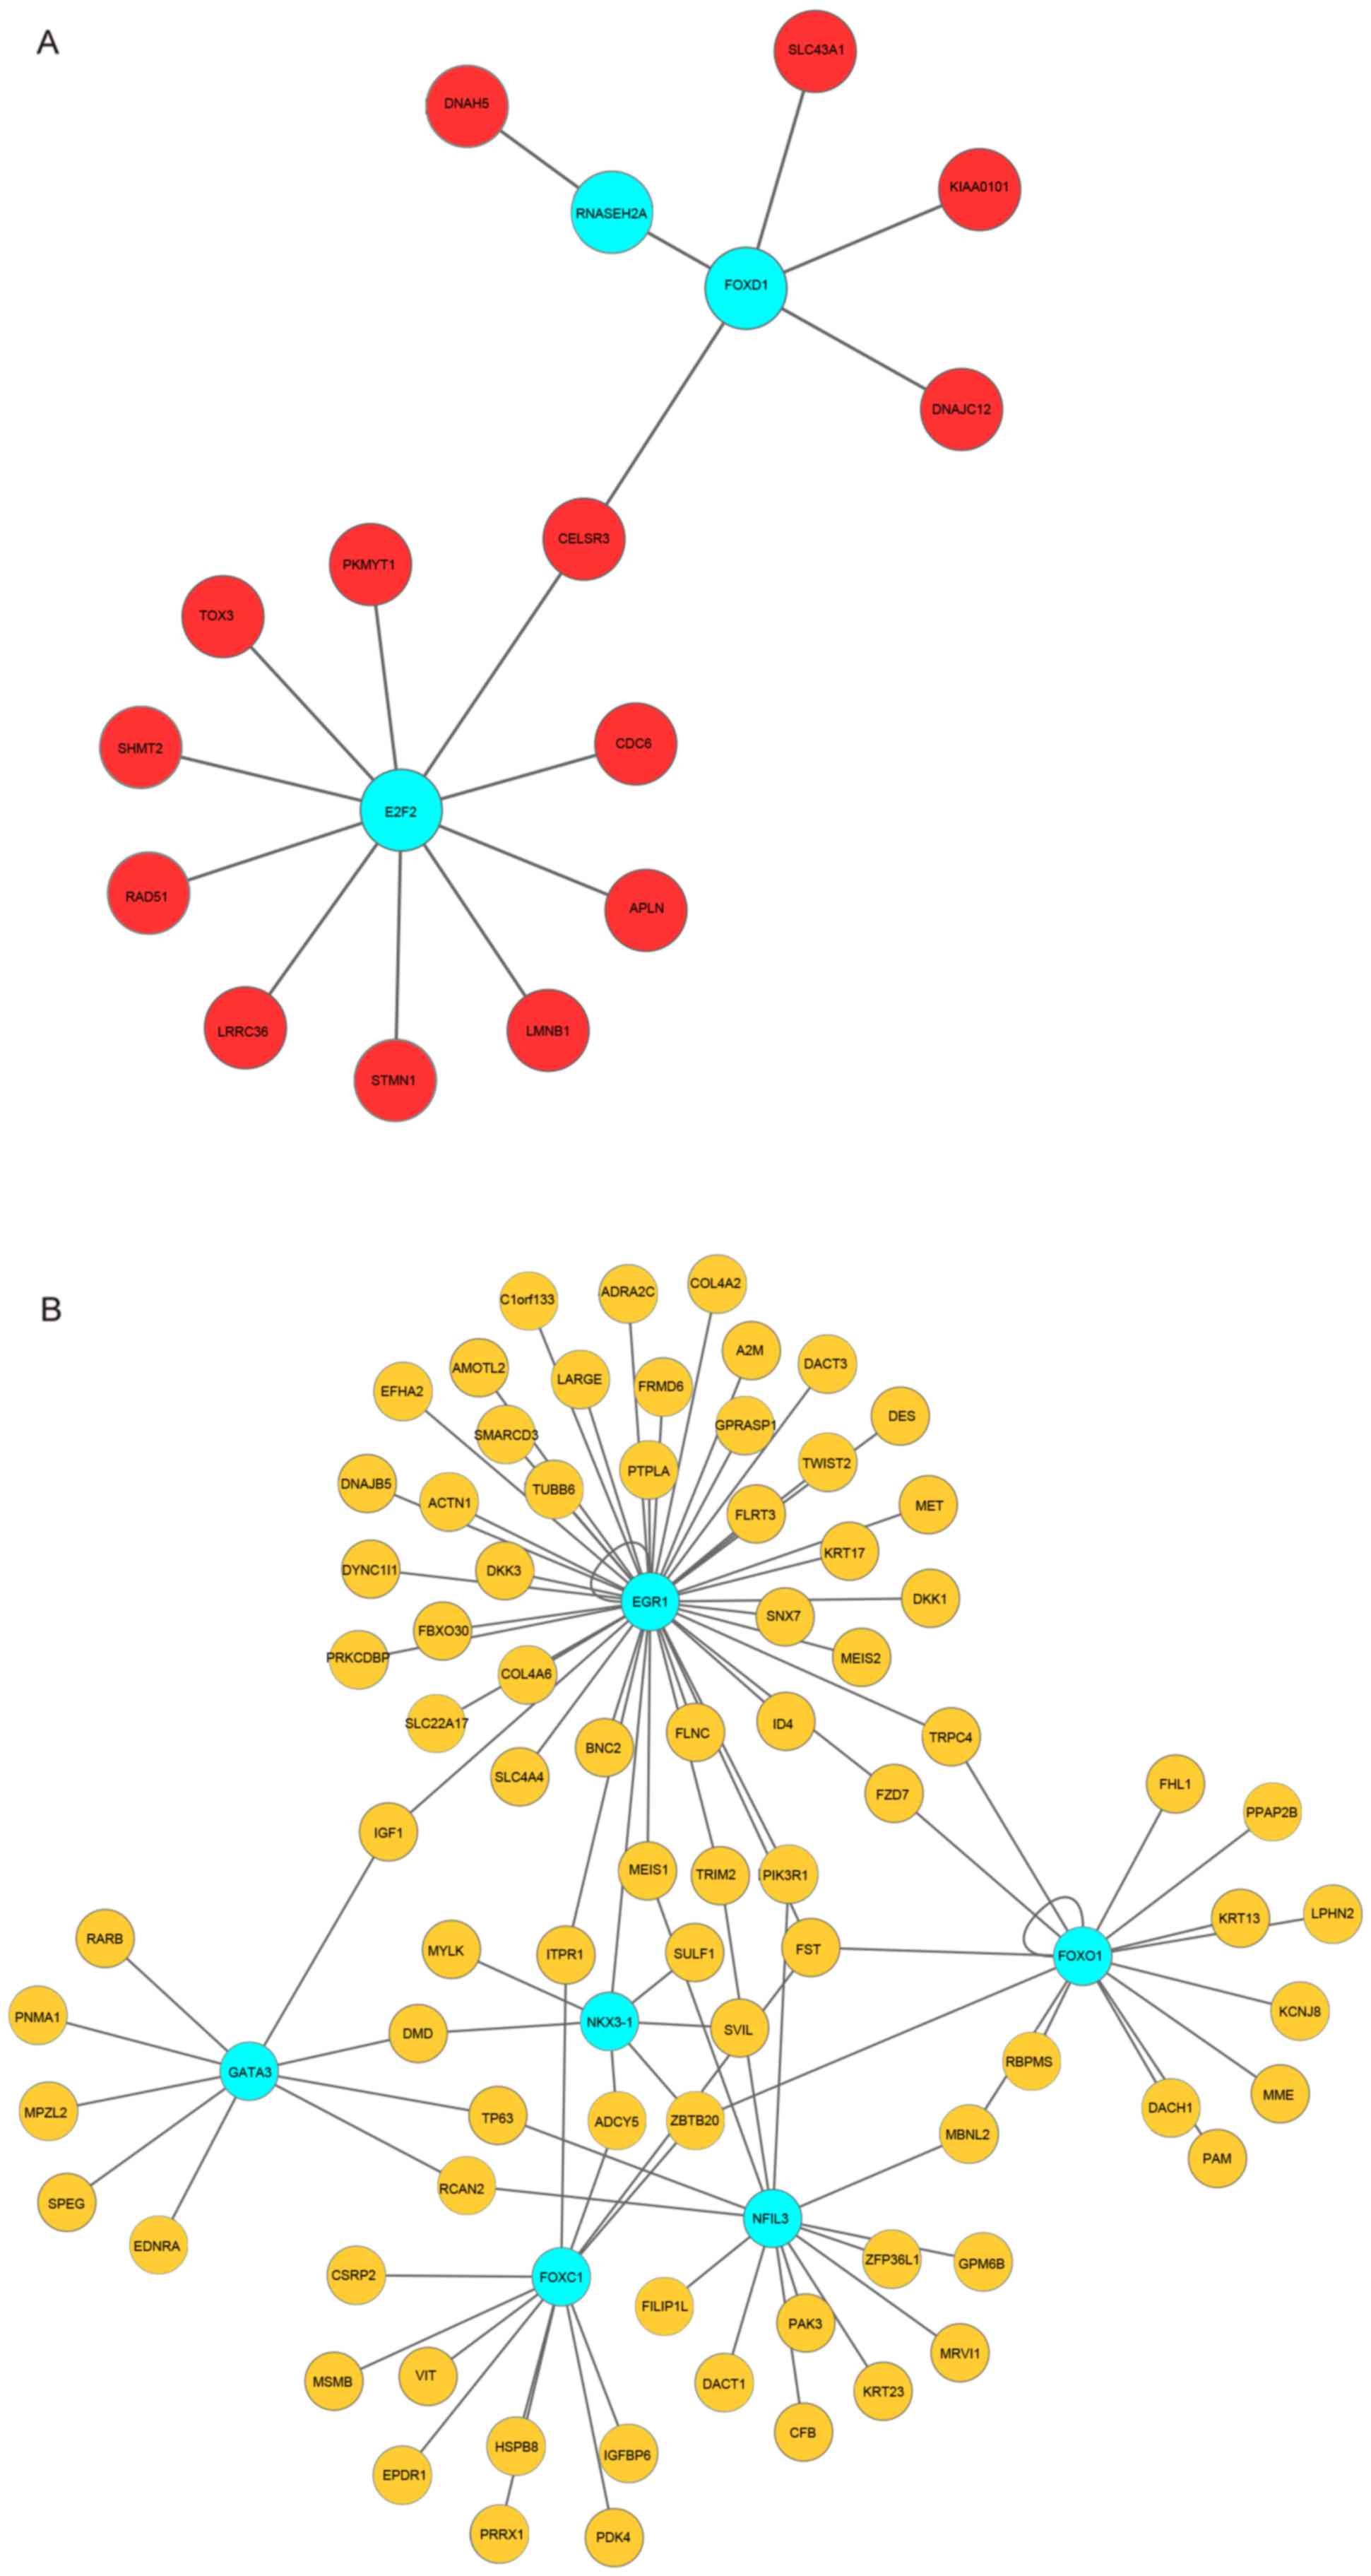
As an important regulatory element, TFs regulate the
expression of certain genes (34). In
the present study, 14 upregulated genes were regulated by three
upregulated TFs, and 10 genes [e.g. cell division cycle 6
(CDC6) and RAD51 recombinase (RAD51)] were regulated
by E2F transcription factor 2 (E2F2) (Fig. 4A). Furthermore, six TFs were predicted
to target the downregulated DEGs. Notably, early growth response 1
(EGR1) regulated a number of downregulated genes and one TF, NK3
homeobox 1, in the downregulated transcriptional regulatory network
(Fig. 4B).
Discussion
Prostate cancer is the most common type of
reproductive system cancer in males (1,2),
particularly in men over 65 years of age. In the present study,
analysis of GSE38241 and GSE3933 gene expression profiles
identified a total of 529 DEGs (129 up- and 400 downregulated DEGs)
between the prostate cancer and normal samples. Integrative
analysis of two microarray data enhanced the reliability of the
present study. Enrichment analysis of the upregulated genes
predicted the cell cycle to be the primary biological process in
the GO function and the KEGG pathway analyses. In addition, focal
adhesion pathway was identified as a significant pathway of
downregulated genes. The results of the present study were
consistent with those of previous studies, which demonstrated that
the cell cycle and focal adhesion are required for the progression
of cancer (35,36).
A total of four genes, consisting of CDCA8,
CDCA5, UBE2C and TK1, exhibited a high degree
of interaction in the upregulated PPI network. All four genes were
involved in cell cycle-associated biological processes and
signaling pathways. In the sub-network, CDCA8 interacted
with pituitary tumor-transforming gene-1 (PTTG1), which was
upregulated in prostate cancer. There is evidence that knockdown of
PTTG1 suppresses the proliferation and invasive potential of
prostate cancer cells (37).
Therefore, it was hypothesized that CDCA8 may be used as a
target for prostate cancer treatment, and that the interaction
between CDCA8 and PTTG1 may have a role in the
progression of prostate cancer. In addition, UBE2C belongs
to the ubiquitin-conjugating enzyme family and participates in the
process of cell mitosis (38). A
previous study identified that UBE2C, as an androgen
receptor target gene, was involved in the progression of prostate
cancer (39). Furthermore,
serological TK1 protein concentration was used as a reliable
marker for the risk assessment of pre/early cancerous progression
(40). However, to the best of our
knowledge, there is no evidence that TK1 is a target for
cancer treatment. It was hypothesized that CDCA8,
CDCA5, UBE2C and TK1 may be associated with
the progression of prostate cancer, and these genes were expected
to be used as potential treatment targets for prostate cancer.
Limited information is known about the roles and underlying
molecular mechanisms of these four genes in prostate cancer;
therefore, the present study may provide novel insights into the
study of treatment targets for prostate cancer.
In addition to the hub genes in the PPI network, TFs
targeting DEGs were identified on the basis of the transcriptional
regulatory network analysis. TFs are well known to regulate the
transcription of a number of genes involved in distinct signaling
pathways and biological processes (34). In the present study, the upregulated
TF, E2F2, and the downregulated TF EGR1 regulated a number of DEGs.
E2F2 regulates genes by binding the target sequence 5′-TTTSSCGC-3′
(S=C/G) (41). In the transcriptional
regulatory network, DEGs, including CDC6 and RAD51,
which contain the aforementioned sequence, may be bound by E2F2
(42). CDC6 is a protein that is
required for the initiation of DNA replication and has been
previously identified to be deregulated in prostate cancer
(43). RAD51, a protein that
catalyzes DNA repair via homologous recombination, is highly
expressed in cancer cells (44).
Additionally, overexpression of E2F2 leads to uncontrolled
proliferation of ovarian cancer cells (45) and EGR1 regulates gene expression by
binding the target sequence 5′-GCGC(G/T)GGGCG-3′ (46). The downregulated gene Dickkopf WNT
Signaling Pathway Inhibitor 3 (DKK3) contained this sequence
and was predicted to be regulated by EGR1. DKK3 promotes the
proliferation and differentiation of fibroblasts and has a function
in the pathogenic stromal remodeling of prostate cancer (47). Therefore, the TFs, E2F2 and EGR1, may
have marked roles in the progression of prostate cancer.
The cell cycle signaling pathway may be closely
associated with prostate cancer. A total of four genes
(CDCA8, CDCA5, UBE2C and TK1) and two
TFs (E2F2 and EGR1) were selected, and may have important roles in
the progression of prostate cancer. The selected DEGs and TFs may
be used as target genes for the treatment of prostate cancer and,
although they were identified using bioinformatics, the specific
roles and underlying molecular mechanisms in prostate cancer
require further confirmation.
References
|
1
|
Bosetti C, Bertuccio P, Chatenoud L, Negri
E, La Vecchia C and Levi F: Trends in mortality from urologic
cancers in Europe, 1970–2008. Eur Urol. 60:1–15. 2011. View Article : Google Scholar : PubMed/NCBI
|
|
2
|
Chung BH: The role of radical
prostatectomy in high-risk prostate cancer. Prostate Int. 1:95–101.
2013. View Article : Google Scholar : PubMed/NCBI
|
|
3
|
Siegel RL, Miller KD and Jemal A: Cancer
statistics, 2016. CA Cancer J Clin. 66:7–30. 2016. View Article : Google Scholar : PubMed/NCBI
|
|
4
|
Dell'Oglio P, Karnes RJ, Joniau S, Spahn
M, Gontero P, Tosco L, Fossati N, Kneitz B, Chlosta P and Graefen
M: Very long-term survival patterns of young patients treated with
radical prostatectomy for high-risk prostate cancer. Urol Oncol.
34:234. e13–9. 2016.
|
|
5
|
Saad F and Miller K: Treatment options in
castration-resistant prostate cancer: Current therapies and
emerging docetaxel-based regimens. Urol Oncol. 32:70–79. 2014.
View Article : Google Scholar : PubMed/NCBI
|
|
6
|
Thomsen FB, Brasso K, Klotz LH, Røder MA,
Berg KD and Iversen P: Active surveillance for clinically localized
prostate cancer-a systematic review. J Surg Oncol. 109:830–835.
2014. View Article : Google Scholar : PubMed/NCBI
|
|
7
|
Cole G, McCaffrey J, Ali AA and McCarthy
HO: DNA vaccination for prostate cancer: Key concepts and
considerations. Cancer Nanotechnol. 6:22015. View Article : Google Scholar : PubMed/NCBI
|
|
8
|
Cross D and Burmester JK: Gene therapy for
cancer treatment: Past, present and future. Clin Med Res. 4:218–27.
2006. View Article : Google Scholar : PubMed/NCBI
|
|
9
|
van Asperen CJ, Brohet RM,
Meijers-Heijboer EJ, Hoogerbrugge N, Verhoef S, Vasen HF, Ausems
MG, Menko FH, Garcia Gomez EB and Klijn JG: Cancer risks in BRCA2
families: Estimates for sites other than breast and ovary. J Med
Genet. 42:711–719. 2005. View Article : Google Scholar : PubMed/NCBI
|
|
10
|
Leongamornlert D, Mahmud N, Tymrakiewicz
M, Saunders E, Dadaev T, Castro E, Goh C, Govindasami K, Guy M and
O'Brien L: Germline BRCA1 mutations increase prostate cancer risk.
Br J Cancer. 106:1697–1701. 2012. View Article : Google Scholar : PubMed/NCBI
|
|
11
|
Khandrika L, Kumar B, Koul S, Maroni P and
Koul HK: Oxidative stress in prostate cancer. Cancer Lett.
282:125–136. 2009. View Article : Google Scholar : PubMed/NCBI
|
|
12
|
Campaner S and Amati B: Two sides of the
Myc-induced DNA damage response: From tumor suppression to tumor
maintenance. Cell Div. 7:62012. View Article : Google Scholar : PubMed/NCBI
|
|
13
|
Toren P and Zoubeidi A: Targeting the
PI3K/Akt pathway in prostate cancer: Challenges and opportunities
(review). Int J Oncol. 45:1793–1801. 2014. View Article : Google Scholar : PubMed/NCBI
|
|
14
|
Ngalame NN, Tokar EJ, Person RJ, Xu Y and
Waalkes MP: Aberrant microRNA expression likely controls RAS
oncogene activation during malignant transformation of human
prostate epithelial and stem cells by arsenic. Toxicol Sci.
138:268–277. 2014. View Article : Google Scholar : PubMed/NCBI
|
|
15
|
Varambally S, Dhanasekaran SM, Zhou M,
Barrette TR, Kumar-Sinha C, Sanda MG, Ghosh D, Pienta KJ, Sewalt RG
and Otte AP: The polycomb group protein EZH2 is involved in
progression of prostate cancer. Nature. 419:624–629. 2002.
View Article : Google Scholar : PubMed/NCBI
|
|
16
|
Conesa-Zamora P, García-Solano J,
García-García F, Mdel Turpin C, Trujillo-Santos J, Torres-Moreno D,
Oviedo-Ramírez I, Carbonell-Muñoz R, Muñoz-Delgado E and
Rodriguez-Braun E: Expression profiling shows differential
molecular pathways and provides potential new diagnostic biomarkers
for colorectal serrated adenocarcinoma. Int J Cancer. 132:297–307.
2013. View Article : Google Scholar : PubMed/NCBI
|
|
17
|
Wu C, Zhu J and Zhang X: Network-based
differential gene expression analysis suggests cell cycle related
genes regulated by E2F1 underlie the molecular difference between
smoker and non-smoker lung adenocarcinoma. BMC Bioinformatics.
14:3652013. View Article : Google Scholar : PubMed/NCBI
|
|
18
|
Li Y, Vongsangnak W, Chen L and Shen B:
Integrative analysis reveals disease-associated genes and
biomarkers for prostate cancer progression. BMC Med Genomics. 7
(Suppl 1):S32014. View Article : Google Scholar : PubMed/NCBI
|
|
19
|
Aryee MJ, Liu W, Engelmann JC, Nuhn P,
Gurel M, Haffner MC, Esopi D, Irizarry RA, Getzenberg RH and Nelson
WG: DNA methylation alterations exhibit intraindividual stability
and interindividual heterogeneity in prostate cancer metastases.
Sci Transl Med. 5:169ra102013. View Article : Google Scholar : PubMed/NCBI
|
|
20
|
Lapointe J, Li C, Higgins JP, van de Rijn
M, Bair E, Montgomery K, Ferrari M, Egevad L, Rayford W and
Bergerheim U: Gene expression profiling identifies clinically
relevant subtypes of prostate cancer. Proc Natl Acad Sci USA.
101:811–816. 2004. View Article : Google Scholar : PubMed/NCBI
|
|
21
|
Johnson WE, Li C and Rabinovic A:
Adjusting batch effects in microarray expression data using
empirical Bayes methods. Biostatistics. 8:118–127. 2007. View Article : Google Scholar : PubMed/NCBI
|
|
22
|
Leek JT and Storey JD: A general framework
for multiple testing dependence. Proc Natl Acad Sci USA.
105:18718–18723. 2008. View Article : Google Scholar : PubMed/NCBI
|
|
23
|
Ritchie ME, Phipson B, Wu D, Hu Y, Law CW,
Shi W and Smyth GK: limma powers differential expression analyses
for RNA-sequencing and microarray studies. Nucleic Acids Res.
43:e472015. View Article : Google Scholar : PubMed/NCBI
|
|
24
|
Pounds S and Morris SW: Estimating the
occurrence of false positives and false negatives in microarray
studies by approximating and partitioning the empirical
distribution of P-values. Bioinformatics. 19:1236–1242. 2003.
View Article : Google Scholar : PubMed/NCBI
|
|
25
|
Shoop E, Casaes P, Onsongo G, Lesnett L,
Petursdottir EO, Donkor EK, Tkach D and Cosimini M: Data
exploration tools for the gene ontology database. Bioinformatics.
20:3442–3454. 2004. View Article : Google Scholar : PubMed/NCBI
|
|
26
|
Kanehisa M, Goto S, Kawashima S, Okuno Y
and Hattori M: The KEGG resource for deciphering the genome.
Nucleic Acids Res. 32:D277–280. 2004. View Article : Google Scholar : PubMed/NCBI
|
|
27
|
da Huang W, Sherman BT and Lempicki RA:
Systematic and integrative analysis of large gene lists using DAVID
bioinformatics resources. Nature Protoc. 4:44–57. 2009. View Article : Google Scholar
|
|
28
|
da Huang W, Sherman BT and Lempicki RA:
Bioinformatics enrichment tools: Paths toward the comprehensive
functional analysis of large gene lists. Nucleic Acids Res.
37:1–13. 2009. View Article : Google Scholar : PubMed/NCBI
|
|
29
|
Franceschini A, Szklarczyk D, Frankild S,
Kuhn M, Simonovic M, Roth A, Lin J, Minguez P, Bork P, von Mering C
and Jensen LJ: STRING v9.1: Protein-protein interaction networks,
with increased coverage and integration. Nucleic Acids Res.
41:D808–D815. 2013. View Article : Google Scholar : PubMed/NCBI
|
|
30
|
Kohl M, Wiese S and Warscheid B:
Cytoscape: Software for visualization and analysis of biological
networks. Methods Mol Biol. 696:291–303. 2011. View Article : Google Scholar : PubMed/NCBI
|
|
31
|
Albert R, Albert I and Nakarado GL:
Structural vulnerability of the North American power grid. Physical
Review E. 69:0251032004. View Article : Google Scholar
|
|
32
|
Bader GD and Hogue CW: An automated method
for finding molecular complexes in large protein interaction
networks. BMC Bioinformatics. 4:22003. View Article : Google Scholar : PubMed/NCBI
|
|
33
|
Matys V, Kel-Margoulis OV, Fricke E,
Liebich I, Land S, Barre-Dirrie A, Reuter I, Chekmenev D, Krull M
and Hornischer K: TRANSFAC and its module TRANSCompel:
Transcriptional gene regulation in eukaryotes. Nucleic Acids Res.
34:D108–110. 2006. View Article : Google Scholar : PubMed/NCBI
|
|
34
|
Chen K and Rajewsky N: The evolution of
gene regulation by transcription factors and microRNAs. Nat Rev
Genet. 8:93–103. 2007. View
Article : Google Scholar : PubMed/NCBI
|
|
35
|
Seong J, Wang N and Wang Y:
Mechanotransduction at focal adhesions: From physiology to cancer
development. J Cell Mol Med. 17:597–604. 2013. View Article : Google Scholar : PubMed/NCBI
|
|
36
|
Fu LJ and Wang B: Investigation of the hub
genes and related mechanism in ovarian cancer via bioinformatics
analysis. J Ovarian Res. 6:922013. View Article : Google Scholar : PubMed/NCBI
|
|
37
|
Huang SQ, Liao QJ, Wang XW, Xin DQ, Chen
SX, Wu QJ and Ye G: RNAi-mediated knockdown of pituitary
tumor-transforming gene-1 (PTTG1) suppresses the proliferation and
invasive potential of PC3 human prostate cancer cells. Braz J Med
Biol Res. 45:995–1001. 2012. View Article : Google Scholar : PubMed/NCBI
|
|
38
|
Summers MK, Pan B, Mukhyala K and Jackson
PK: The unique N terminus of the UbcH10 E2 enzyme controls the
threshold for APC activation and enhances checkpoint regulation of
the APC. Mol Cell. 31:544–556. 2008. View Article : Google Scholar : PubMed/NCBI
|
|
39
|
Chen Z, Zhang C, Wu D, Chen H, Rorick A,
Zhang X and Wang Q: Phospho-MED1-enhanced UBE2C locus looping
drives castration-resistant prostate cancer growth. EMBO J.
30:2405–2419. 2011. View Article : Google Scholar : PubMed/NCBI
|
|
40
|
Huang S, Lin J, Guo N, Zhang M, Yun X, Liu
S, Zhou J, He E and Skog S: Elevated serum thymidine kinase 1
predicts risk of pre/early cancerous progression. Asian Pac J
Cancer Prev. 12:497–505. 2011.PubMed/NCBI
|
|
41
|
Slansky JE and Farnham PJ: Introduction to
the E2F family: Protein structure and gene regulation. Curr Top
Microbiol Immunol. 208:1–30. 1996.PubMed/NCBI
|
|
42
|
Bracken AP, Ciro M, Cocito A and Helin K:
E2F target genes: Unraveling the biology. Trends Biochem Sci.
29:409–417. 2004. View Article : Google Scholar : PubMed/NCBI
|
|
43
|
Liu Y, Gong Z, Sun L and Li X: FOXM1 and
androgen receptor co-regulate CDC6 gene transcription and DNA
replication in prostate cancer cells. Biochim Biophys Acta.
1839:297–305. 2014. View Article : Google Scholar : PubMed/NCBI
|
|
44
|
Mason JM, Logan HL, Budke B, Wu M,
Pawlowski M, Weichselbaum RR, Kozikowski AP, Bishop DK and Connell
PP: The RAD51-stimulatory compound RS-1 can exploit the RAD51
overexpression that exists in cancer cells and tumors. Cancer Res.
74:3546–3555. 2014. View Article : Google Scholar : PubMed/NCBI
|
|
45
|
Reimer D, Sadr S, Wiedemair A, Concin N,
Hofstetter G, Marth C and Zeimet AG: Heterogeneous cross-talk of
E2F family members is crucially involved in growth modulatory
effects of interferon-gamma and EGF. Cancer Biol Ther. 5:771–776.
2006. View Article : Google Scholar : PubMed/NCBI
|
|
46
|
Liu C, Rangnekar VM, Adamson E and Mercola
D: Suppression of growth and transformation and induction of
apoptosis by EGR-1. Cancer Gene Ther. 5:3–28. 1998.PubMed/NCBI
|
|
47
|
Zenzmaier C, Sampson N, Plas E and Berger
P: Dickkopf-related protein 3 promotes pathogenic stromal
remodeling in benign prostatic hyperplasia and prostate cancer.
Prostate. 73:1441–1452. 2013. View Article : Google Scholar : PubMed/NCBI
|