Introduction
Uterine leiomyomata (UL), a benign neoplasm deriving
from the myometrial compartment of the uterus, is the most
widespread gynecological problem in females (1). The common symptoms associated with UL
are pelvic pain, discomfort, menstrual disorders and infertility
(2). Surgery is the primary treatment
modality, and tumors are often resistant to chemotherapy and
radiation therapy (3). To date,
adjuvant therapy has not demonstrated a significant survival
advantage (3). Although surgical
staging and nomograms may assist in predicting clinical outcome,
the 5-year survival rate for uterus-confined disease remains
<50% (4). Understanding the
molecular biology of UL may provide additional prognostic and
therapeutic insights.
With the advances of high-throughput experimental
technologies, these have been applied to explore the diagnostic
gene signatures and biological processes of human diseases
(5), which provide novel insights
into the underlying biological mechanisms of UL. Microarray
experiments have revealed that fibroid development may be due to
abnormal tissue repair and an altered extracellular matrix
(6). The levels of the inflammatory
cytokine transforming growth factor-β (TGF-β) were increased 3-fold
in fibroid tissue relative to myometrium (7,8). However,
a number of investigations on UL pathogenesis lack physiological
relevance due to these studies being solely based on a number of
individual genes and cell lines (9).
Molecular pathways underlying UL development and growth
acceleration are largely unknown, and the majority of previous
results have stemmed from studying recurrent cytogenetic
abnormalities identified among the 40% of abnormal UL (10), and gene expression profiles may be an
additional good choice for research.
A variety of methods have been developed for the
analysis of gene expression microarray data, but a small number of
methods exist for using these data to quantify the interrelated
behavior of genes within a gene interaction network (11). Even though the incidence of tumor is
hypothesized to be closely associated with the abnormal expression
of numerous genes, the studies on differential expressed genes
(DEGs) is inadequate and there is a lot of work required to fully
realize the potential of these DEGs. Therefore, studies
investigating gene interactions are essential, as these
interactions serve important roles in biological processes for
cancer development (12). Previously,
network-based approaches utilizing information concerning the
interactions between gene pairs have emerged as powerful tools for
the systematic understanding of the molecular mechanisms underlying
biological processes important for cancer development, and several
algorithms have been developed to study these biological networks.
Barter et al (13) performed a
comparative analysis and identified that the network-based method
was more stable compared with single-gene and gene-set methods.
However, there are a small number of studies identifying
differential pathways dependent on network-based approaches
(11,14).
Therefore, in the present study, a novel method to
identify differential pathways in UL based on gene interaction
networks and pathway analysis was proposed. To achieve this, the
primary step was to construct networks (Pathway, Objective and Hub
networks), and analyzed their topological properties. Subsequently,
the intersections between Pathway and Objective networks, and
between Pathway and Hub networks, were isolated and randomization
tests were performed to identify differential pathways in UL. This
novel method may be an efficient supplement for identifying
differential pathways.
Materials and methods
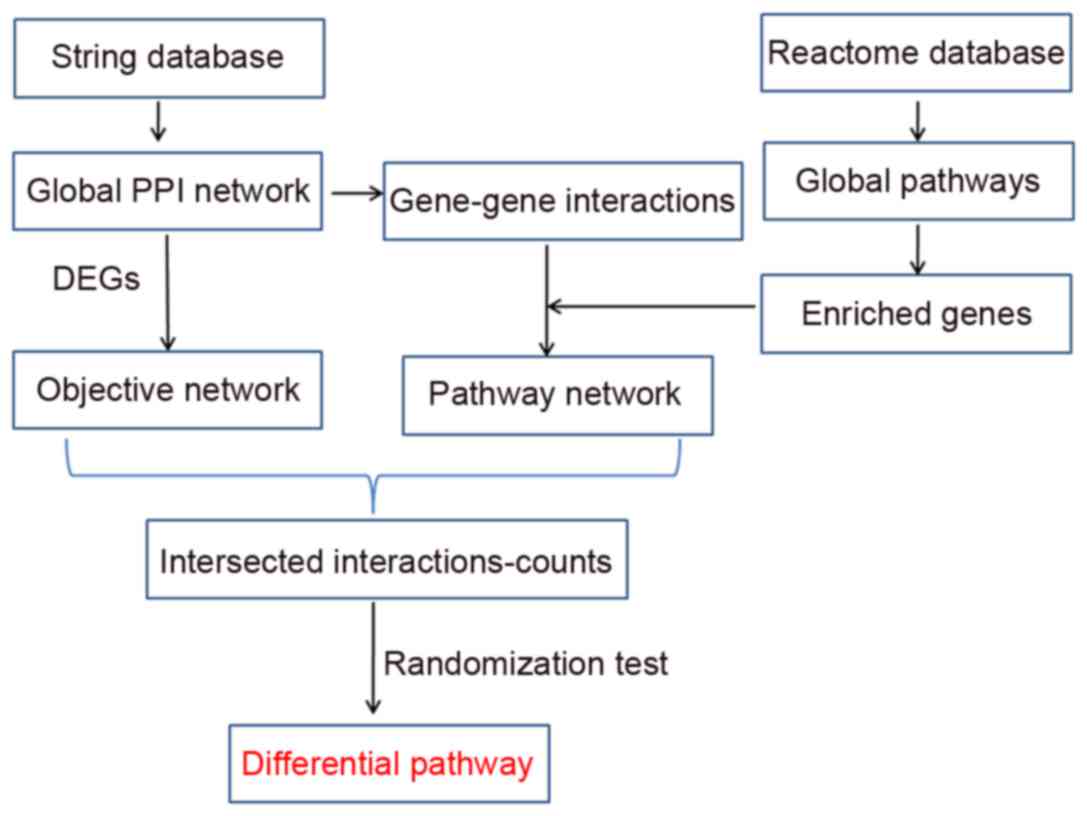
The primary component of this novel method consisted
of Pathway network identification, Objective network construction,
Hub network extraction and differential pathway evaluation. This
method used to identify differential pathways is presented in
Fig. 1.
Pathway network identification
Networks may provide new insights for mining unknown
connections in incomplete networks. Although the data of
large-scale protein interactions are accumulated with the
development of high throughput testing technology, a certain number
of significant interactions are not tested (14). This type of difficulty may be resolved
to a certain extent by utilizing sub-networks of the complex
network (15). Therefore, in the
present study, pathway networks were identified by exploring the
interactions of pathway-enriched genes with the global human
protein-protein interaction (PPI) network from the Search Tool for
the Retrieval of Interacting Genes/proteins (STRING) database
(string-db.org; accessed August 24, 2015)
(16). The pathway enriched genes
originated from the Reactome pathway database (reactome.org; accessed July 13, 2015), which is a
manually curated open-data resource of human pathways and reactions
(17).
Objective network construction
Data collection and pretreatment
A total of two gene expression profiles
[E-GEOD-18096 (18) and E-GEOD-64763
(19)] for UL and normal controls
were collected from ArrayExpress database (http://www.ebi.ac.uk/arrayexpress/). E-GEOD-18096,
which presented on the A-AFFY-44-Affymetrix GeneChip Human Genome
U133 Plus 2.0 (HG-U133_Plus_2) platform, comprised 18 Ul samples
and 9 normal controls. E-GEOD-64763 existed on the
A-AFFY-37-Affymetrix GeneChip Human Genome U133A 2.0 [HG-U133A_2]
platform and consisted of 25 Ul samples and 29 normal controls. In
all, there were a total of 43 Ul samples and 38 normal controls in
the two gene expression profiles.
Pretreatment for microarray expressions was
performed to control the quality at probe level. The preprocess
included four standard procedures: i) Background correction
(20); ii) normalization (21); iii) probe correction (22); and iv) summarization (20). The preprocessed probe-level dataset in
CEL formats were converted into expression measures, and then
screened by the feature filter method of gene filter package
(23). Finally, a total of 20,102 and
12,493 genes were obtained from the E-GEOD-18096 and E-GEOD-64763
profiles, respectively. Subsequently, the empirical Bayes method in
inSilicoMerging package version 1.15.0 was utilized to merge the
two preprocessed gene expression profiles into a single group
(24) which included 12,493 genes for
additional analysis.
DEGs detection
DEGs between UL and normal controls were identified
using the linear models for microarray data (Limma) package version
3.30.0 (University of California, Berkeley, CA, USA) (25). All genes were manipulated with t test
and F test, and then Linear fit, empirical Bayes statistics and
false discovery rate correction were performed to the data by using
lmFit function (26). DEGs were
identified for additional study with the threshold of P<0.05 and
|logFoldChange|>2.
Objective network construction
Certain significant genes may not be identifiable
through their own behavior, but their changes are quantifiable when
considered in conjunction with other genes, such as in a network
(27). In the present study, a human
PPI dataset from STRING as utilized to capture interactions among
DEGs. The interactions were visualized by Cytoscape version 3.1.0
(Institute for Systems Biology, San Diego, CA, USA), and a PPI
network was formed, which was defined as the Objective network.
Cytoscape is a free software package for visualizing, modeling and
analyzing the integration of bimolecular interaction networks with
high-throughput expression data and other molecular states
(28).
Hub network extraction
One of the fundamental problems in network analysis
is to determine the importance of a particular node or an
interaction between two nodes in a network, and quantifying
centrality and connectivity assists in identifying portions of the
network that may serve notable roles (29). In the present study, the biological
importance of genes was characterized based on the Objective
network using indices of topological centrality, degree centrality.
The genes at the ≥97% quantile distribution in the significantly
perturbed networks were defined as hub genes. In addition, the
network, which was composed of hub genes and their interactions,
was denoted as a hub network.
‘Degree’ quantifies the local topology of each gene
by summing up the number of its adjacent genes (j), and
provides a simple count of the number of interactions of a given
node (30). The degree
CD(v) of a node v was calculated as
following:
CD(v)=∑javj
In addition, the association between the number of
genes and degree distribution was analyzed, and the fitting
coefficient R2 of the power-law of the Objective network
was detected, due to the fact that PPI networks in general are
modular and scale-free, which meant that the network exhibited
power-law (or scale-free) degree distributions (31,32). The
Network Analyzer 2.7 (Institute for Systems Biology) plugin in
Cytoscape 3.1.0 was used for the evaluation of the topological
parameters.
Differential pathways evaluation
The pathway, objective and hub networks were
constructed, but selecting differential pathways based on the three
kinds of networks was challenging. To overcome the problem, the
intersections of the interactions between the Pathway and Objective
networks, and between the Pathway and Hub networks were identified,
and the quantity of intersected interactions was denoted as a
‘count’. Subsequently, randomization tests were employed to
determine the P-value of each pathway from the intersected
interactions.
Randomization tests provide a general means of
constructing tests that control size in finite samples whenever the
distribution of the observed data exhibits symmetry under the null
hypothesis (33). Let
T(X) be a real-valued test statistic such that large
values provide evidence against the null hypothesis. Ordering
T(1)(X)≤T(2)(X)≤···≤T(M)(X),
denoting k=M(1-λ) and define:
M+(X)=|{1≤j≤M:T(j)(X)>T(k)(X)}|
M0(X)=|{1≤j≤M:T(j)(X)=T(k)(X)}|
Using this notation, the randomization tests were
performed according to the following formulas (34):
φ(X)={1ifT(X)>T(k)(X)a(X)ifT(X)=T(k)(X)0ifT(X)<T(k)(X)
Wherea(X)=Mλ–M+(X)M0(X)
For any λ ε (0, 1), φ(X) defined in the
formula satisfied P[φ(X)]=λ. In the present study,
T(X) represented random networks that comprised
intersected interactions, φ(X) stood for each pathway and P
represented the significance of the pathway. If P<0.05, this
pathway was considered to be a differential pathway compared with
normal controls.
Results
Pathway network
There were 787,896 interactions in the human STRING
PPI network, while 1,675 human pathways were identified in the
Reactome database. Interactions between pathway-enriched genes were
extracted from the STRING database. A total of 559,598 gene-gene
interactions were obtained, which formed a Pathway network. The
559,598 interactions may contain reduplicative interactions that
were as a result of repeated enrichments of one interaction; one
interaction was probably enriched in ≥2 pathways.
Objective network construction and
analysis
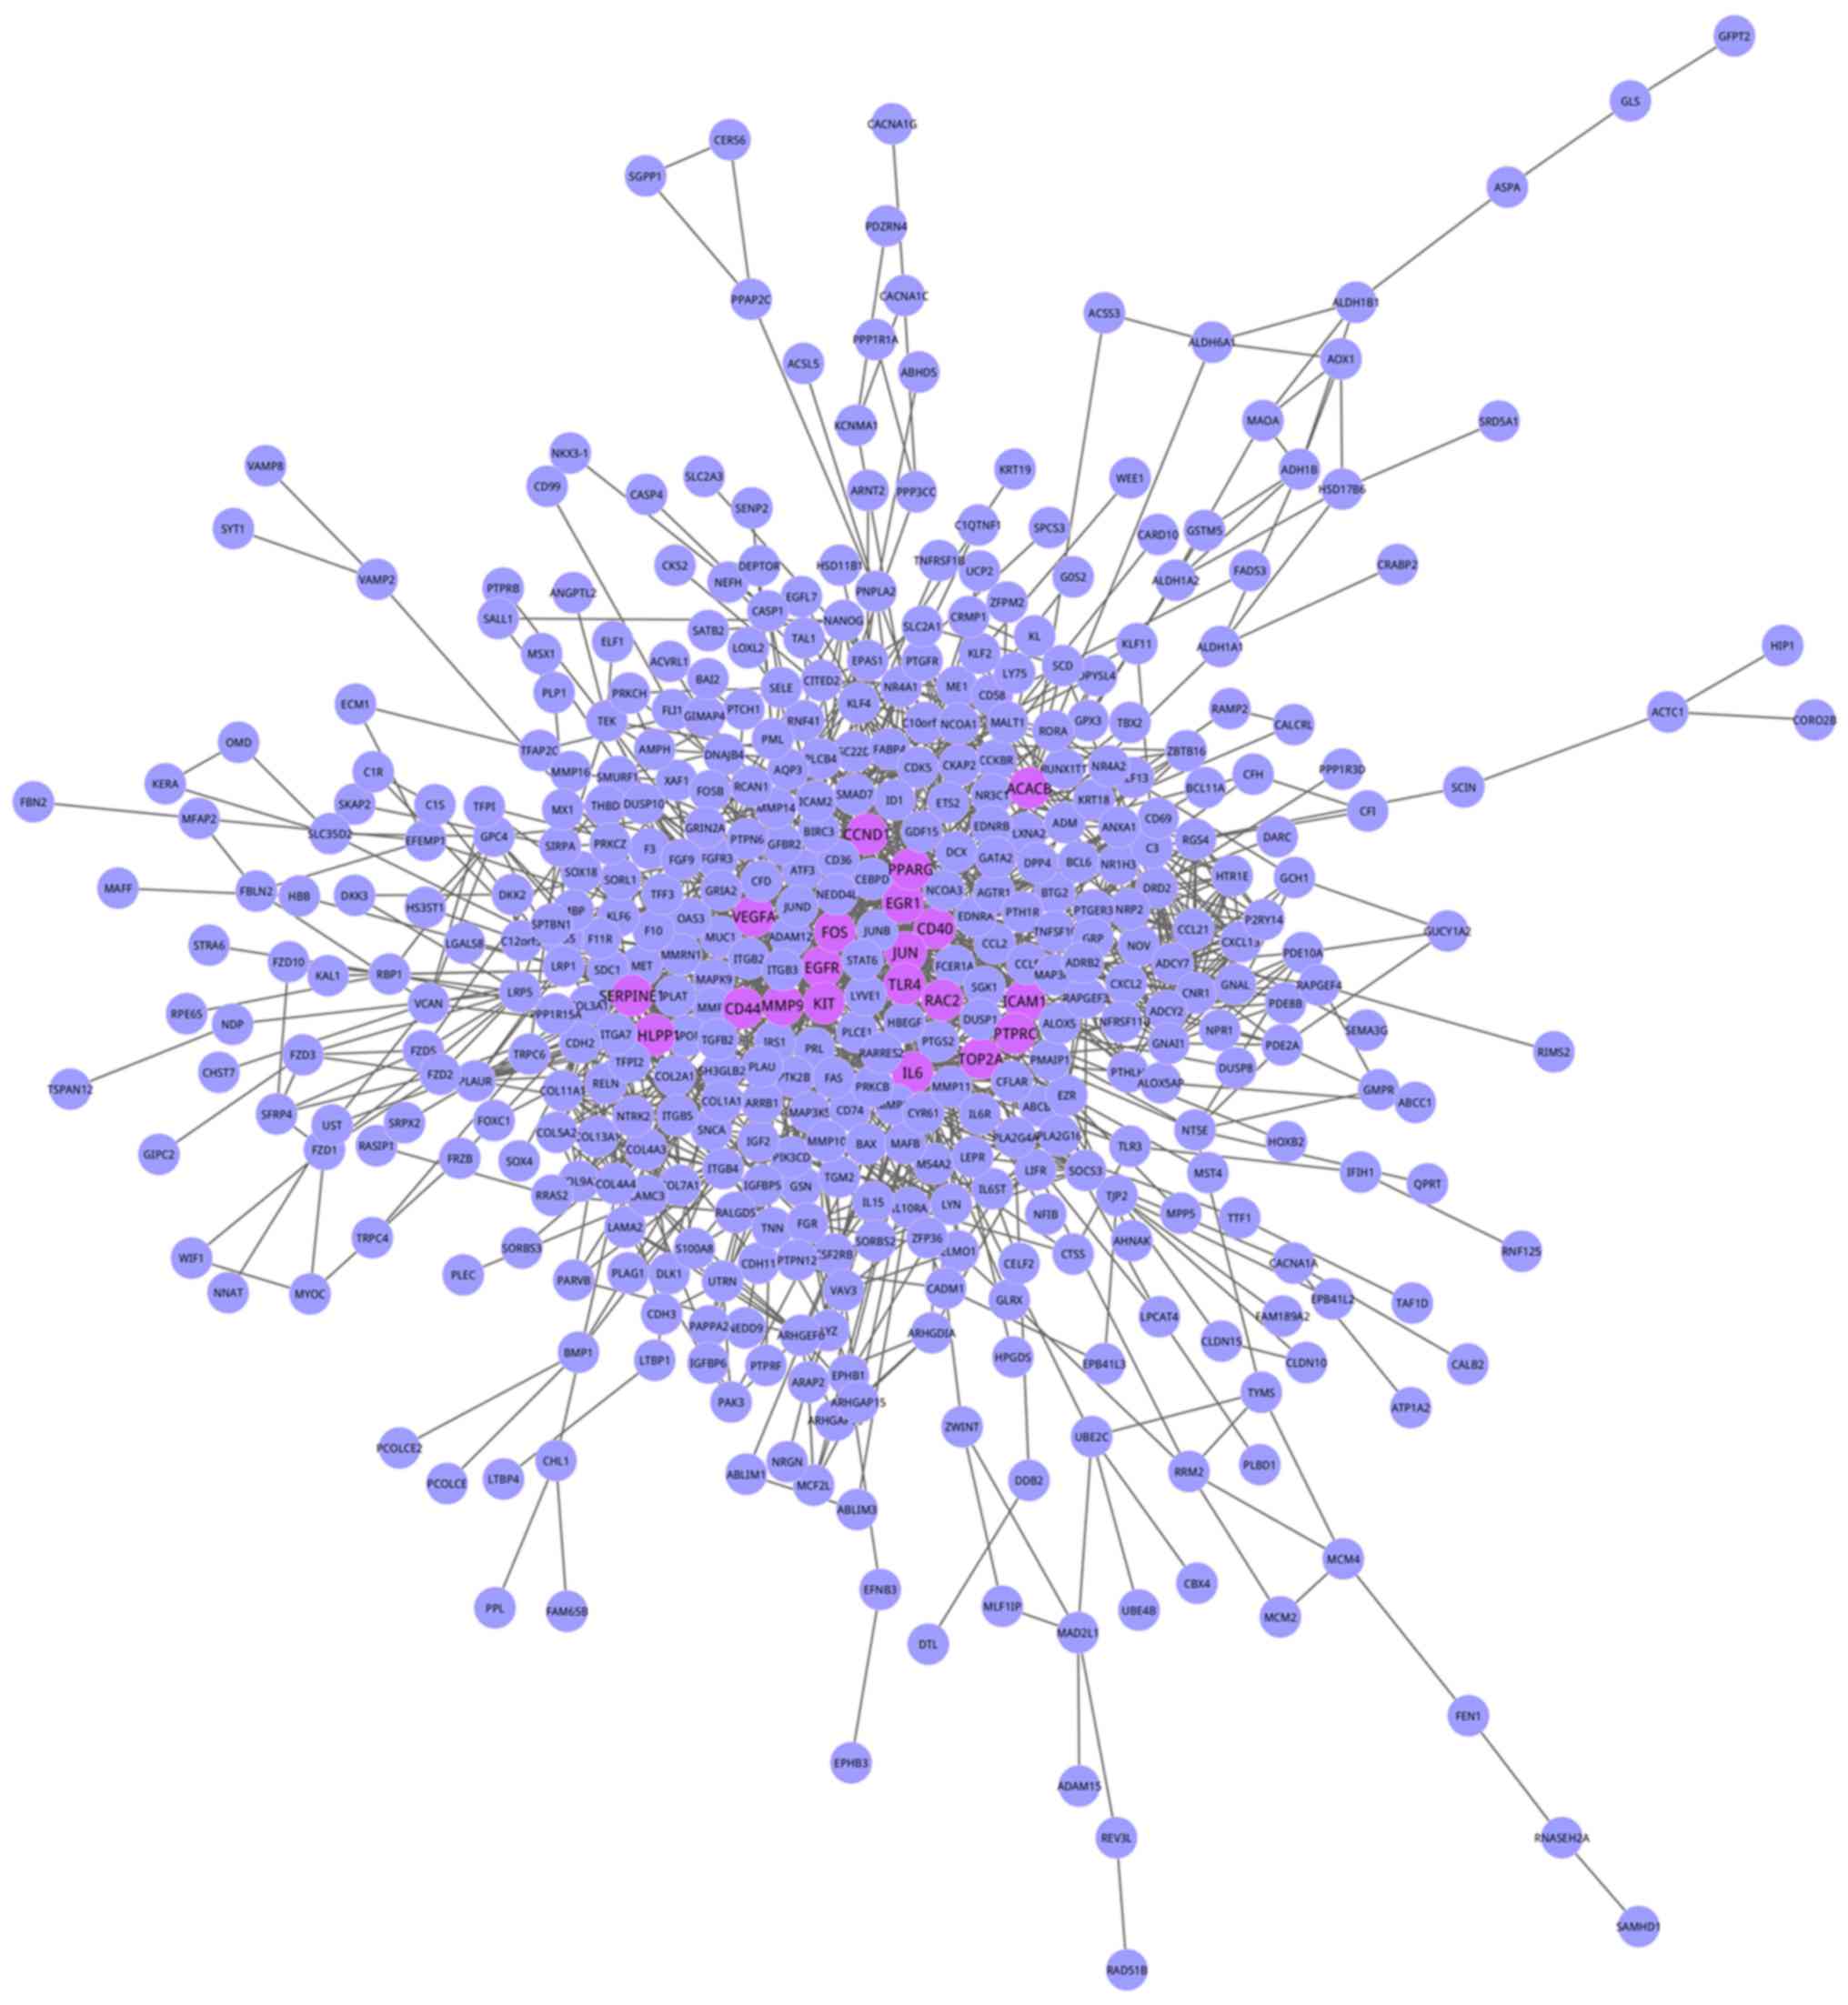
A total of 903 DEGs between patients with UL and
normal controls were identified using the Limma package with
thresholds of P<0.05 and |logFoldChange|>2. When inputting
these DEGs into the STRING database, 3,835 gene-gene interactions
were obtained. Using Cytoscape, 657 genes with 3,835 interactions
were mapped into the Objective network (Fig. 2). To additionally investigate the
importance of individual genes in the bjective network, degree
centrality analysis was conducted, and the degree distribution is
presented in Fig. 3. The network
analysis demonstrated that the Objective network presented a
scale-free property whose degree distribution followed a power law
(y=axb, where a=117.0, b=−0.775) with the fitting
coefficients R2 (R2=0.956).
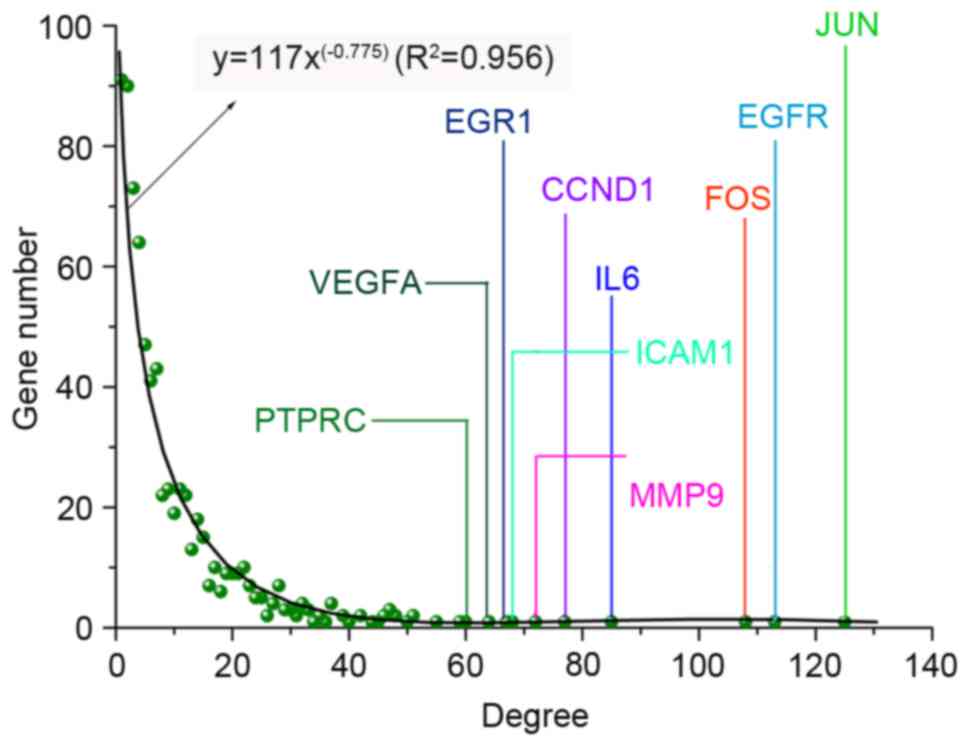 | Figure 3.Gene degree distribution in the
objective network. The objective network was a scale-free network
whose degree distribution followed a power law (y=axb,
where a=117.0, b=−0.775) with the fitting coefficient
(R2=0.956). PHLPP1, PH domain and leucine rich
repeat protein phosphatase 1; VEGFA, vascular endothelial
growth factor A; EGR1, early growth response 1;
CCND1, cyclin D1; IL6, interleukin 6; MMP9,
matrix metalloproteinase 9; ICAM1, intercellular adhesion
molecule 1; FOS, Fos proto-oncogene, AP-1 transcription
factor subunit; EGFR, epidermal growth factor receptor;
JUN, Jun proto-oncogene, AP-1 transcription factor
subunit. |
Hub network extraction
In the present study, the genes in the ≥97% quantile
distribution of ‘degree’ in the Objective network were defined as
hub genes. In addition, the degree was calculated by summing up the
number of adjacent genes. Consequently, a total of 20 hub genes
were evaluated: Jun proto-oncogene, AP-1 transcription factor
subunit (degree=125), epidermal growth factor receptor
(degree=113), Fos proto-oncogene, AP-1 transcription factor subunit
(degree=108), interleukin (IL)-6 (degree=85), cyclin D1
(degree=77), matrix metalloproteinase 9 (degree=72), intercellular
adhesion molecule 1 (degree=68), early growth response 1
(degree=67), vascular endothelial growth factor A (degree=64),
protein tyrosine phosphatase, receptor type C (degree=60), KIT
proto-oncogene receptor tyrosine kinase (degree=59), peroxisome
proliferator activated receptor gamma (degree=55), toll like
receptor 4 (degree=51), topoisomerase (DNA) II α (degree=51),
serpin family E member 1 (degree=50), cluster of differentiation
(CD)44 (degree=48), CD40 (degree=47), Acetyl-CoA
carboxylase β (degree=47), PH domain and leucine rich repeat
protein phosphatase 1 (degree=47) and Ras-related C3 botulinum
toxin substrate 2 (Rho family, small GTP binding protein Rac2)
(degree=47). The network, which was composed of hub genes and their
interactions, was denoted as the Hub network, which was also the
sub-network of the Objective network. Fig. 4 was the largest of the Hub networks,
which included 10 hub genes.
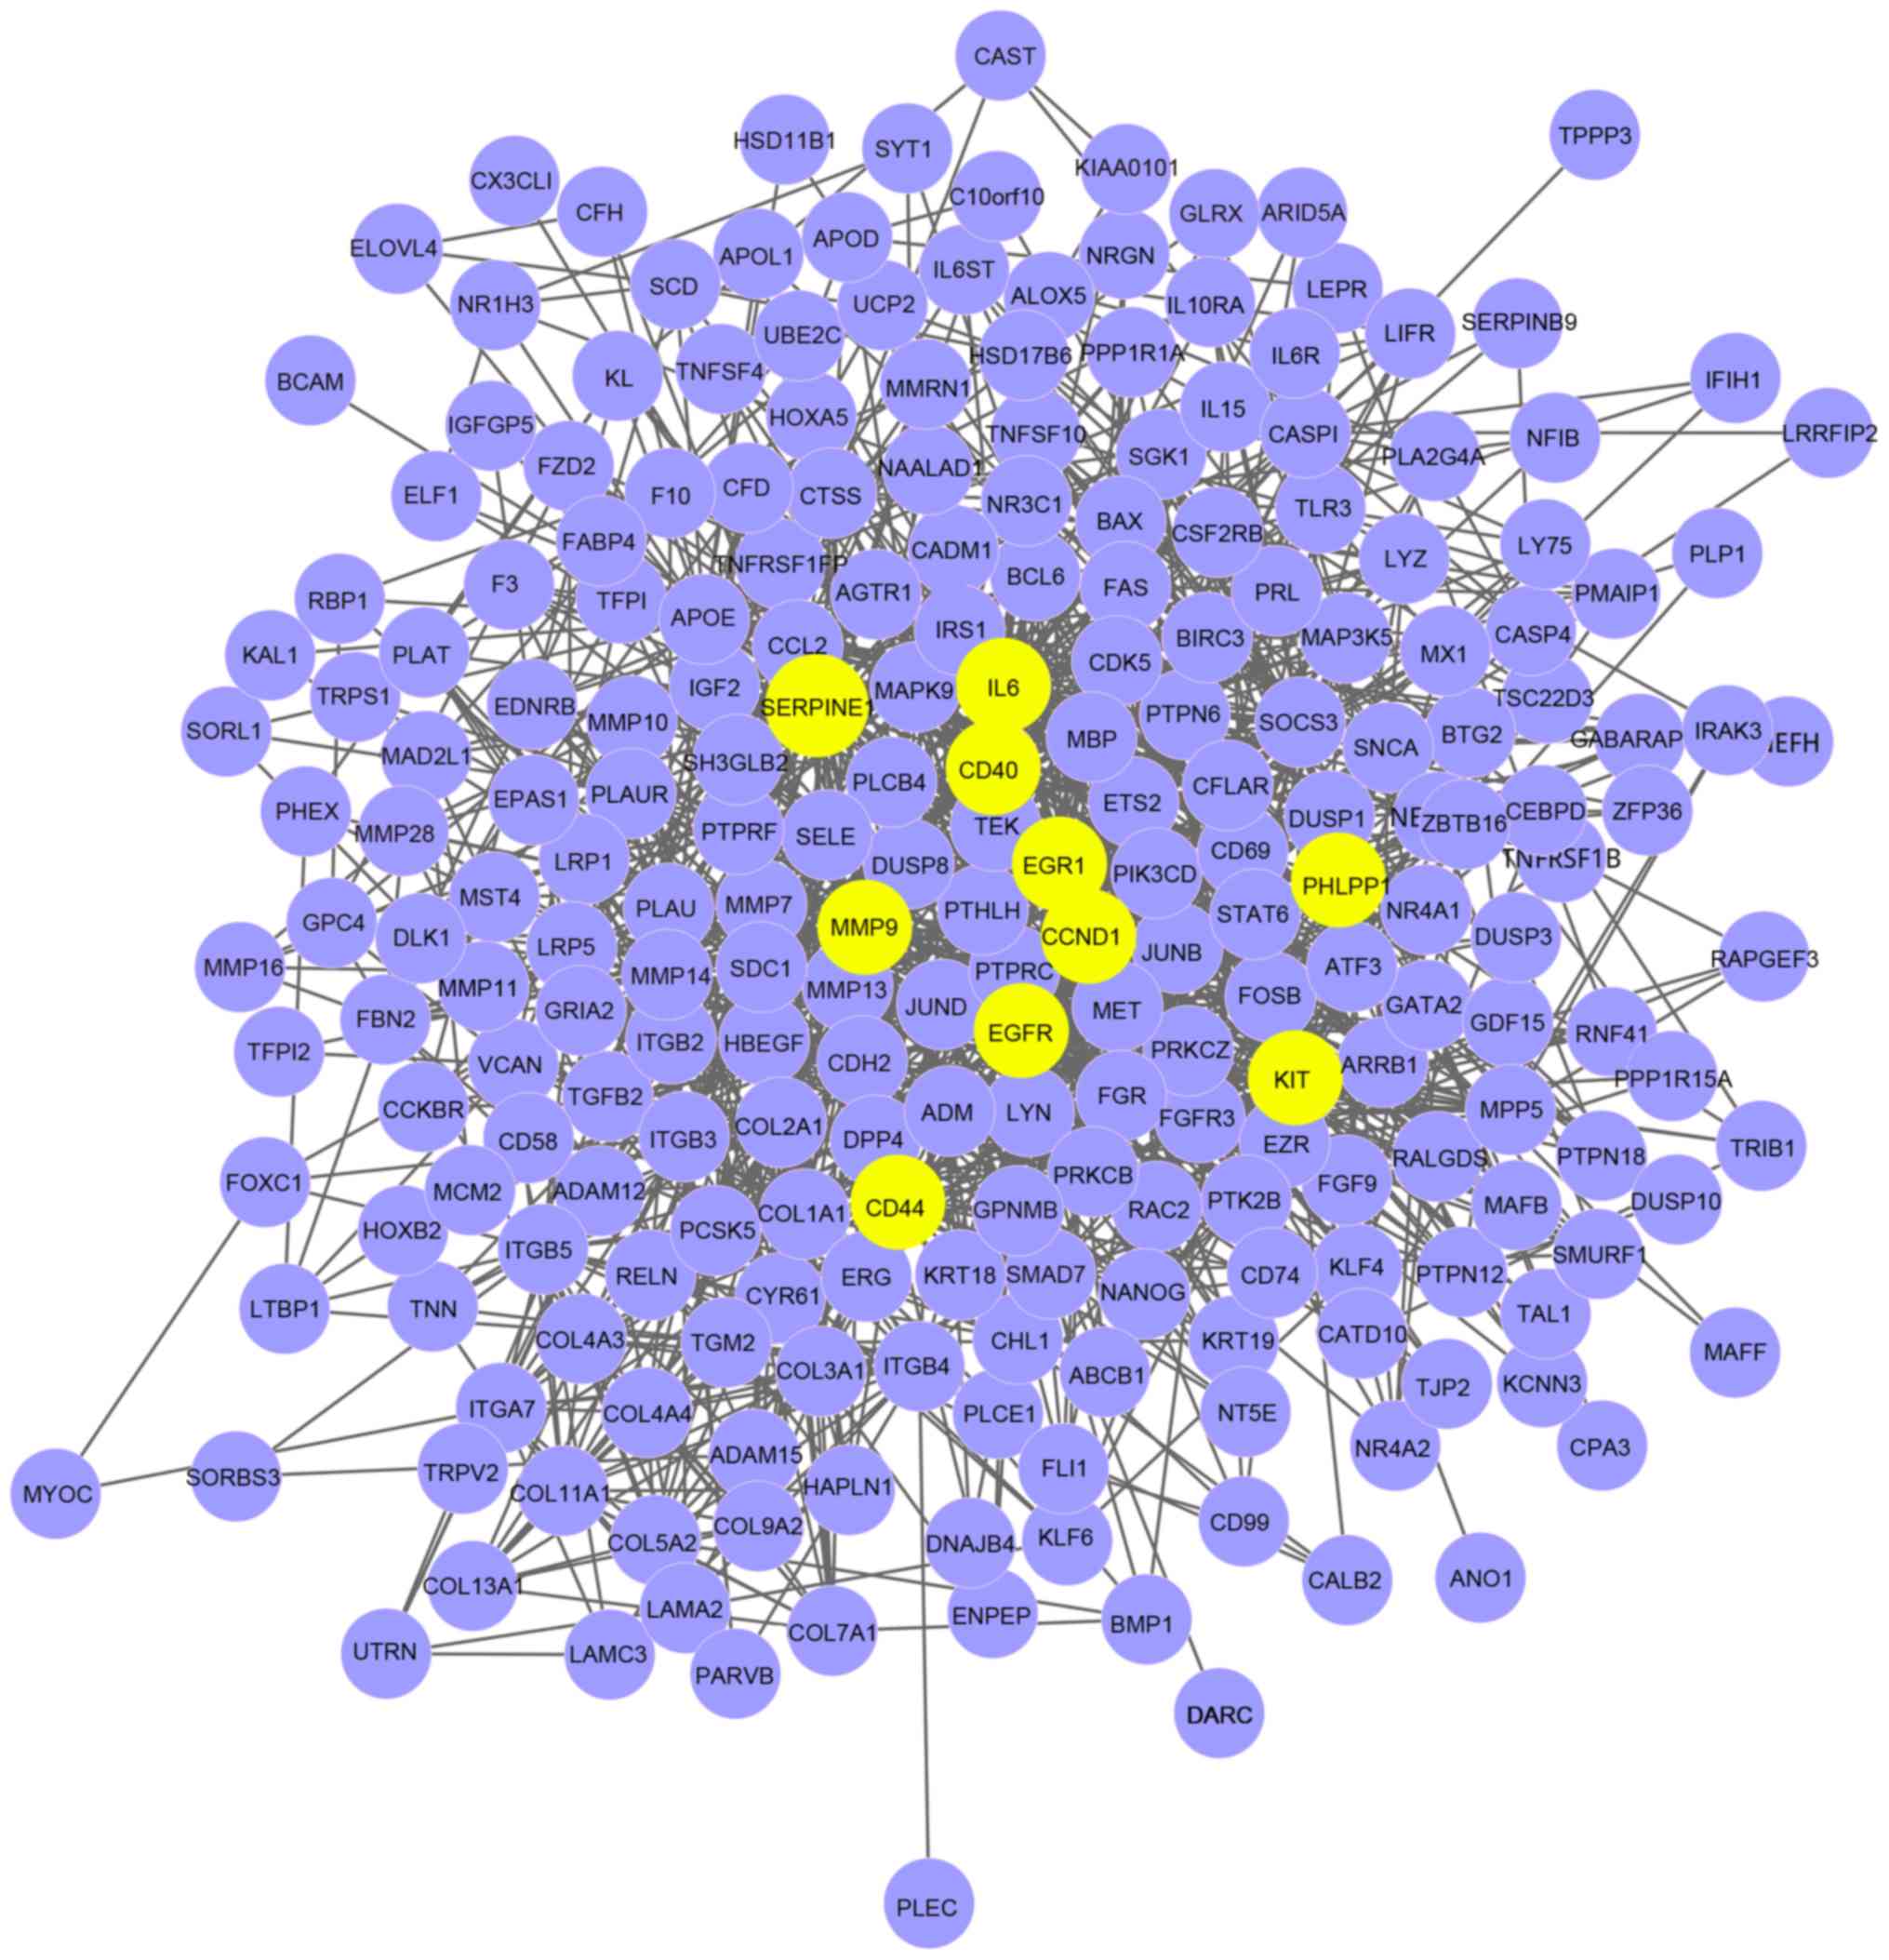 | Figure 4.Hub network. There were 10 hub genes
in the network; EGFR, IL6, CCND1, MMP9,
EGR1, KIT, SERPINE1, CD44, CD40
and PHLPP1. Nodes represented genes, and lines between two
nodes represent for gene-gene interactions. Yellow nodes are hub
genes, purple nodes are genes. EGFR, epidermal growth factor
receptor; IL6, interleukin 6; CCND1, cyclin D1;
MMP9, matrix metalloproteinase 9; EGR1, early growth
response 1; KIT, KIT proto-oncogene receptor tyrosine
kinase; SERPINE1, serpin family E member 1; CD,
cluster of differentiation; PHLPP1, PH domain and leucine
rich repeat protein phosphatase 1. |
Differential pathway
identification
In the present study, randomization tests were
implemented to identify differential pathways of UL based on the
common interactions between the Pathway networks and the Objective
network, and Pathway networks and Hub networks. During the
examination of the intersections between the Pathway networks and
Objective network, it was revealed that 358 pathways demonstrated
interactions with the Objective network, but the numbers of
interactions for the different pathways were markedly different,
and listed counts ≥ 20 in Table I.
‘Count’ signifies the quantity of intersecting interactions. The
top five pathways were signal transduction, with a count of 100,
extracellular matrix organization, with a count of 87, immune
system, with a count of 81, signaling by GPCR, with a count of 79
and GPCR downstream signaling, with a count of 60. A total of 28.2%
of the 358 pathways belonged to signal type pathways.
 | Table I.Intersections (≥20) between the
pathway and objective networks. |
Table I.
Intersections (≥20) between the
pathway and objective networks.
| Pathway | Count |
|---|
| Signal
transduction | 100 |
| Extracellular
matrix organization | 87 |
| Immune system | 81 |
| Signaling by
GPCR | 79 |
| GPCR downstream
signaling | 60 |
| Innate immune
system | 49 |
| G α (i) signaling
events | 34 |
| GPCR ligand
binding | 34 |
| Class A/1
(rhodopsin-like receptors) | 31 |
| Collagen
formation | 31 |
| Assembly of
collagen fibrils and other multimeric structures | 30 |
| Cytokine signaling
in immune system | 25 |
| Developmental
biology | 25 |
| Hemostasis | 24 |
| Metabolism of
lipids and lipoproteins | 22 |
| Gastrin-cyclic
adenosine 5′-monophosphate response element binding protein
signaling pathway via protein kinase C and mitogen-activated
protein kinase | 21 |
| Metabolism | 21 |
| Gene
expression | 20 |
Concurrently, a total of 162 pathways interacted
with the Hub networks, and Table II
summarizes the pathways with counts ≥10. Immune system, signal
transduction, innate immune system, hemostasis and signaling by
GPCR were the top five in descending order, with counts of 49, 42,
29, 19 and 19, respectively. The 162 pathways were all involved in
the intersections between the Pathway networks and the Objective
network. It also validated the feasibility and accuracy of this
method in identifying the differential pathways in UL.
| Table II.Intersections (≥10) between the
pathway and hub networks. |
Table II.
Intersections (≥10) between the
pathway and hub networks.
| Pathway | Count |
|---|
| Immune system | 49 |
| Signal
transduction | 42 |
| Innate immune
system | 29 |
| Hemostasis | 19 |
| Signaling by
GPCR | 19 |
| Cytokine signaling
in immune system | 17 |
| Developmental
biology | 17 |
| Extracellular
matrix organization | 17 |
| Fc ε receptor
signaling | 13 |
| TLR cascades | 13 |
| Activated TLR4
signaling | 12 |
| TLR4 cascade | 12 |
| Axon guidance | 11 |
| MyD88-independent
TLR3/TLR4 cascade | 10 |
| TLR3 cascade | 10 |
|
TIR-domain-containing adapter-inducing
interferon-β-mediated TLR3/TLR4 signaling | 10 |
If P<0.05, the pathway was considered to be a
differential pathway. Notably, the majority of the P-values were
close to or equal to 0, which suggested that these pathways were
significantly differential. Due to the similar P-values of the
differential pathways, the count may be an additional measure to
evaluate the significance of pathways. The higher of count, the
closer the association between the pathway and UL, such as signal
transduction, with a count of 100.
Discussion
To identify the differential pathways of UL, a novel
method including Pathway, Objective and Hub networks, was proposed.
The topological properties of gene interaction networks have been
studied widely (30). It has been
indicated that gene interaction networks also have scale-free
properties (35,36), which are typical of biological
networks. Featherstone and Broadie (37) demonstrated that the scale-free
distribution of gene degrees in network assisted organisms in
developing resistance to the deleterious effects of mutation.
Similar architecture was also identified in the gene co-expression
networks of gastric cancer (38). In
the present study, a novel network-based method was produced, in
which the objective network was revealed to be an evidently
scale-free network, whose node degree distribution followed a power
law with the fitting coefficient, which validated the reliability
and feasibility of the network-based method.
A total of 358 differential pathways were
identified, based on networks and randomization tests with
P<0.05, for example, signal transduction, immune system and
signaling by GPCR. In addition, the differential pathways obtained
from Hub networks were all involved in these 358 pathways,
attributing to the Hub network presented as a sub-network of
objective network, and confirmed the repeatability of the present
study.
In detail, 28.2% of the 358 differential pathways
were associated with signaling, for example: Signal transduction
and signaling by GPCR. Signal transduction occurs when an
extracellular signaling molecule activates a specific receptor
located on the cell surface or inside the cell, which in turn
triggers a biochemical chain of events inside the cell, creating a
response (39). Depending on the
cell, the response alters the metabolism, shape, gene expression of
the cell, or ability of the cell to divide: Dysregulation of these
processes may lead to cancer (40).
It had been suggested that certain microbial molecules, such as
viral nucleotides and protein antigens, may elicit an immune system
response against invading pathogens, mediated by signal
transduction processes (41). Gene
activations and alterations in metabolism were examples of cellular
responses to extracellular stimulation that required signal
transduction (42). The
mitogen-activated protein kinase/extracellular-signal related
protein kinase pathway couples intracellular responses to the
binding of growth factors to cell surface receptors, and its
activation promoted cell division and numerous forms of cancer are
associated with aberrations in it, such as UL (43). Therefore, signal transduction serves a
significant role in UL development.
The immune system is a system involving a number of
biological structures and processes within an organism that
protects against disease. To function properly, it detects a wide
variety of pathogens (from viruses to parasitic worms) and
distinguishes them from the organism's own healthy tissue (44). In a number of species, the immune
system may be classified into subsystems, such as the innate immune
system versus the adaptive immune system, or humoral immunity
versus cell-mediated immunity. ‘Innate immune system’ was an
additional important differential pathway in the present study. The
present study indicated that UL development may be triggered, at
least in part, by a chronically-active inflammatory immune system.
The concept of inflammation actually serves a theory of fibroid
development based on an altered response to noxious stimuli;
possibly tissue injury from extravasated menstrual blood into the
myometrium, or hypoxia leading to altered tissue repair and
fibroids (45). It had been
demonstrated that leiomyoma formation may be acquired through
investigation of immune system (46).
Complex interactions between the endocrine and immune systems
govern the key endometrial events, and inflammatory pathway
dysfunction was present in the endometria of women with
endometriosis and uterine fibroids (47). Santulli et al (48) revealed that IL-33 was released as a
danger signal, alerting the immune system following endogenous
stimulation, and elevated serum IL-33 levels were associated with
the existence of UL (48). The
present study identified that IL6 was a hub gene in UL, and perhaps
also took part in the signal activity and served a critical role in
UL.
In conclusion, the present study successfully
identified differential pathways (such as signal transduction,
immune system and signaling by GPCR) in UL, which may provide
potential insights into the detection and treatment of UL.
References
|
1
|
Islam MS, Protic O, Giannubilo SR, Toti P,
Tranquilli AL, Petraglia F, Castellucci M and Ciarmela P: Uterine
leiomyoma: Available medical treatments and new possible
therapeutic options. J Clin Endocrinol Metab. 98:921–934. 2013.
View Article : Google Scholar : PubMed/NCBI
|
|
2
|
Buttram VC Jr and Reiter RC: Uterine
leiomyomata: Etiology, symptomatology, and management. Fertil
Steril. 36:433–445. 1981. View Article : Google Scholar : PubMed/NCBI
|
|
3
|
Gallup DG, Blessing JA, Andersen W and
Morgan MA: Gynecologic Oncology Group Study: Evaluation of
paclitaxel in previously treated leiomyosarcoma of the uterus: A
gynecologic oncology group study. Gynecol Oncol. 89:48–51. 2003.
View Article : Google Scholar : PubMed/NCBI
|
|
4
|
Zivanovic O, Jacks LM, Iasonos A, Leitao
MM Jr, Soslow RA, Veras E, Chi DS, Abu-Rustum NR, Barakat RR,
Brennan MF, et al: A nomogram to predict postresection 5-year
overall survival for patients with uterine leiomyosarcoma. Cancer.
118:660–669. 2012. View Article : Google Scholar : PubMed/NCBI
|
|
5
|
Jordán F, Nguyen TP and Liu WC: Studying
protein-protein interaction networks: A systems view on diseases.
Brief Funct Genomics. 11:497–504. 2012. View Article : Google Scholar : PubMed/NCBI
|
|
6
|
Koohestani F, Braundmeier AG, Mahdian A,
Seo J, Bi J and Nowak RA: Extracellular matrix collagen alters cell
proliferation and cell cycle progression of human uterine leiomyoma
smooth muscle cells. PLoS One. 8:e758442013. View Article : Google Scholar : PubMed/NCBI
|
|
7
|
Halder SK, Goodwin JS and Al-Hendy A:
1,25-Dihydroxyvitamin D3 reduces TGF-beta3-induced fibrosis-related
gene expression in human uterine leiomyoma cells. J Clin Endocrinol
Metab. 96:E754–E762. 2011. View Article : Google Scholar : PubMed/NCBI
|
|
8
|
Moore AB, Yu L, Swartz CD, Zheng X, Wang
L, Castro L, Kissling GE, Walmer DK, Robboy SJ and Dixon D: Human
uterine leiomyoma-derived fibroblasts stimulate uterine leiomyoma
cell proliferation and collagen type I production, and activate
RTKs and TGF beta receptor signaling in coculture. Cell Commun
Signal. 8:102010. View Article : Google Scholar : PubMed/NCBI
|
|
9
|
Lin CP, Chen YW, Liu WH, Chou HC, Chang
YP, Lin ST, Li JM, Jian SF, Lee YR and Chan HL: Proteomic
identification of plasma biomarkers in uterine leiomyoma. Mol
Biosyst. 8:1136–1145. 2012. View Article : Google Scholar : PubMed/NCBI
|
|
10
|
Hodge JC, Kim TM, Dreyfuss JM,
Somasundaram P, Christacos NC, Rousselle M, Quade BJ, Park PJ,
Stewart EA and Morton CC: Expression profiling of uterine
leiomyomata cytogenetic subgroups reveals distinct signatures in
matched myometrium: Transcriptional profilingof the t(12;14) and
evidence in support of predisposing genetic heterogeneity. Hum Mol
Genet. 21:2312–2329. 2012. View Article : Google Scholar : PubMed/NCBI
|
|
11
|
Toyoshiba H, Yamanaka T, Sone H, Parham
FM, Walker NJ, Martinez J and Portier CJ: Gene interaction network
suggests dioxin induces a significant linkage between aryl
hydrocarbon receptor and retinoic acid receptor beta. Environ
Health Perspect. 112:1217–1224. 2004. View Article : Google Scholar : PubMed/NCBI
|
|
12
|
Toyoshiba H, Sone H, Yamanaka T, Parham
FM, Irwin RD, Boorman GA and Portier CJ: Gene interaction network
analysis suggests differences between high and low doses of
acetaminophen. Toxicol Appl Pharmacol. 215:306–316. 2006.
View Article : Google Scholar : PubMed/NCBI
|
|
13
|
Barter RL, Schramm SJ, Mann GJ and Yang
YH: Network-based biomarkers enhance classical approaches to
prognostic gene expression signatures. BMC Syst Biol. 8 Suppl
4:S52014. View Article : Google Scholar : PubMed/NCBI
|
|
14
|
Nibbe RK, Chowdhury SA, Koyutürk M, Ewing
R and Chance MR: Protein-protein interaction networks and
subnetworks in the biology of disease. Wiley Interdiscip Rev Syst
Biol Med. 3:357–367. 2011. View Article : Google Scholar : PubMed/NCBI
|
|
15
|
Wu Y, Jing R, Jiang L, Jiang Y, Kuang Q,
Ye L, Yang L, Li Y and Li M: Combination use of protein-protein
interaction network topological features improves the predictive
scores of deleterious non-synonymous single-nucleotide
polymorphisms. Amino Acids. 46:2025–2035. 2014. View Article : Google Scholar : PubMed/NCBI
|
|
16
|
Szklarczyk D, Franceschini A, Wyder S,
Forslund K, Heller D, Huerta-Cepas J, Simonovic M, Roth A, Santos
A, Tsafou KP, et al: STRING v10: Protein-protein interaction
networks, integrated over the tree of life. Nucleic Acids Res.
43:(Database issue). D447–D452. 2015. View Article : Google Scholar : PubMed/NCBI
|
|
17
|
Croft D, Mundo AF, Haw R, Milacic M,
Weiser J, Wu G, Caudy M, Garapati P, Gillespie M, Kamdar MR, et al:
The Reactome pathway knowledgebase. Nucleic Acids Res. 42:(Database
issue). D472–D477. 2014. View Article : Google Scholar : PubMed/NCBI
|
|
18
|
Hodge JC, Kim TM, Dreyfuss JM,
Somasundaram P, Christacos NC, Rousselle M, Quade BJ, Park PJ,
Stewart EA and Morton CC: Expression profiling of uterine
leiomyomata cytogenetic subgroups reveals distinct signatures in
matched myometrium: Transcriptional profilingof the t(12;14) and
evidence in support of predisposing genetic heterogeneity. Hum Mol
Genet. 21:2312–2329. 2012. View Article : Google Scholar : PubMed/NCBI
|
|
19
|
Barlin JN, Zhou QC, Leitao MM, Bisogna M,
Olvera N, Shih KK, Jacobsen A, Schultz N, Tap WD, Hensley ML, et
al: Molecular subtypes of uterine leiomyosarcoma and correlation
with clinical outcome. Neoplasia. 17:183–189. 2015. View Article : Google Scholar : PubMed/NCBI
|
|
20
|
Irizarry RA, Bolstad BM, Collin F, Cope
LM, Hobbs B and Speed TP: Summaries of Affymetrix Genechip probe
level data. Nucleic Acids Res. 31:e152003. View Article : Google Scholar : PubMed/NCBI
|
|
21
|
Bolstad BM, Irizarry RA, Astrand M and
Speed TP: A comparison of normalization methods for high density
oligonucleotide array data based on variance and bias.
Bioinformatics. 19:185–193. 2003. View Article : Google Scholar : PubMed/NCBI
|
|
22
|
Bolstad B: affy: Built-in processing
methods. 2013.
|
|
23
|
Lee J and Kim DW: Efficient multivariate
feature filter using conditional mutual information. Electron Lett.
48:161–162. 2012. View Article : Google Scholar
|
|
24
|
Taminau J, Meganck S and Lazar C: Using
the inSilicoMerging package. http://www.bioconductor.org/packages//2.10/bioc/vignettes/inSilicoMerging/inst/doc/inSilicoMerging.pdfAccessed.
June 22–2012.
|
|
25
|
Smyth GK: Linear models and empirical
bayes methods for assessing differential expression in microarray
experiments. Stat Appl Genet Mol Biol. 3:Article32004. View Article : Google Scholar : PubMed/NCBI
|
|
26
|
Diboun I, Wernisch L, Orengo CA and
Koltzenburg M: Microarray analysis after RNA amplification can
detect pronounced differences in gene expression using limma. BMC
Genomics. 7:2522006. View Article : Google Scholar : PubMed/NCBI
|
|
27
|
Zhuang DY, Jiang L, He QQ, Zhou P and Yue
T: Identification of hub subnetwork based on topological features
of genes in breast cancer. Int J Mol Med. 35:664–674. 2015.
View Article : Google Scholar : PubMed/NCBI
|
|
28
|
Smoot ME, Ono K, Ruscheinski J, Wang PL
and Ideker T: Cytoscape 2.8: New features for data integration and
network visualization. Bioinformatics. 27:431–432. 2011. View Article : Google Scholar : PubMed/NCBI
|
|
29
|
Bader DA and Madduri K: Parallel
algorithms for evaluating centrality indices in real-world
networksParallel Processing. 2006, ICPP 2006, Int Confer IEEE;
Columbus, OH: pp. 539–550, 2006.
|
|
30
|
Haythornthwaite C: Social network
analysis: An approach and technique for the study of information
exchange. Lib Inf Sci Res. 18:323–342. 1996. View Article : Google Scholar
|
|
31
|
Ravasz E, Somera AL, Mongru DA, Oltvai ZN
and Barabási AL: Hierarchical organization of modularity in
metabolic networks. Science. 297:1551–1555. 2002. View Article : Google Scholar : PubMed/NCBI
|
|
32
|
Rifai N and Ridker PM: Proposed
cardiovascular risk assessment algorithm using high-sensitivity
C-reactive protein and lipid screening. Clin Chem. 47:28–30.
2001.PubMed/NCBI
|
|
33
|
Canay IA, Romano JP and Shaikh AM:
Randomization tests under an approximate symmetry assumption.
Econometrica. 85:1013–1030. 2017. View Article : Google Scholar
|
|
34
|
Ibragimov R and Müller UK: t-Statistic
based correlation and heterogeneity robust inference. J Business
Eco Stat. 28:453–468. 2010. View Article : Google Scholar
|
|
35
|
Jordan IK, Mariño-Ramírez L, Wolf YI and
Koonin EV: Conservation and coevolution in the scale-free human
gene coexpression network. Mol Biol Evol. 21:2058–2070. 2004.
View Article : Google Scholar : PubMed/NCBI
|
|
36
|
van Noort V, Snel B and Huynen MA: The
yeast coexpression network has a small-world, scale-free
architecture and can be explained by a simple model. EMBO Rep.
5:280–284. 2004. View Article : Google Scholar : PubMed/NCBI
|
|
37
|
Featherstone DE and Broadie K: Wrestling
with pleiotropy: Genomic and topological analysis of the yeast gene
expression network. Bioessays. 24:267–274. 2002. View Article : Google Scholar : PubMed/NCBI
|
|
38
|
Aggarwal A, Guo DL, Hoshida Y, Yuen ST,
Chu KM, So S, Boussioutas A, Chen X, Bowtell D, Aburatani H, et al:
Topological and functional discovery in a gene coexpression
meta-network of gastric cancer. Cancer Res. 66:232–241. 2006.
View Article : Google Scholar : PubMed/NCBI
|
|
39
|
Hynes NE, Ingham PW, Lim WA, Marshall CJ,
Massagué J and Pawson T: Signalling change: Signal transduction
through the decades. Nat Rev Mol Cell Biol. 14:393–398. 2013.
View Article : Google Scholar : PubMed/NCBI
|
|
40
|
Cabal-Hierro L and Lazo PS: Signal
transduction by tumor necrosis factor receptors. Cell Signal.
24:1297–1305. 2012. View Article : Google Scholar : PubMed/NCBI
|
|
41
|
Würstle ML, Laussmann MA and Rehm M: The
central role of initiator caspase-9 in apoptosis signal
transduction and the regulation of its activation and activity on
the apoptosome. Exp Cell Res. 318:1213–1220. 2012. View Article : Google Scholar : PubMed/NCBI
|
|
42
|
Wynn ML, Merajver SD and Schnell S:
Unraveling the complex regulatory relationships between metabolism
and signal transduction in cancer. Adv Exp Med Biol. 736:179–189.
2012. View Article : Google Scholar : PubMed/NCBI
|
|
43
|
Makker A, Goel MM, Das V and Agarwal A:
PI3K-Akt-mTOR and MAPK signaling pathways in polycystic ovarian
syndrome, uterine leiomyomas and endometriosis: An update. Gynecol
Endocrinol. 28:175–181. 2012. View Article : Google Scholar : PubMed/NCBI
|
|
44
|
Parham P: The Immune System. 4th. Garland
Science; New York, NY: 2014
|
|
45
|
Leppert P, Fouany M and Segars JH:
Understanding uterine fibroidsFibroids. Segars JH: John Wiley &
Sons, Ltd.; Oxford: 2013, View Article : Google Scholar
|
|
46
|
Wegienka G, Baird DD, Cooper T, Woodcroft
KJ and Havstad S: Cytokine patterns differ seasonally between women
with and without uterine leiomyomata. Am J Reprod Immunol.
70:327–335. 2013. View Article : Google Scholar : PubMed/NCBI
|
|
47
|
Maybin JA, Critchley HO and Jabbour HN:
Inflammatory pathways in endometrial disorders. Mol Cell
Endocrinol. 335:42–51. 2011. View Article : Google Scholar : PubMed/NCBI
|
|
48
|
Santulli P, Even M, Chouzenoux S,
Millischer AE, Borghese B, de Ziegler D, Batteux F and Chapron C:
Profibrotic interleukin-33 is correlated with uterine leiomyoma
tumour burden. Hum Reprod. 28:2126–2133. 2013. View Article : Google Scholar : PubMed/NCBI
|