Introduction
Bladder cancer, a disease that is reported more
frequently in men than in women, is the most common urological
malignancy (1). It has been estimated
that there were ~74,000 novel cases and 16,000 incidences of
mortality in the USA alone in 2015 (2). In total, ~90% of these patients were
diagnosed with transitional cell carcinoma (TCC), whereas
adenocarcinoma and squamous cell carcinoma accounted for <10% of
the cases (3). TCC is one of only a
limited number of types of cancer that is responsive to
immunotherapy (4). Bladder cancer has
a high probability of recurrence, which makes it a costly cancer to
treat (5). To develop an effective
and cost-effective therapy for TCC, it is necessary to identify and
exploit the molecular mechanisms and factors involved (6), particularly the markers of recurrent
disease.
Comparing the level of certain mRNAs in cancer
tissues with the same patents' normal tissues is a practical
approach to identifying new biomarkers implicated in the TCC
process. In order to do this, fluorescence-based reverse
transcription-quantitative polymerase chain reaction (RT-qPCR),
which is one of the most common and powerful quantification
methods, was employed in the present study to evaluate mRNA
expression in specimens affected by bladder cancer. The result
obtained by RT-qPCR not only informs on the cancer-driven
biological variation of gene expression, but also reflects the
confounding factors as well. According to The Minimum Information
for Publication of Quantitative Real-Time PCR Experiments (MIQE)
guidelines (7), these factors are
associated with the entire procedure of qPCR, from experimental
design to data analysis. Therefore, the choice of reference genes
is one of the most influential factors in RT-qPCR, because these
genes can be applied to a normalization strategy to monitor the
variation in amplification efficiencies as well as the differences
between the samples, particularly for cancer tissues (8).
Reference genes, such as the housekeeping genes
GAPDH and β-actin, are usually constitutively expressed at high
levels in different cell types or tissues, but their mRNA levels
may be affected by the cell type or tissue used, as well as the
experimental conditions (9,10). Thus, it is of critical importance to
evaluate the reference genes under similar experimental conditions
in the same tissue type prior to their use normalizing RNA levels
for target genes. Several freely available mathematical software
programs, including geNorm (11),
NormFinder (12) and BestKeeper
(13), have been developed to address
this issue.
Despite the fact that the selection of a reference
gene is important, the majority of published gene expression
reports do not state the rationale for the selection made (14). As a result, numerous studies of gene
expression often fail to produce comparable and reliable results.
RT-qPCR with SYBR-Green is widely used in a number of studies
investigating cancer, but few have reported the expression
stability of reference genes in bladder cancer (12,15). One
study reportedly employed SYBR-Green chemistry (12), but it was performed without any
matched non-cancerous samples and used different mathematical
algorithms from those in the present study. Therefore, the present
study sought to identity the most suitable reference genes for mRNA
profiling in bladder cancer, specifically TCC. To this end, 18
carefully selected reference genes were quantified using SYBR-Green
qPCR, then the expression stability of the candidate genes was
evaluated using quantification cycle (Cq) analysis, geNorm,
NormFinder and BestKeeper.
Materials and methods
Human TCC sample collection
The inclusion criteria were as follows: Patients
newly diagnosed with TCC for whom tumors were removed by
transurethral resection and patients with adequately matched
non-cancerous TCC samples. Exclusion criteria included non-TCC
histology, salvage cystectomy, upper tract TCC and incomplete
medical records. Written informed consent was obtained from all
patients and the present study was approved by the Sun Yat-Sen
University Cancer Center (Guangzhou, China) and the institutional
review board of Shenzhen Second People's Hospital (Shenzhen,
China). A total of 35 fresh tumor samples with matched normal
controls (morphologically adjacent normal bladder tissues) were
obtained from individuals newly diagnosed with TCC from June 2013
to October 2014 (Table I). Patients
were aged between 41 and 81 years, with a mean age of 61 years. The
samples were divided into two groups: One group was used for
conventional pathology examination analysis in the pathology
department of the hospital, whereas the second was immediately
immersed in RNAlater (Qiagen GmbH, Hilden, Germany) and stored at
−80°C or snap-frozen in liquid nitrogen until RNA extraction.
 | Table I.Characteristics of transitional cell
carcinoma samples. |
Table I.
Characteristics of transitional cell
carcinoma samples.
| Characteristic | Patients, n |
|---|
| Total number of
patients | 35 |
| Age |
|
| Mean
(range) | 61 (41–81) |
| Sex |
|
| Male | 30 |
|
Female | 5 |
| Histological
grade |
|
| Low | 8 |
| High | 20 |
|
Unknown | 7 |
| Tumor
stagea |
|
| pTa | 2 |
| pT1 | 12 |
|
pT2 | 7 |
|
pT3 | 6 |
|
pT4 | 5 |
|
Unknown | 3 |
| Lymph node
status |
|
|
Negative | 29 |
|
Positive | 3 |
|
Unknown | 3 |
| Metastasis |
|
|
Negative | 31 |
|
Positive | 1 |
|
Unknown | 3 |
Total RNA isolation and cDNA
synthesis
The preserved TCC samples (18–70 mg) were cut into
the smallest possible pieces and homogenized in 200 µl TRIzol
reagent (Invitrogen; Thermo Fisher Scientific, Inc., Waltham, MA,
USA) under sterile conditions. Total RNA was then extracted
according to the manufacturer's protocol. The quantification and
quality control of total RNA were performed in triplicate with a
NanoDrop2000 spectrophotometer (Thermo Fisher Scientific, Inc.).
According to the MIQE guidelines, the following conditions must be
met for cDNA synthesis: An RNA concentration >50 ng/µl and
absorbance ratios of 260/280 nm of between 1.8 and 2.1. The
integrity and genomic DNA contaminant of isolated RNA was confirmed
by 1.2% SYBR-Green-safe agarose electrophoresis (Invitrogen; Thermo
Fisher Scientific, Inc.).
In a 20 µl PCR, 1 µg of Total RNA was
reverse-transcribed into first-strand cDNA using PrimeScript RT
Master Mix (Takara Bio, Inc., Otsu, Japan). The reaction mixture
was incubated at 37°C for 15 min for RT, then at 85°C for 5 sec to
inactivate reverse transcriptase. The RT products were subsequently
stored at −20°C until further use. The PrimeScript RT Master mix
included reaction buffer (Mg2+), PrimeScript reverse
transcriptase, dNTP mixture, random hexamers, oligo dT primer and
an RNase inhibitor, used to ensure the uniformity of the reverse
transcription reaction between samples. cDNAs of all samples were
diluted 1:10 for qRT-PCR.
Selection of the candidate reference
genes and validation of the primers
A total of 18 candidate reference genes were
selected in the present study. Their identity and characteristics
are summarized in Table II,
including the gene name, GenBank accession number and the sequence
of primer pairs.
| Table II.Characteristics of 18 selected
reference genes. |
Table II.
Characteristics of 18 selected
reference genes.
| Gene symbol | Gene name | GenBank accession
no. | Chromosomal
localization | Forward and reverse
primers | Product, bp |
Intron-spanning |
|---|
| GAPDH |
Glyceraldehyde-3-phosphate
dehydrogenase | NM_002046.3 | 12p13.31 |
5′-TCTCCTCTGACTTCAACAGCGAC-3′ |
|
|
|
|
|
|
|
5′-CCCTGTTGCTGTAGCCAAATTC-3′ | 126 | Yes |
| ACTB | β-actin | NM_001101.2 | 7p22.1 |
5′-GCCCTGAGGCACTCTTCCA-3′ |
|
|
|
|
|
|
|
5′-CGGATGTCCACGTCACACTTC-3′ | 100 | Yes |
| ATP5B | ATP synthase,
H+-transporting, mitochondrial F1 complex, β polypeptide | NM_001686.3 | 12q13.3 |
5′-TCACCCAGGCTGGTTCAGA-3′ |
|
|
|
|
|
|
|
5′-AGTGGCCAGGGTAGGCTGAT-3′ | 80 | Yes |
| HSP90AB1 | Heat-shock protein
90 kDa alpha (cytosolic), class B member 1 | NM_001271969 | 6p12 |
5′-AAGAGAGCAAGGCAAAGTTTGAG-3′ |
|
|
|
|
|
|
|
5′-TGGTCACAATGCAGCAAGGT-3′ | 120 | Yes |
| S100A6 | S100 calcium-A6
binding protein | NM_014624.3 | 1q21 |
5′-ACAAGCACACCCTGAGCAAGA-3′ |
|
|
|
|
|
|
|
5′-CCATCAGCCTTGCAATTTCA-3′ | 99 | Yes |
| TMBIM6 | Transmembrane BAX
inhibitor motif-containing 6 | NM_003217.2 | 12q13.12 |
5′-TGCTGGATTTGCATTCCTTACA-3′ |
|
|
|
|
|
|
|
5′-ACGGCGCCTGGCATAGA-3′ | 151 | Yes |
| CFL1 | Cofilin 1
(non-muscle) | NM_005507.2 | 11q13 |
5′-GAAGGAGGATCTGGTGTTTATCTTCT-3′ |
|
|
|
|
|
|
|
GCTGGCATAAATCATTTTGCTCTT-3′ | 73 | Yes |
| TPT1 | Tumor protein,
translationally controlled 1 | NM_001286272.1 | 13q14 |
5′-GATCGCGGACGGGTTGT-3′ |
|
|
|
|
|
|
|
5′-TTCAGCGGAGGCATTTCC-3′ | 100 | Yes |
| UBB | Ubiquitin B | NM_018955.3 | 17p12-p11.2 |
5′-GGGCGGTTGGCTTTGTT-3′ |
|
|
|
|
|
|
|
5′-GACCTGTTAGCGGATACCAGGAT-3′ | 91 | Yes |
| UBC | Ubiquitin C | NM_021009.6 | 12q24.3 |
5′-GATTTGGGTCGCAGTTCTT-3′ |
|
|
|
|
|
|
|
5′-TGCCTTGACATTCTCGATGGT-3′ | 134 | Yes |
| RPS13 | Ribosomal protein
S13 | NM_001017.2 | 11p15 |
5′-CGAAAGCATCTTGAGAGGAACA-3′ |
|
|
|
|
|
|
|
5′-TCGAGCCAAACGGTGAATC-3′ | 87 | Yes |
| RPS23 | Ribosomal protein
S23 | NM_001025.4 | 5q14.2 |
5′-TGGAGGTGCTTCTCATGCAA-3′ |
|
|
|
|
|
|
|
5′-AATGGCAGAATTTGGCTGTTTG-3′ | 76 | Yes |
| SDHA | Succinate
dehydrogenase complex, subunit A,flavoprotein (Fp) | NM_004168 | 5p15 |
5′-CACTGGAGGAAGCACACCC-3′ |
|
|
|
|
|
|
|
5′-GTCGATCACGGGTCTATATTCCAGA-3′ | 78 | Yes |
| TBP | TATA box-binding
protein | NM_003194.4 | 6q27 |
5′-TTCGGAGAGTTCTGGGATTGTA-3′ |
|
|
|
|
|
|
|
5′-TGGACTGTTCTTCACTCTTGGC-3′ | 227 | Yes |
| POLR2A | Polymerase (RNA) II
(DNA directed) polypeptide A, 220 kDa | NM_000937.4 | 17p13.1 |
5′-GCACCACGTCCAATGACAT-3′ |
|
|
|
|
|
|
|
5′-GTGCGGCTGCTTCCATAA-3′ | 267 | Yes |
| RPL13A | Ribosomal protein
L13a | NM_012423 | 19q13.3 |
5′-CCTGGAGGAGAAGAGGAAAGAGA-3′ |
|
|
|
|
|
|
|
5′-TTGAGGACCTCTGTGTATTTGTCAA-3′ | 126 | Yes |
| PPIA | Peptidyl-prolyl
isomerase A (cyclophilin A) | NM_021130 | 7p13 |
5′-CCCACCGTGTTCTTCGACATT-3′ |
|
|
|
|
|
|
|
5′-GGACCCGTATGCTTTAGGATGA-3′ | 275 | Yes |
| HPRT1 | Hypoxanthine
phosphoribosyltransferase 1 | NM_000194 | Xq26.1 |
5′-GAAAAGGACCCCACGAAGTGT-3′ |
|
|
|
|
|
|
|
5′-AGTCAAGGGCATATCCTACAACA-3′ | 89 | Yes |
The primers were synthesized by Sangon Biotech Co.,
Ltd (Shanghai, China). They were selected on the basis of published
reports on reference gene expression profiles and previous
databases (11–16). Next, the primer sequences were
cross-checked using the University of California Santa Cruz
web-based tool in silico PCR (genome.ucsc.edu/cgi-bin/hgPcr) (17) against genomic and gene targets. qPCR
was performed on cDNA of randomly selected tumor tissues to check
the specificity of all primers. The melting curve and the
visualized PCR products on 2% SYBR-Green-safe agarose gel were then
evaluated (Fig. 1).
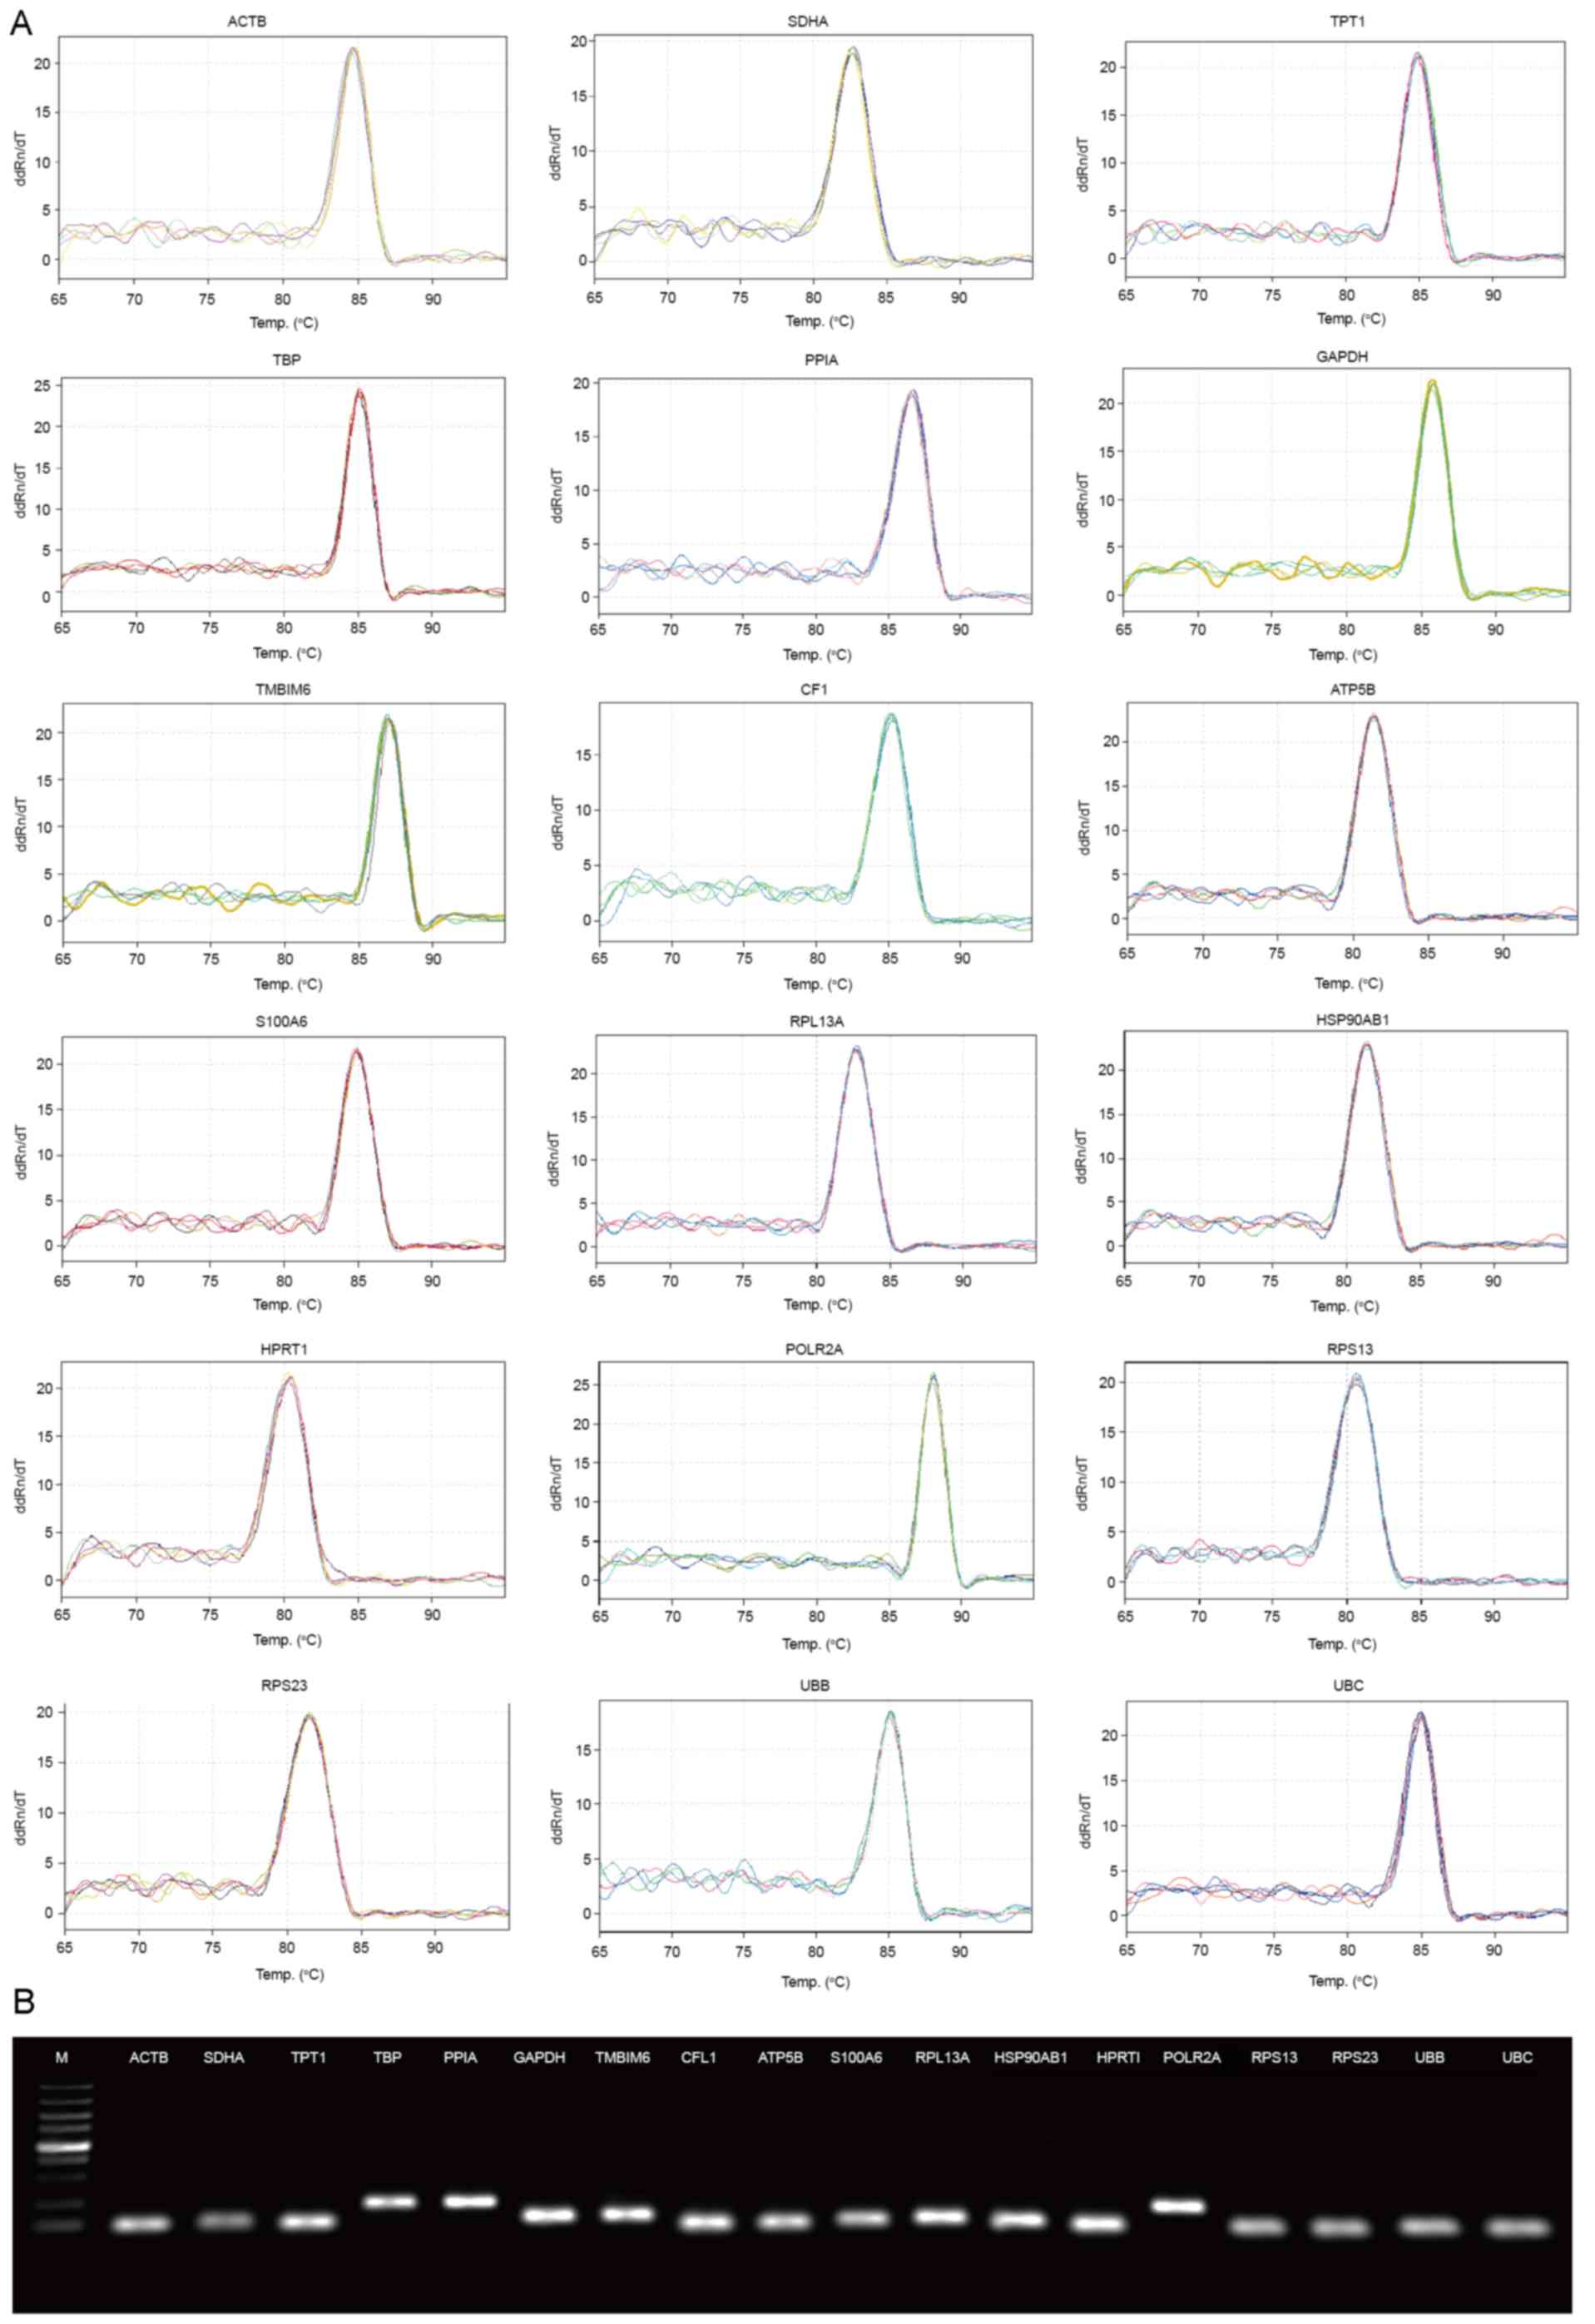 | Figure 1.Primer specificity analysis for the 18
candidate reference genes. (A) Melting curves of the 18 reference
genes exhibiting single peaks. (B) Agarose gel electrophoresis
(1.2%) exhibited a single and specific polymerase chain reaction
product of each reference gene. M, marker lane (from bottom to top:
100, 250, 500, 750, 1,000, 1,500, 2,000, 3,000 and 5,000 bp). See
Table II for gene name
definitions. |
RT-qPCR
RT-qPCR for 18 candidate reference genes was
performed in 96-well plates with the LightCycler 480 Real-Time PCR
System (Roche Applied Science, Pleasanton, CA, USA) and qTOWER2.0
(Analytik Jena AG, Jena, Germany). A LightCycler 480 SYBR Master
(Roche Applied Science) was used to detect double-stranded DNA
synthesis. In a 10 µl total volume, the PCRs contained 5 µl Premix
Ex Taq (Roche Applied Science), 1 µl 10-fold diluted RT product (50
ng total RNA), 1 µl forward and 1 µl reverse PCR primers (300 nM;
Sangon Biotech Co., Ltd) and 2 µl nuclease-free water (Roche
Applied Science). The reaction mixtures were processed with an
initial holding period at 95°C for 10 min, followed by a three-step
PCR program for 45 cycles that consisted of 95°C for 10 sec, 60°C
for 10 sec and 72°C for 25 sec. Immediately following PCR, a
melting curve program was activated by heating the product from
65–95°C at 0.1°C intervals. Reverse transcriptase negative controls
and no-template controls (NTC) were also included in each
experiment to avoid the contamination of genomic DNA or primer
dimers. Cancerous and corresponding non-cancerous specimens were
processed in the same run to exclude between-run variations. The
results of the melting curve analysis and electrophoresis of the
PCR products were used to confirm the specificity of the
amplification for each of the primer pairs (Fig. 1).
Cq value calculation and PCR
efficiency
The Cq value is equal to the number of cycles at
which the value of the fluorescent signal reaches a given threshold
of detection, and this value is negatively associated with the
initial amount of the input mRNA (8,18). In the
present study, the Cq value was adjusted to 0.1 in order to compare
different qPCRs on different plates, runs and days. Values were
excluded from further study when the Cq value was >40. The
gene-specific PCR efficiency of the primers were calculated from
the standard curves, which were constructed using the following
method: cDNA was diluted 1:10 from 100 ng to 1 pg total RNA prior
to reverse transcription in triplicate; following qPCR, the Cq
values obtained for the different concentrations of the input RNA
were plotted and linear regression was carried out for each
selected reference gene. The efficiency (E) was calculated using
the linear equation: E=10(−1/slope)-1 (8,18). The
2−ΔΔCq analysis was based on this equation (7).
Data and statistical analysis
The stability of the reference gene candidates was
evaluated with the Microsoft Excel-based (Microsoft Corporation,
Redmond, WA, USA) software programs of the currently available
algorithms: geNorm (11), NormFinder
(12) and BestKeeper (13). The raw qPCR data were exported into
Microsoft Excel files (.xls) and the Cq values were converted into
the corresponding format to meet the requirements of the software.
Cq values were directly subjected to BestKeeper analysis, whereas
ΔCq values were required for geNorm and NormFinder analysis. The
ΔCq value equals the raw Cq values minus the lowest Cq value of
qPCR for each gene. The equation E−ΔCq was used for each
data point (19). A paired Student's
t-test, used to compare numerical data between the matched
non-malignant and malignant specimens, was performed using GraphPad
Prism (version 5.1; GraphPad, Inc., La Jolla, CA, USA). The
correlation coefficients (R2) of each primer pair were
calculated from the standard curves. The coefficient of correlation
(R) demonstrated gene expression variation and was determined by
calculating the coefficient of variance and standard deviation of
the Cq set using BestKeeper analysis (version 1.0; http://www.gene-quantification.de/bestkeeper.html).
Results
Specificity and efficiency of the
primers for the 18 candidate reference genes
Melting curve analysis and agarose gel
electrophoresis gave a single expected product for each selected
gene (Fig. 1). No primer dimers or
non-specific PCR products were detected in the NTC, and there were
no evident genomic DNA contamination, as evidenced by the negative
result obtained using the reverse transcriptase negative
control.
The RT-qPCR efficiency of the primers was determined
using a dilution of 1:10 of the cDNA template from a randomly
selected human TCC sample. RNA levels may vary in the course of
reverse transcription, so a randomly selected sample was selected
rather than a plasmid (20–23). All the PCR assays produced efficiency
values for each gene, which ranged between 1.97 and 2.15, with a
slope from −3.045 to −3.392, intercept from 26.354 to 31.279 and
R2 from 0.994 to 0.999 (Table III).
| Table III.Quantitative polymerase chain
reaction parameters providing the standard curve for each primer
pair. |
Table III.
Quantitative polymerase chain
reaction parameters providing the standard curve for each primer
pair.
| Gene | Slope | Intercept | R2 | Efficiency | Dilution range |
|---|
| GAPDH | −3.245 | 27.050 | 0.996 | 2.03 | 1 pg-100 ng |
| ACTB | −3.221 | 28.070 | 0.999 | 2.04 | 1 pg-100 ng |
| ATP5B | −3.045 | 26.718 | 0.999 | 2.13 | 1 pg-100 ng |
| HSP90AB1 | −3.130 | 26.354 | 0.998 | 2.10 | 1 pg-100 ng |
| S100A6 | −3.252 | 28.418 | 0.999 | 2.03 | 1 pg-100 ng |
| TMBIM6 | −3.246 | 28.059 | 0.999 | 2.03 | 1 pg-100 ng |
| CFL1 | −3.151 | 27.134 | 0.999 | 2.08 | 1 pg-100 ng |
| TPT1 | −3.264 | 27.620 | 0.999 | 2.02 | 1 pg-100 ng |
| UBB | −3.359 | 27.549 | 0.999 | 1.98 | 10 pg-10 ng |
| UBC | −3.278 | 27.316 | 0.999 | 2.02 | 1 pg-100 ng |
| RPS13 | −3.288 | 28.422 | 0.999 | 2.01 | 1 pg-100 ng |
| RPS23 | −3.199 | 27.754 | 0.999 | 2.06 | 1 pg-100 ng |
| SDHA | −3.333 | 30.257 | 0.999 | 2.01 | 10 pg-10 ng |
| TBP | −3.392 | 31.279 | 0.994 | 1.97 | 10 pg-10 ng |
| POLR2A | −3.339 | 27.549 | 0.999 | 1.97 | 10 pg-10 ng |
| RPL13A | −3.067 | 27.381 | 0.998 | 2.15 | 1 pg-100 ng |
| PPIA | −3.327 | 28.560 | 0.999 | 2.00 | 1 pg-100 ng |
| HPRT1 | −3.234 | 28.451 | 0.999 | 2.05 | 10 pg-10 ng |
Expression levels of 18 candidate
reference genes
A total of 18 candidate reference genes were
selected, involved in different pathways and functions, to avoid
even the slightest deviation in co-regulation (11). Two cases [ribosome protein S13 (RPS13)
and RPS23, ubiquitin B (UBB) and UBC] had similar functions, but
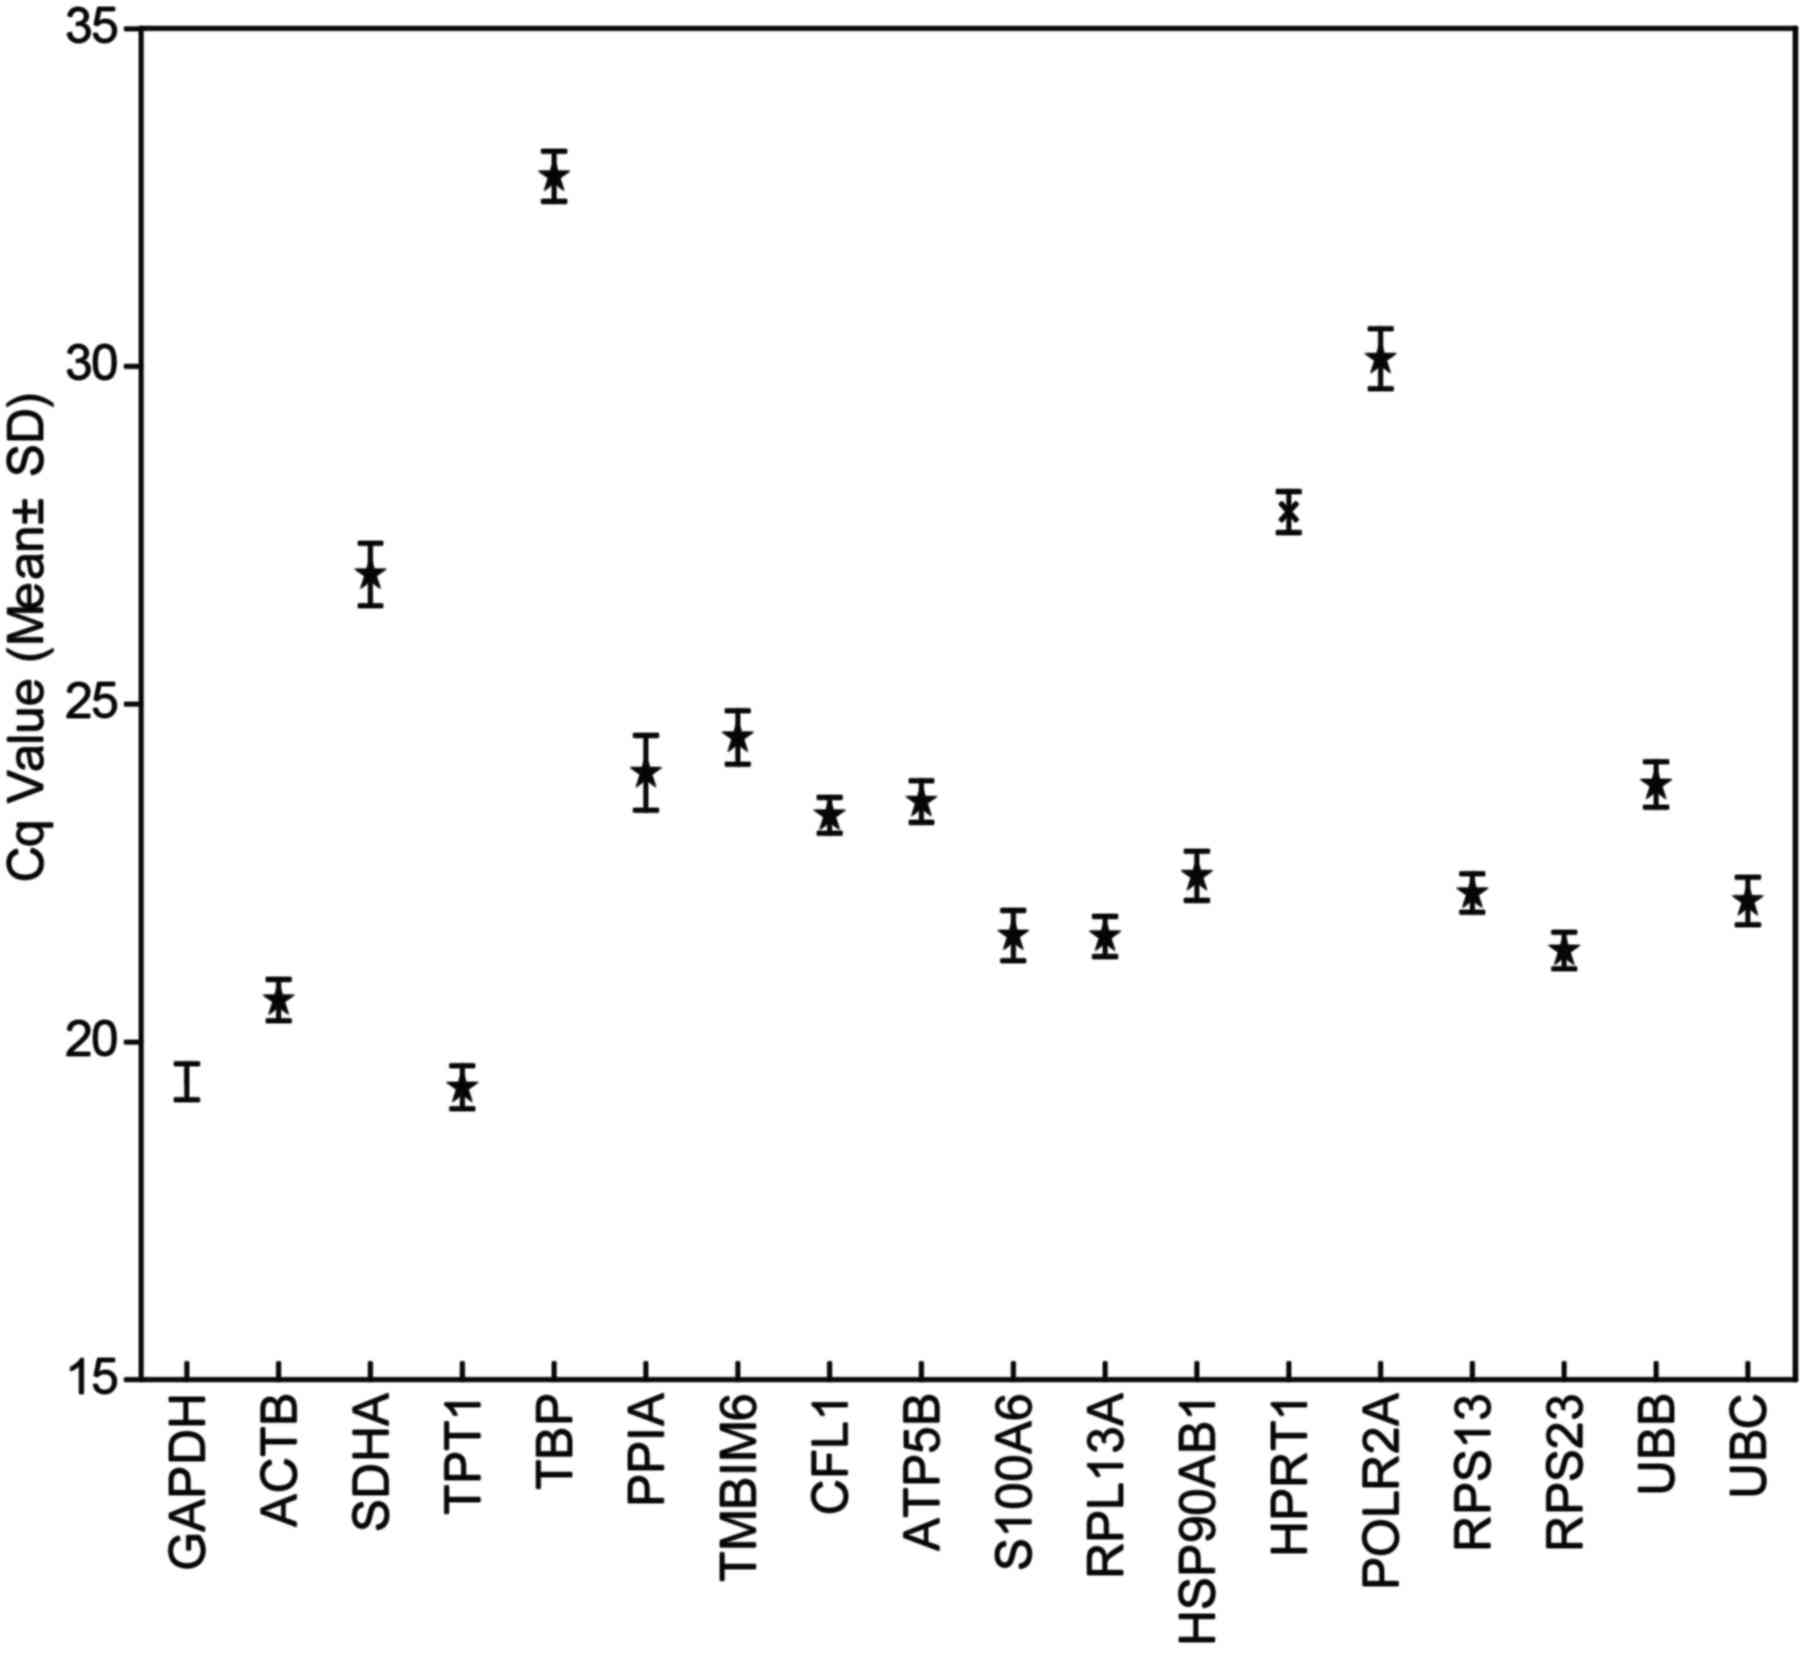
were located on different chromosomes (Table I). The Cq values of these genes vary
considerably, ranging between 17.14 [tumor protein, translationally
controlled 1 (TPT1)] and 34.9 cycles [hypoxanthine
phosphoribosyltransferase 1 (HPRT1)]. Furthermore, the scope of the
Cq values between 19 and 24 included the majority of the candidate
reference genes. Genes with lower expression levels had higher Cq
values. Above 25 cycles, these genes were succinate dehydrogenase
complex flavoprotein subunit A (SDHA), TATA box-binding protein
(TBP), HPRT1 and RNA polymerase II subunit A (POLR2A). The
remaining 14 candidate reference genes were highly expressed below
25 cycles. The expression levels of the 18 candidate reference
genes did not depend on the sex, age, tumor stage or grade of the
TCC samples. This result was consistent with the results of a
previous study (17).
An ideal reference gene is required to meet the
following criteria: i) Is usually abundant in studied tissues that
can be reliably examined in all specimens; and ii) exhibits as
little as possible expression variation across the tissue-specific
sample set investigated. For the first criterion, genes with Cq
values >25 cycles were arbitrarily selected for the exclusion of
potential reference genes from subsequent evaluation. SDHA, TBP,
HPRT1 and POLR2A exhibited lower expression levels in the TCC
samples and were excluded following an evaluation of the reference
genes (Fig. 2).
Stability of the expression of the
candidate reference genes in TCC sample ΔCq analysis
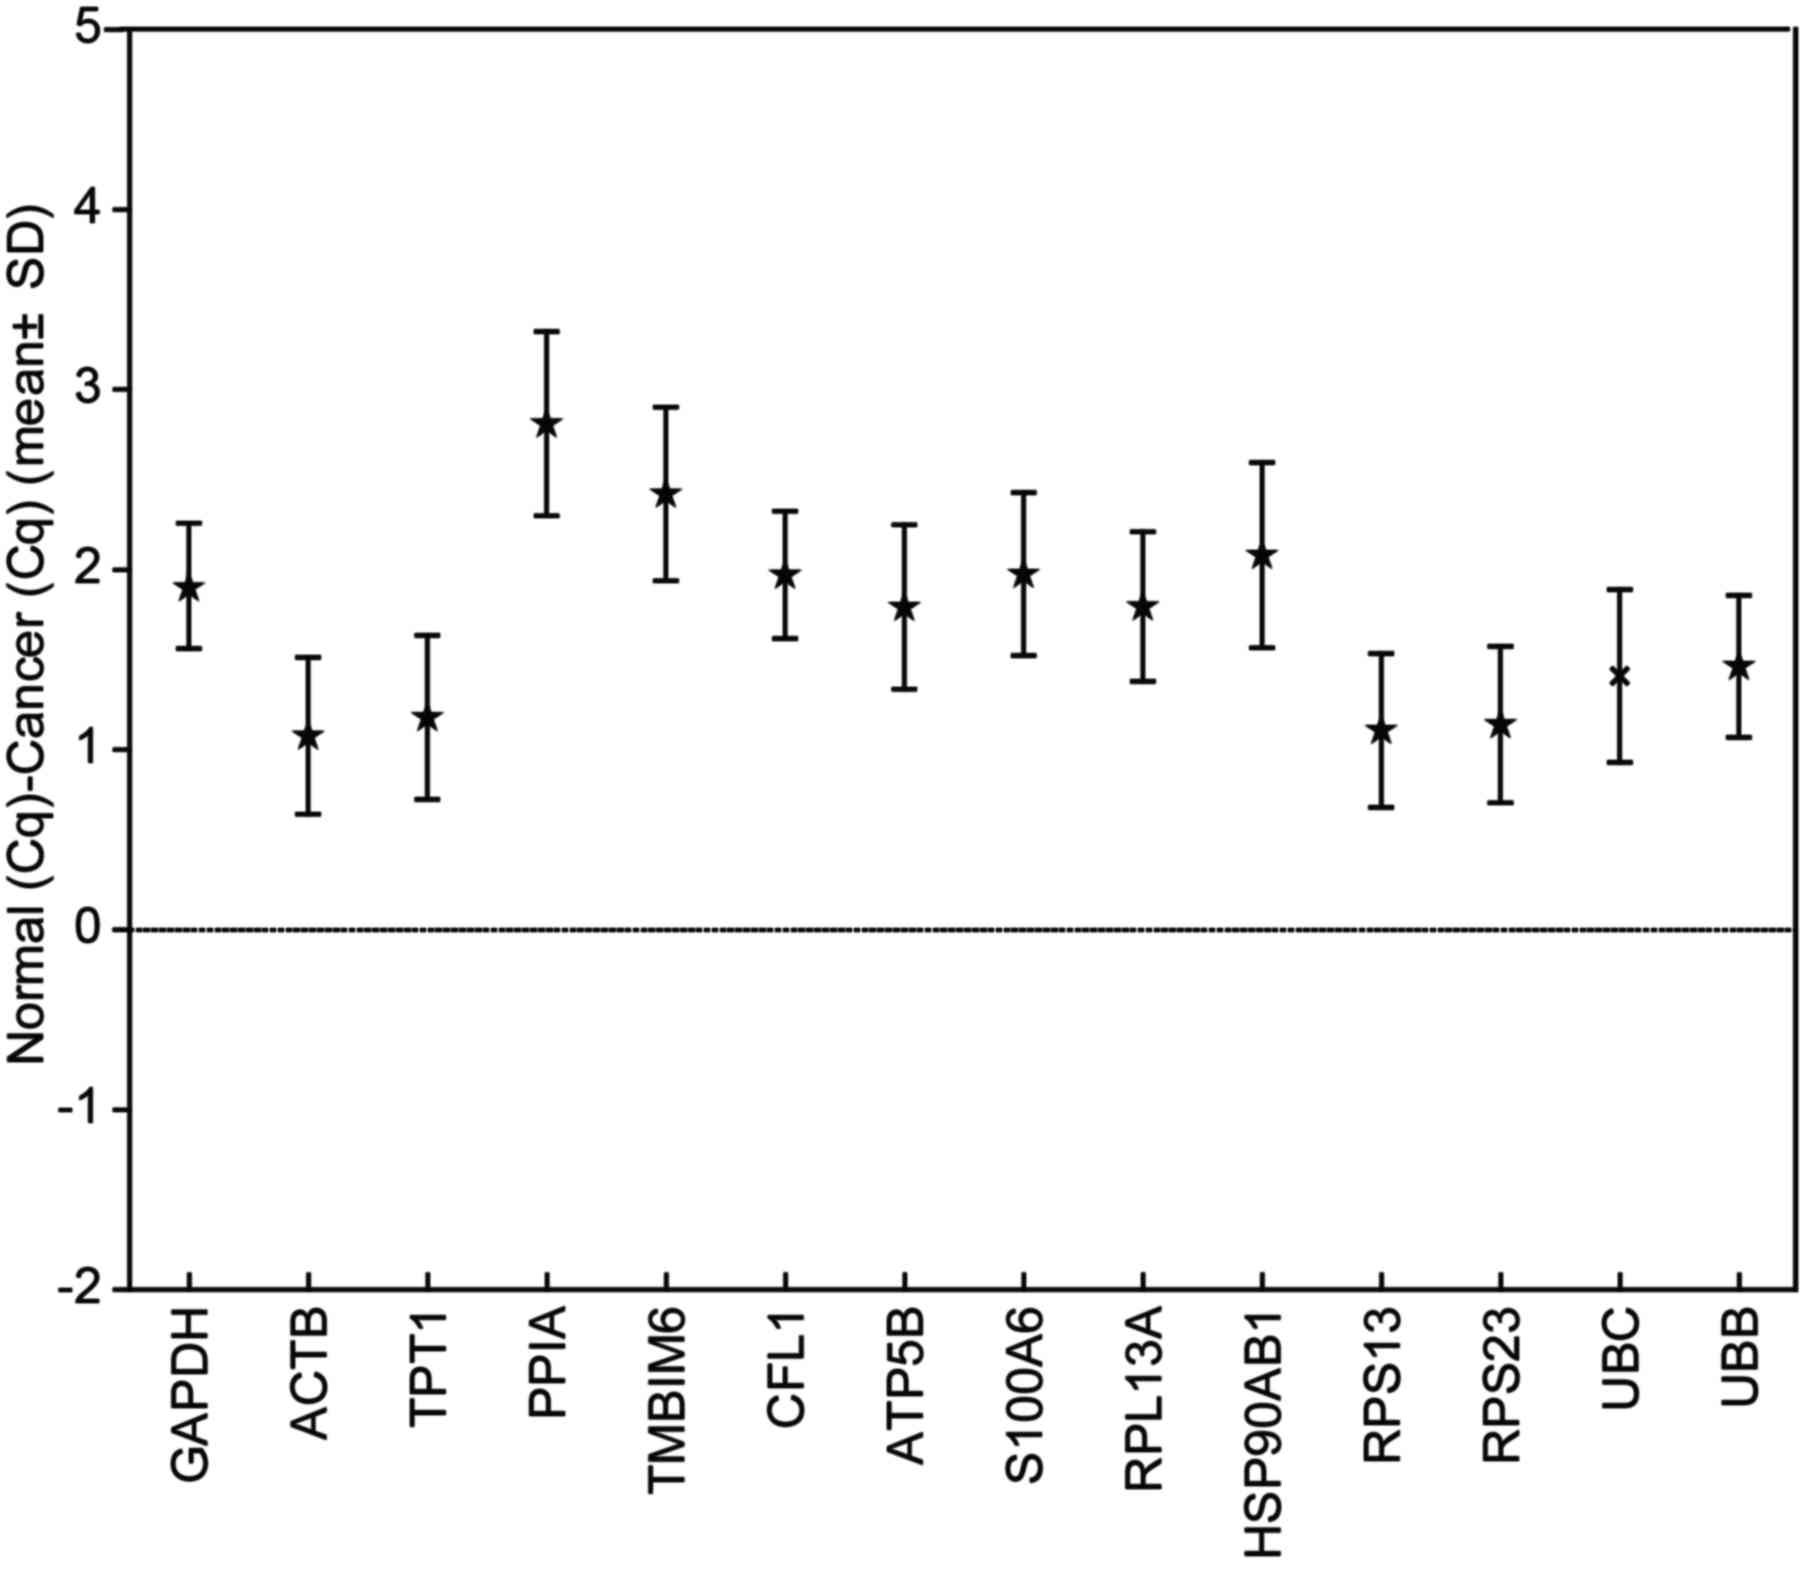
The remaining 14 genes had different transcript
level ranges over all the specimens investigated. The present study
used matched cancerous and non-cancerous TTC samples, so the Cq of
the normal sample minus the Cq of the corresponding cancer sample
(ΔCq) reflected the variation in the candidate reference genes
between individuals (Fig. 3). For the
second criterion, a ΔCq value >1.9 was arbitrarily selected to
eliminate certain candidate genes from further consideration. In
accordance with this analysis, GAPDH, peptidyl-prolyl isomerase A
(PPIA), transmembrane BAX inhibitor motif-containing 6 (TMBIM6),
heat-shock protein 90-α family class B member 1 HSP90AB1 and S100
calcium-binding protein A6 (S100A6) were excluded from the
subsequent calculations. Nevertheless, because GAPDH has been used
in a number of studies, it was decided that GAPDH would be
evaluated in the list of candidate reference genes.
A paired Student's t-test was also used to examine
differences in the expression of candidate reference genes between
the matched non-malignant and malignant specimens. There were
significant differences in gene expression for all of the
investigated reference genes, other than β-actin (ACTB) (P=0.0763),
RPS23 (P=0.0746), TPT1 (P=0.064) and RPS13 (P=0.0532). The
expression of cofilin 1 (CFL1), GAPDH, S100A6, HSP90AB1, TMBIM6 and
PPIA were all significantly increased in the malignant samples
(P<0.001) compared with the non-malignant groups. This result
was similar to that obtained for the ΔCq values.
According to above analysis, 8 genes were excluded
from the 18 candidate reference genes in the matched malignant and
non-malignant sample pairs. The remaining 10 reference genes
underwent further analysis with the mathematical software programs
geNorm (11), NormFinder (12) and BestKeeper (13).
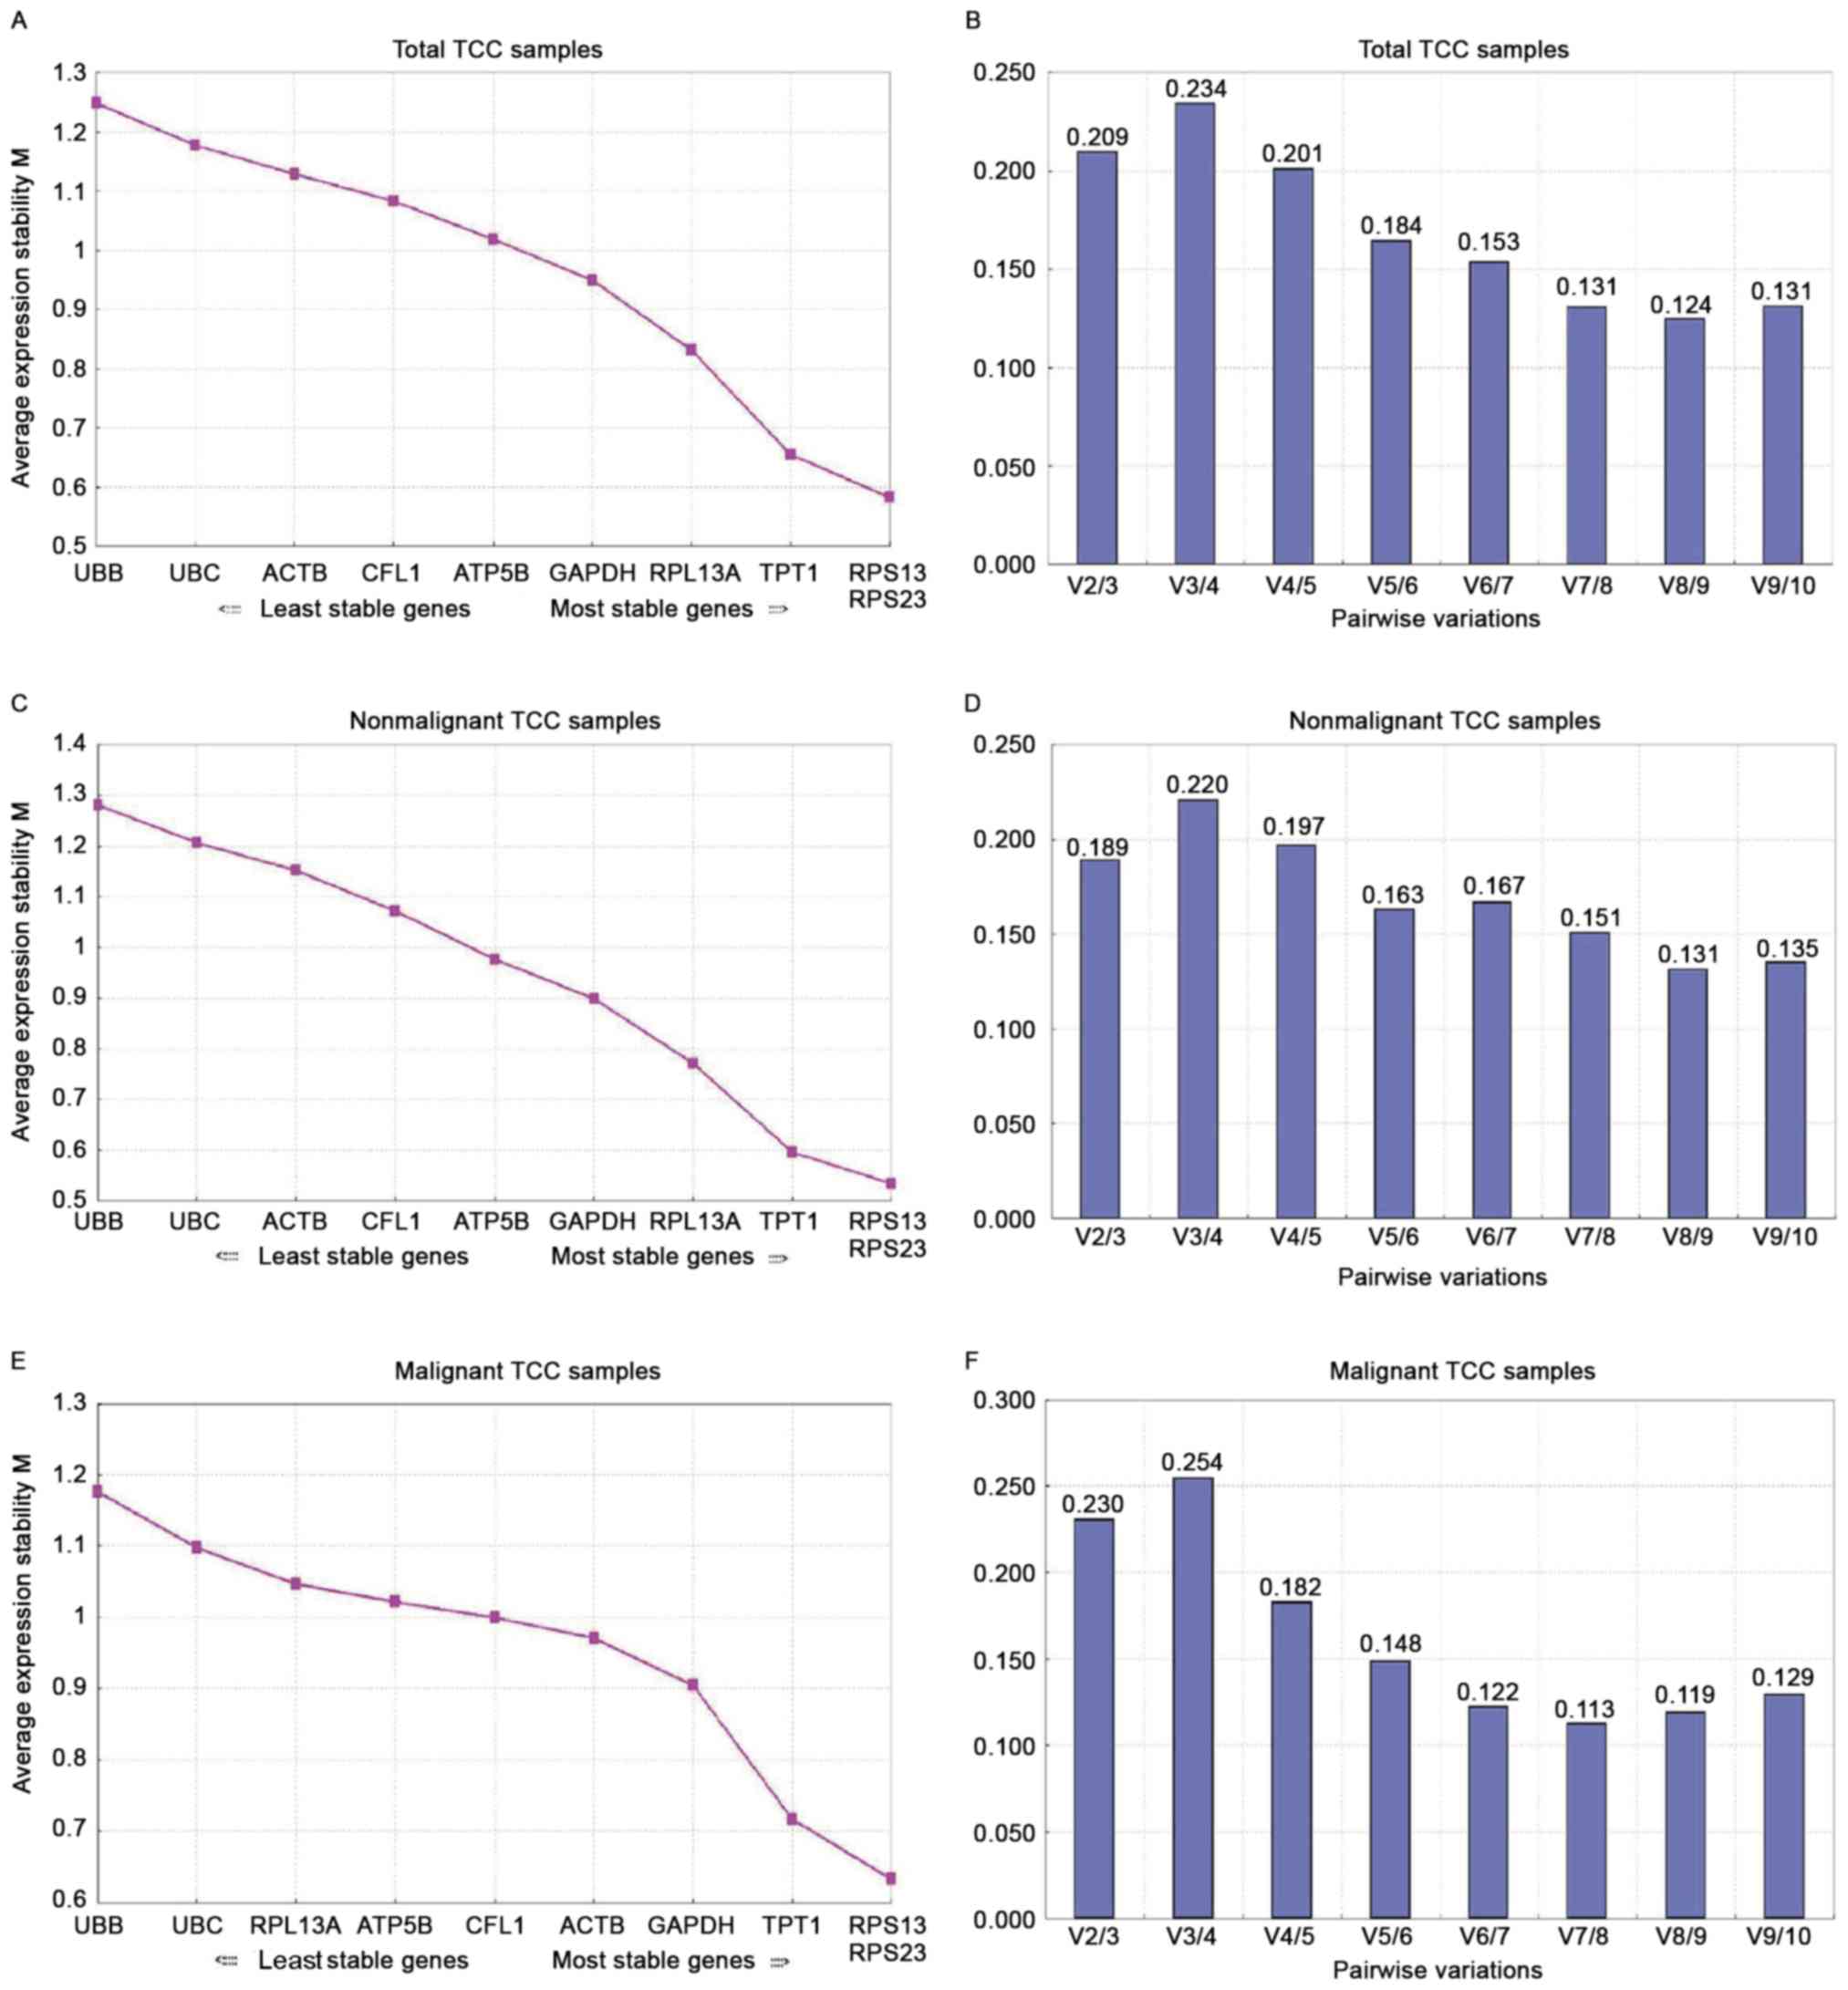
GeNorm analysis
In view of the precondition that the ratio of the
expression level of suitable reference genes must be invariable
under all experimental conditions, GeNorm calculates the M-value of
a single gene by gradually ruling out the highest-scoring reference
gene, then repeatedly recalculating in order to obtain the optimal
value.
The stability of the expression for the 10 candidate
genes is ordered according to the M-value, with the lowest M
corresponding to the most stably expressed genes. M=1.5 is the
threshold recommended for all selected reference genes. The genes
with the smallest M-value were RPS13 and RPS23 (0.58 and 0.533,
respectively), which were the most stable genes in all 70 TCC and
35 non-malignant TCC samples in the present study. The order of
gene stability, from the most to least stable gene was: RPS23,
RPS13, TPT1, RPL13A, GAPDH, ATP synthase, H+
transporting, mitochondrial F1 complex, β-polypeptide (ATP5B),
CFL1, ACTB, UBC and UBB (Fig. 4A and
C). In the malignant group, RPS23 and RPS13 were still the most
stable genes, with UBB and UBC again exhibiting the largest
M-value. For the rest of the selected reference genes, the order of
expression stability, from the most to least stable, was: TPT1,
GAPDH, ACTB, CFL1, ATB5B and RPL13A (Fig.
4E). The M-values of the ten genes were <1 in the TCC
samples, below the default threshold of 1.5, suggesting a
relatively high stability of expression of the selected genes
(Fig. 4).
GeNorm also offers a normalization factor for
determining the optimal number of candidates by calculating the
pairwise value of variation, V. For the selection of RT-qPCR
reference genes, 0.2 is recommended as the threshold value. A total
of 4 genes were required for good normalization in the all-TCC
sample group, whereas two genes and four genes were required in the
non-malignant and malignant group, respectively (Fig. 4B, D and F).
NormFinder analysis
NormFinder is also a freely available tool for
evaluating gene stability for normalization, ranking the candidate
reference genes according to the output value, M. Those with the
lowest M-value are considered to be the most stable reference
genes. This approach combines the intergroup and intragroup
expression variations of the candidate reference genes. The results
calculated using NormFinder are listed in Table IV.
| Table IV.NormFinder analysis of 10 reference
genes. |
Table IV.
NormFinder analysis of 10 reference
genes.
| Rank order | Gene name | Stability value in
all samples | Gene name | Stability value in
normal samples | Gene name | Stability value in
cancer samples |
|---|
| 1 | UBC | 0.168 | RPS23 | 0.196 | RPS23 | 0.183 |
| 2 | UBB | 0.185 | ATP5B | 0.203 | GAPDH | 0.233 |
| 3 | TPT1 | 0.186 | TPT1 | 0.296 | ACTB | 0.249 |
| 4 | RPS23 | 0.187 | GAPDH | 0.327 | RPS13 | 0.289 |
| 5 | ATP5B | 0.194 | RPS13 | 0.339 | TPT1 | 0.290 |
| 6 | RPL13A | 0.205 | RPL13A | 0.426 | ATP5B | 0.346 |
| 7 | RPS13 | 0.207 | CFL1 | 0.592 | CFL1 | 0.374 |
| 8 | GAPDH | 0.215 | ACTB | 0.602 | RPL13A | 0.467 |
| 9 | ACTB | 0.230 | UBC | 0.628 | UBC | 0.493 |
| 10 | CFL1 | 0.241 | UBB | 0.807 | UBB | 0.745 |
In this analysis, RPS23 was ranked the highest in
the non-malignant and malignant groups. This was unexpected, as UBC
was the most stably expressed candidate gene in all the TCC
samples, which was the exact opposite of the result obtained using
geNorm. This discrepancy may reflect differences in the algorithm
utilized. Broadly speaking, the best two-gene combination from the
NormFinder program was that of ATP5B and RPS23 (M=0.081). M values
reflect gene expression stability.
BestKeeper analysis
BestKeeper is a commonly used software program that
evaluates the stability of reference gene expression directly using
raw Cq values. The BestKeeper index uses R to reveal gene
expression variation, which is determined by calculating the
coefficient of variance and standard deviation of the Cq set.
According to the BestKeeper analysis, RPS23
(R=0.967), TPT1 (R=0.964) and ATP5B (R=0.964) demonstrated the
optimal associations (P<0.001 for the TCC specimens) (Table V). ATP5B, RPS23 and TPT1 were the
optimal candidate reference genes in the non-malignant group. TPT1,
RPS23 and ACTB were the top three genes in the malignant group.
| Table V.BestKeeper analysis of ten candidate
reference genes. |
Table V.
BestKeeper analysis of ten candidate
reference genes.
| Rank order | Gene name | R-value (P-value)
in all samples | Gene name | R-value (P-value)
in normal samples | Gene name | R-value (P-value)
in cancer samples |
|---|
| 1 | RPS23 | 0.967 (0.01) | ATP5B | 0.973 (0.01) | TPT1 | 0.97 (0.01) |
| 2 | TPT1 | 0.964 (0.01) | RPS23 | 0.971 (0.01) | RPS23 | 0.963 (0.01) |
| 3 | ATP5B | 0.964 (0.01) | TPT1 | 0.968 (0.01) | ACTB | 0.955 (0.01) |
| 4 | UBC | 0.954 (0.01) | UBC | 0.963 (0.01) | GAPDH | 0.954 (0.01) |
| 5 | GAPDH | 0.95 (0.01) | GAPDH | 0.96 (0.01) | RPL13A | 0.948 (0.01) |
| 6 | RPS13 | 0.947 (0.01) | RPS13 | 0.95 (0.01) | RPS13 | 0.947 (0.01) |
| 7 | RPL13A | 0.942 (0.01) | ACTB | 0.939 (0.01) | ATP5B | 0.946 (0.01) |
| 8 | ACTB | 0.938 (0.01) | RPL13A | 0.933 (0.01) | UBC | 0.942 (0.01) |
| 9 | CFL1 | 0.921 (0.01) | CFL1 | 0.926 (0.01) | CFL1 | 0.921 (0.01) |
| 10 | UBB | 0.908 (0.01) | UBB | 0.92 (0.01) | UBB | 0.878 (0.01) |
Final ranking of the selected
candidate reference genes
Considering the discrepancies among the four
algorithms, a method was used to calculate the final ranking of
candidate reference genes (24).
Specifically, the geometric mean for each gene was calculated using
the four ranking numbers produced by ΔCq analysis (of the
corresponding non-malignant and malignant samples) using geNorm,
NormFinder and BestKeeper. The genes with the smallest geometric
means were identified as the most stable (Table VI).
| Table VI.Final ranking of 10 candidate
reference genes in all transitional cell carcinoma samples. |
Table VI.
Final ranking of 10 candidate
reference genes in all transitional cell carcinoma samples.
| Rank | ΔCq | Ge Norm | Norm Finder | Best Keeper | Overall |
|---|
| 1 | ACTB | RPS23 | UBC | RPS23 | RPS23 |
| 2 | RPS13 | RPS13 | UBB | TPT1 | TPT1 |
| 3 | RPS23 | TPT1 | TPT1 | ATP5B | RPS13 |
| 4 | TPT1 | RPL13A | RPS23 | UBC | UBC |
| 5 | UBC | GAPDH | ATP5B | GAPDH | ACTB |
| 6 | UBB | ATP5B | RPL13A | RPS13 | ATP5B |
| 7 | ATP5B | CFL1 | RPS13 | RPL13A | UBB |
| 8 | RPL13A | ACTB | GAPDH | ACTB | RPL13A |
| 9 | CFL1 | UBC | ACTB | CFL1 | GAPDH |
| 10 | GAPDH | UBB | CFL1 | UBB | CFL1 |
RPS23 was identified as the most stable single gene
from the analysis, with RPS23, TPT1 and RPS13 being the optimal
reference gene set in all the TCC samples. RPS13, RPS23 and TPT1
were also suitable reference genes for the matched non-malignant
and malignant samples. The overall rank for the matched
non-malignant and malignant samples is not presented, as the final
ranking for all of the TCC samples illustrates this point.
Discussion
The aim of the present study was to identify the
most stable reference genes to ensure credible evaluation of the
transcript levels of genes of interest in human bladder cancer,
specifically TCC. A total of 18 candidate reference genes were
selected from a variety of databases and previous publications that
investigated reference gene expression profiles (11–16); these
selected genes were assessed using SYBR-Green RT-qPCR in 35 pairs
of matched non-malignant and malignant samples. The results of the
present study demonstrate that the most stable reference gene was
the rarely used RPS23, and the optimal three-gene combination,
RPS23, TPT1 and RPS13, was found to be optimal for all the TCC
samples, on the basis of the results of the four algorithms
used.
To obtain reliable results in the RT-qPCR analysis,
a concerted effort was made to ensure that each of the following
criteria was met: i) All the bladder cancer samples were TCC, which
is the most frequent subtype, and each sample included a malignant
specimen and corresponding non-malignant specimen; ii) according to
the MIQE guidelines (7), the quality
and quantification of RNA and the specificity of each gene primer
was strictly controlled; iii) a careful selection was carried out
of 18 candidate genes from previous databases and publications
reporting stable gene expression profiles (11–16); and
iv) three commonly used software programs, geNorm, NormFinder and
BestKeeper were combined with Student's t-test and ΔCq analysis to
evaluate the candidate reference genes.
To the best of our knowledge, there are two
published studies on the selection of the optimal reference gene
for bladder cancer, with only one having been performed using
SYBR-Green (12), although it was not
assessed with matched sample pairs and different mathematical
algorithms. Although the other study used matched sample pairs (14
pairs), it was performed with TaqMan methods (15). In general, the SYBR-Green method is
cheaper and easier to use than TaqMan, but can lead to
false-positive results owing to the presence of non-specific
products, such as primer-dimers; these incorrect and shifted data
may ultimately diminish the accuracy (24). In the present study, this potential
problem was controlled for by the running of agarose gels and
checking the Tm values to guarantee the accuracy of the
unique qPCR product.
A large number of factors influence the expression
level of genes in tumor tissues; these include the type, age, stage
and grade of the tumor samples investigated. In the present study,
the results indicate that the expression of none of the candidate
reference genes was dependent on the sex, tumor stage or grade of
the TCC samples. An ideal reference gene is one that is usually
abundant in the studied tissues, meaning that it can be reliably
measured in all of the studied materials. Thus, the Cq value of a
gene was arbitrarily selected at >25 cycles for the exclusion of
potential internal genes. Accordingly, SDHA, TBP, HPRT1 and POLR2A
were excluded following evaluation of the reference genes in this
analysis.
To compare the evaluation results, the same
candidate reference genes as those selected in two published
studies (12,15) were selected. In the study by Andersen
et al (12), HSP90AB1, TMBIM6
and ATP5B were reported to be the optimal reference genes. However,
TBP and SDHA were the optimal reference genes in the study by Ohl
et al (15). These genes in
these two studies are not included in the results of the present
study, a discrepancy that may have arisen owing to differing qPCR
conditions, mathematical methods and, most importantly, TCC
samples. As mentioned in the study by Ohl et al (14), when using a greater number of matched
pairs of non-cancerous and cancerous samples, the accuracy of the
result was increased. Subsequently, the present study used a paired
Student's t-test and 2−ΔΔCq analysis to examine
significant differences between the expression levels of the
candidate reference genes in the non-malignant and malignant sample
pairs. Consequently, SDHA, TBP, HPRT1, POLR2A, CFL1, S100A6,
HSP90AB1, TMBIM6 and PPIA were excluded from further analysis.
The readily available software programs geNorm,
NormFinder and BestKeeper were used to evaluate the optimal genes
from a set of candidate reference genes (23). Of these three programs, geNorm and
NormFinder are able to provide the optimal combination of reference
genes. In the case of NormFinder analysis, it is also possible to
obtain the optimal single reference gene. NormFinder combines the
intergroup and intragroup expression variations of the candidate
reference genes, reducing the bias of the result. Unlike other
algorithms, the output of BestKeeper has the capacity to analyze
<10 selected reference genes. The results obtained using these
programs differed somewhat, although this was generally acceptable
as each program used different statistical algorithms. The more
programs used, the more promising the results obtained in the
evaluation of reference genes. Despite the slight discrepancies
between the programs, the results from all of these algorithms
indicate that RPS23 was the optimal single gene for normalization,
and RPS23, TPT1 and RPS13 comprised the optimal combination of
reference genes for evaluating TCC samples.
In conclusion, the results of the present study
demonstrate that RPS23 was the most stably expressed reference
gene, with the three most stable genes, RPS23, TPT1 and RPS13,
comprising the most suitable geneset for all bladder samples. These
reference genes may be used for gene normalization in studies of
TCC gene expression, which are important for seeking novel
molecular markers for bladder cancer in the future.
References
|
1
|
Torre LA, Bray F, Siegel RL, Ferlay J,
Lortet-Tieulent J and Jemal A: Global cancer statistics, 2012. CA
Cancer J Clin. 65:87–108. 2015. View Article : Google Scholar : PubMed/NCBI
|
|
2
|
Siegel RL, Miller KD and Jemal A: Cancer
Statistics, 2015. CA Cancer J Clin. 65:5–29. 2015. View Article : Google Scholar : PubMed/NCBI
|
|
3
|
Kaufman DS, Shipley WU and Feldman AS:
Bladder cancer. Lancet. 374:239–249. 2009. View Article : Google Scholar : PubMed/NCBI
|
|
4
|
Babjuk M, Burger M, Zigeuner R, Shariat
SF, van Rhijn BW, Compérat E, Sylvester RJ, Kaasinen E, Böhle A,
Palou Redorta J, et al: EAU guidelines on non-muscle-invasive
urothelial carcinoma of the bladder: Update 2013. Eur Urol.
64:639–53. 2013. View Article : Google Scholar : PubMed/NCBI
|
|
5
|
Nseyo UO and Lamm DL: Immunotherapy of
bladder cancer. Semin Surg Oncol. 13:342–9. 1997. View Article : Google Scholar : PubMed/NCBI
|
|
6
|
van Rhijn BW, van der Poel HG and van der
Kwast TH: Urine markers for bladder cancer surveillance: A
systematic review. Eur Urol. 47:36–48. 2005. View Article : Google Scholar
|
|
7
|
Bustin SA, Benes V, Garson JA, Hellemans
J, Huggett J, Kubista M, Mueller R, Nolan T, Pfaffl MW, Shipley GL,
et al: The MIQE guidelines: Minimum information for publication of
quantitative real-time PCR experiments. Clin Chem. 55:611–622.
2009. View Article : Google Scholar : PubMed/NCBI
|
|
8
|
Li YL, Ye F, Hu Y, Lu WG and Xie X:
Identification of suitable reference genes for gene expression
studies of human serous ovarian cancer by real-time polymerase
chain reaction. Anal Biochem. 394:110–116. 2009. View Article : Google Scholar : PubMed/NCBI
|
|
9
|
Warrington JA, Nair A, Mahadevappa M and
Tsyganskaya M: Comparison of human adult and fetal expression and
identification of 535 housekeeping/maintenance genes. Physiol
Genomics. 2:143–147. 2000.PubMed/NCBI
|
|
10
|
Thellin O, Zorzi W, Lakaye B, De Borman B,
Coumans B, Hennen G, Grisar T, Igout A and Heinen E: Housekeeping
genes as internal standards: Use and limits. J Biotechnol.
75:291–295. 1999. View Article : Google Scholar : PubMed/NCBI
|
|
11
|
Vandesompele J, De Preter K, Patty F,
Poppe B, Van Roy N, De Paepe A and Speleman F: Accurate
normalization of real-time quantitative RT-PCR data by geometric
averaging of multiple internal control genes. Genome Biol.
3:RESEARCH00342002. View Article : Google Scholar : PubMed/NCBI
|
|
12
|
Andersen CL, Jensen JL and Ørntoft TF:
Normalization of real-time quantitative reverse transcription-PCR
data: A model-based variance estimation approach to identify genes
suited for normalization, applied to bladder and colon cancer data
sets. Cancer Res. 64:5245–5250. 2004. View Article : Google Scholar : PubMed/NCBI
|
|
13
|
Pfaffl MW, Tichopad A, Prgomet C and
Neuvians TP: Determination of stable housekeeping genes,
differentially regulated target genes and sample integrity:
BestKeeper-Excel-based tool using pair-wise correlations.
Biotechnol Lett. 26:509–515. 2004. View Article : Google Scholar : PubMed/NCBI
|
|
14
|
Leduc V, Legault V, Dea D and Poirier J:
Normalization of gene expression using SYBR green qPCR: A case for
paraoxonase 1 and 2 in Alzheimer's disease brains. J Neurosci
Methods. 200:14–19. 2011. View Article : Google Scholar : PubMed/NCBI
|
|
15
|
Ohl F, Jung M, Radonić A, Sachs M, Loening
SA and Jung K: Identification and validation of suitable endogenous
reference genes for gene expression studies of human bladder
cancer. J Urol. 175:1915–1920. 2006. View Article : Google Scholar : PubMed/NCBI
|
|
16
|
Radonić A, Thulke S, Mackay IM, Landt O,
Siegert W and Nitsche A: Guideline to reference gene selection for
quantitative real-time PCR. Biochem Biophys Res Commun.
313:856–862. 2004. View Article : Google Scholar : PubMed/NCBI
|
|
17
|
Kent WJ, Sugnet CW, Furey TS, Roskin KM,
Pringle TH, Zahler AM and Haussler D: The human genome browser at
UCSC. Genome Res. 12:996–1006. 2002. View Article : Google Scholar : PubMed/NCBI
|
|
18
|
Jacob F, Guertler R, Naim S, Nixdorf S,
Fedier A, Hacker NF and Heinzelmann-Schwarz V: Careful selection of
reference genes is required forreliable performance of RT-qPCR in
human normal andcancer cell lines. PLoS One. 8:e591802013.
View Article : Google Scholar : PubMed/NCBI
|
|
19
|
Zhou ZJ, Zhang JF, Xia P, Wang JY, Chen S,
Fang XQ and Fan SW: Selection of suitable reference genes for
normalization of quantitative real-time polymerasechain reaction in
human cartilage endplate of the lumbar spine. PLoS One.
9:e888922014. View Article : Google Scholar : PubMed/NCBI
|
|
20
|
Cicinnati VR, Shen Q, Sotiropoulos GC,
Radtke A, Gerken G and Beckebaum S: Validation of putative
reference genes for gene expression studies in human hepatocellular
carcinoma using real-time quantitative RT-PCR. BMC Cancer.
8:3502008. View Article : Google Scholar : PubMed/NCBI
|
|
21
|
Freeman WM, Walker SJ and Vrana KE:
Quantitative RT-PCR: Pitfalls and potential. Biotechniques.
26:112–122, 124-125. 1999.PubMed/NCBI
|
|
22
|
Pombo-Suarez M, Calaza M, Gomez-Reino JJ
and Gonzalez A: Reference genes for normalization of gene
expression studies in human osteoarthritic articular cartilage. BMC
Mol Biol. 9:172008. View Article : Google Scholar : PubMed/NCBI
|
|
23
|
Jacob F, Guertler R, Naim S, Nixdorf S,
Fedier A, Hacker NF and Heinzelmann-Schwarz V: Careful selection of
reference genes is required for reliable performance of RT-qPCR in
human normal and cancer cell lines. PLoS One. 8:e591802013.
View Article : Google Scholar : PubMed/NCBI
|
|
24
|
Chen D, Pan X, Xiao P, Farwell MA and
Zhang B: Evaluation and identification of reliable reference genes
for pharmacogenomics, toxicogenomics, and small RNA expression
analysis. J Cell Physiol. 226:2469–2477. 2011. View Article : Google Scholar : PubMed/NCBI
|
|
25
|
Sobin LH, Gospodariwicz M and Wittekind C:
TNM classification of malignant tumorsU1CC 1nternational Union
Against Cancer. 7th edition. Wiley-Blackwell; pp. 262–265. 2009
|